3493
Simultaneous triglyceride characterization and water T1 estimation in a breath-hold applied to brown adipose tissue using MR fingerprinting1Vanderbilt University Institute of Imaging Science, Vanderbilt University Medical Center, Nashville, TN, United States, 2Radiology and Radiological Sciences, Vanderbilt University Medical Center, Nashville, TN, United States, 3Stephens Family Clinical Research Institute Carle Foundation Hospital, Urbana, IL, United States, 4Division of Cardiovascular Medicine, Vanderbilt University Medical Center, Nashville, TN, United States
Synopsis
Multi-parametric fat-water imaging of brown adipose tissue (BAT) is an important tool to study BAT’s composition and metabolism. We propose a single breath-hold MR fingerprinting method to simultaneously estimate the triglyceride number of double bonds (NDB) and number of methylene-interrupted double bonds (NMIDB), as well as water T1. We provide results of simulation, phantom, and example human BAT studies. The proposed method’s NDB and NMIDB estimates strongly correlate with MRS estimates (ρ = 0.998), and the T1 estimates are similar to those from MRS. The NDB, NMIDB, and T1 estimates in/around BAT are similar to those from the literature.
Introduction
MRI estimation of triglyceride (TG) characteristics is becoming a well-researched tool to study adipose tissue1–7, while other MRI/MR fingerprinting (MRF) methods demonstrate simultaneous water relaxometry with fat fraction (FF) estimation8–13. The study of brown adipose tissue (BAT) is enhanced using relaxometry and TG saturation estimation.14,15 However, simultaneous MRI estimation of water T1 with TG properties is relatively understudied. We propose a method to estimate the TG mean number of double bonds (NDB) and mean number of methylene-interrupted double bonds (NMIDB) simultaneously with water T1 in a single breath-hold, while accounting for magnetic field heterogeneity. The proposed approach is validated in simulation and phantom studies and applied in BAT.Methods
Our approach used a variation on multi-echo Dixon MRF8,10,11 and low rank (LR) reconstruction16,17 with separable T1 relaxation and TG models. The proposed method permits variations in T1 between TG peaks.The imaging sequence used an inversion recovery spoiled gradient-echo sequence with variable flip angles and 20 echoes that provided T1, B1+, and chemical shift sensitivity: TI = 40 ms, TR = 35 ms, FA = 3-25°, 1st TE = 3.1 ms (2.9 ms in vivo), ΔTE = 1.3 ms (1.0 ms in vivo), 720 excitations, scan duration = 25 s. A golden-angle 2-D radial k-space trajectory was used: FOV = 256 mm x 256 mm (320 mm x 320 mm in vivo) , in-plane resolution 1 mm x 1 mm (1.5 mm x 1.5 mm in vivo), 5 mm slice thickness, readout bandwidth = 957 Hz/pix (1438 Hz/pix in vivo). All imaging was done on a Philips Elition 3 T (Philips Healthcare, The Netherlands) with multi-channel receive coils.
The signal models for T1/B1+ (inter-excitation) and TE (intra-excitation) signal domains used, respectively, extended phase graphs18 and an 11-peak spectral model including TG and water. In a second reconstruction step, a constrained TG model19 with an acyl chain length constraint1,5, reduced the TE domain model from 11 to 4 components.
Image data were reconstructed from the undersampled radial data using a LR reconstruction framework with subspace modeling16. The reconstruction occurred in two phases. Following a k-space correction to the bipolar readouts20, singular images were reconstructed for each TE and each coil channel by using LR reconstruction with a sub-space basis estimated from the MRF T1/B1+ dictionary. Coil sensitivity maps were estimated from the first singular images of the first echo using matched filtering21. The T2* and B0 maps were subsequently estimated using variable projection. Then, T1/B1+ and TE domain singular images were jointly reconstructed with the T1/B1+ basis, constrained TE basis, and sensitivity maps using the prior rate map estimates.
Estimation of NDB and NMIDB was made from the singular images from the LR reconstruction. The water T1 and B1+ estimates were made from the water-separated singular images.
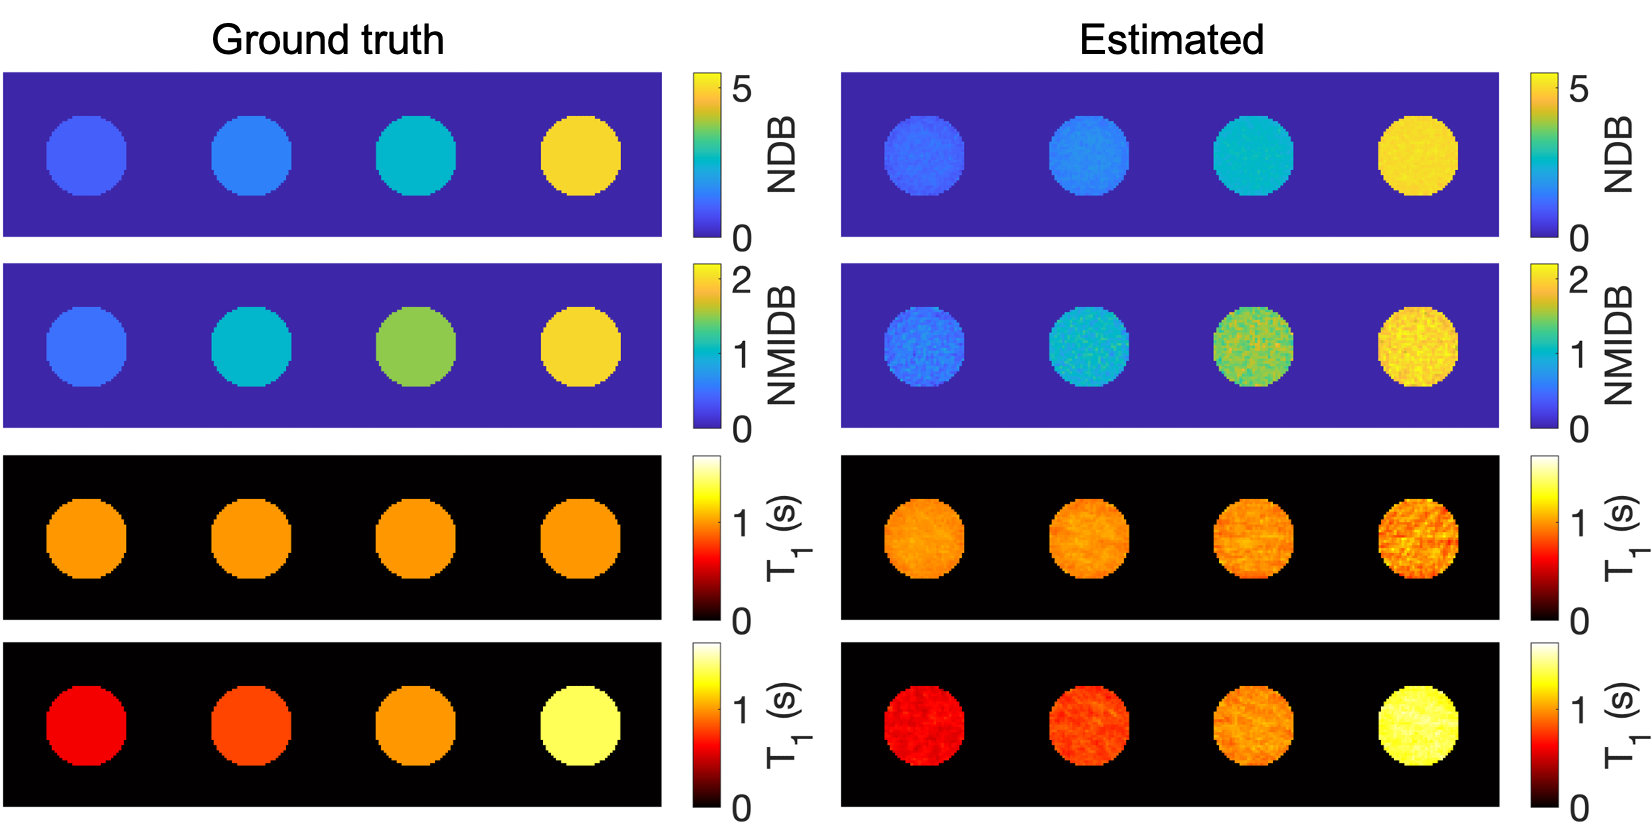
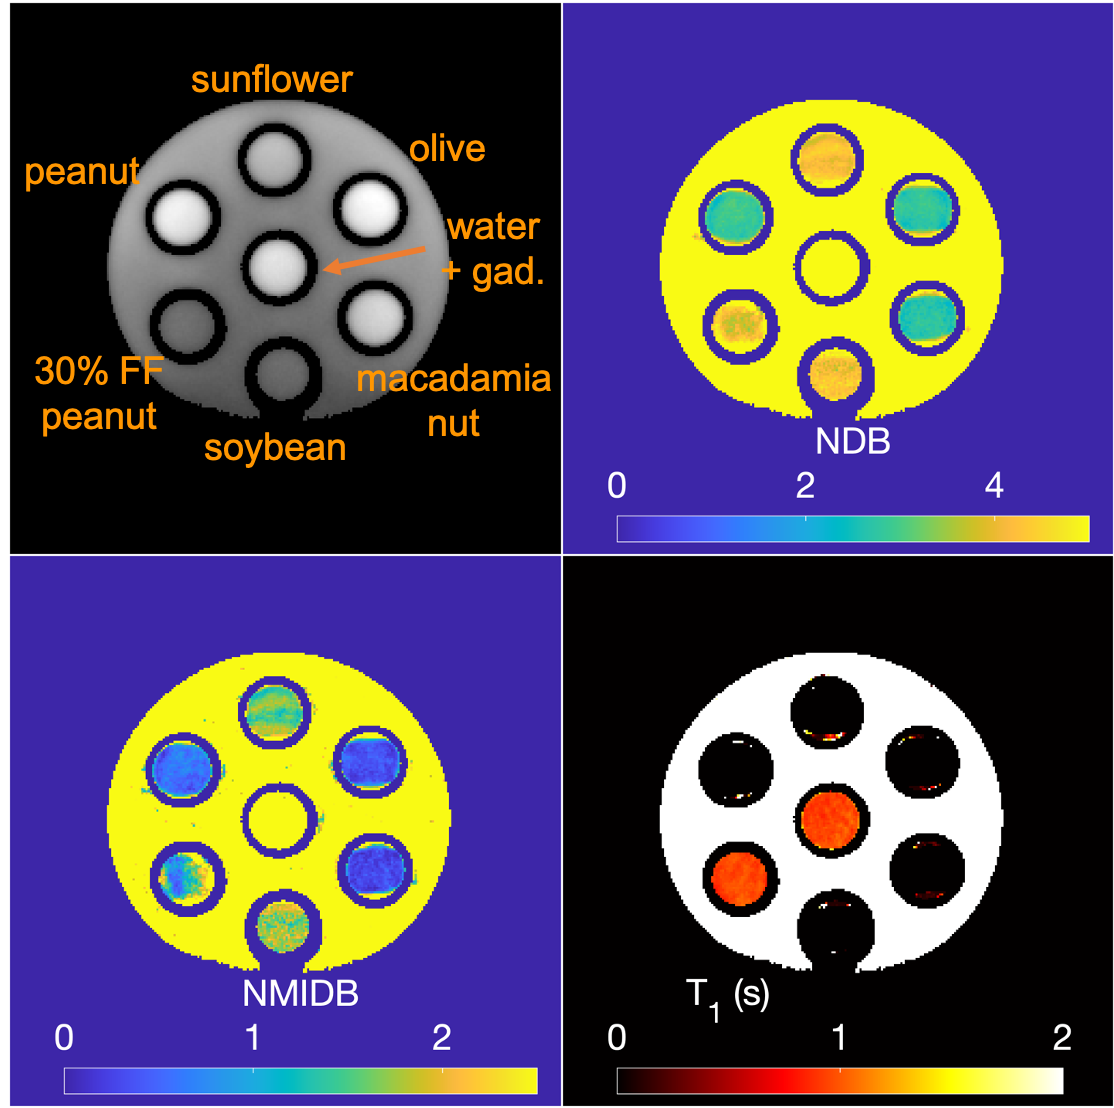
To validate the approach and provide an application to BAT, a simulation and a phantom experiment were performed and a single subject was imaged. For the simulation, TG tubes with differing NDB, NMIDB, FF, and water T1 were arrayed (Fig. 1) with B0 and B1+ offsets, T2* decay, and complex noise added to k-space (SNR = 20 dB). For the phantom experiment, a series of vegetable oils were used. Tubes with FF = 30% and 0% were also used. STEAM MRS for each phantom tube were acquired with minimum TE and TM for comparison. Multi-TI MRS in two phantom tubes containing water were acquired to estimate water T1. MRS TG peaks were fit using a constrained model within jMRUI22 using AMARES23. A subject was imaged in the BAT depot with approval of the institutional review board and after providing informed consent.
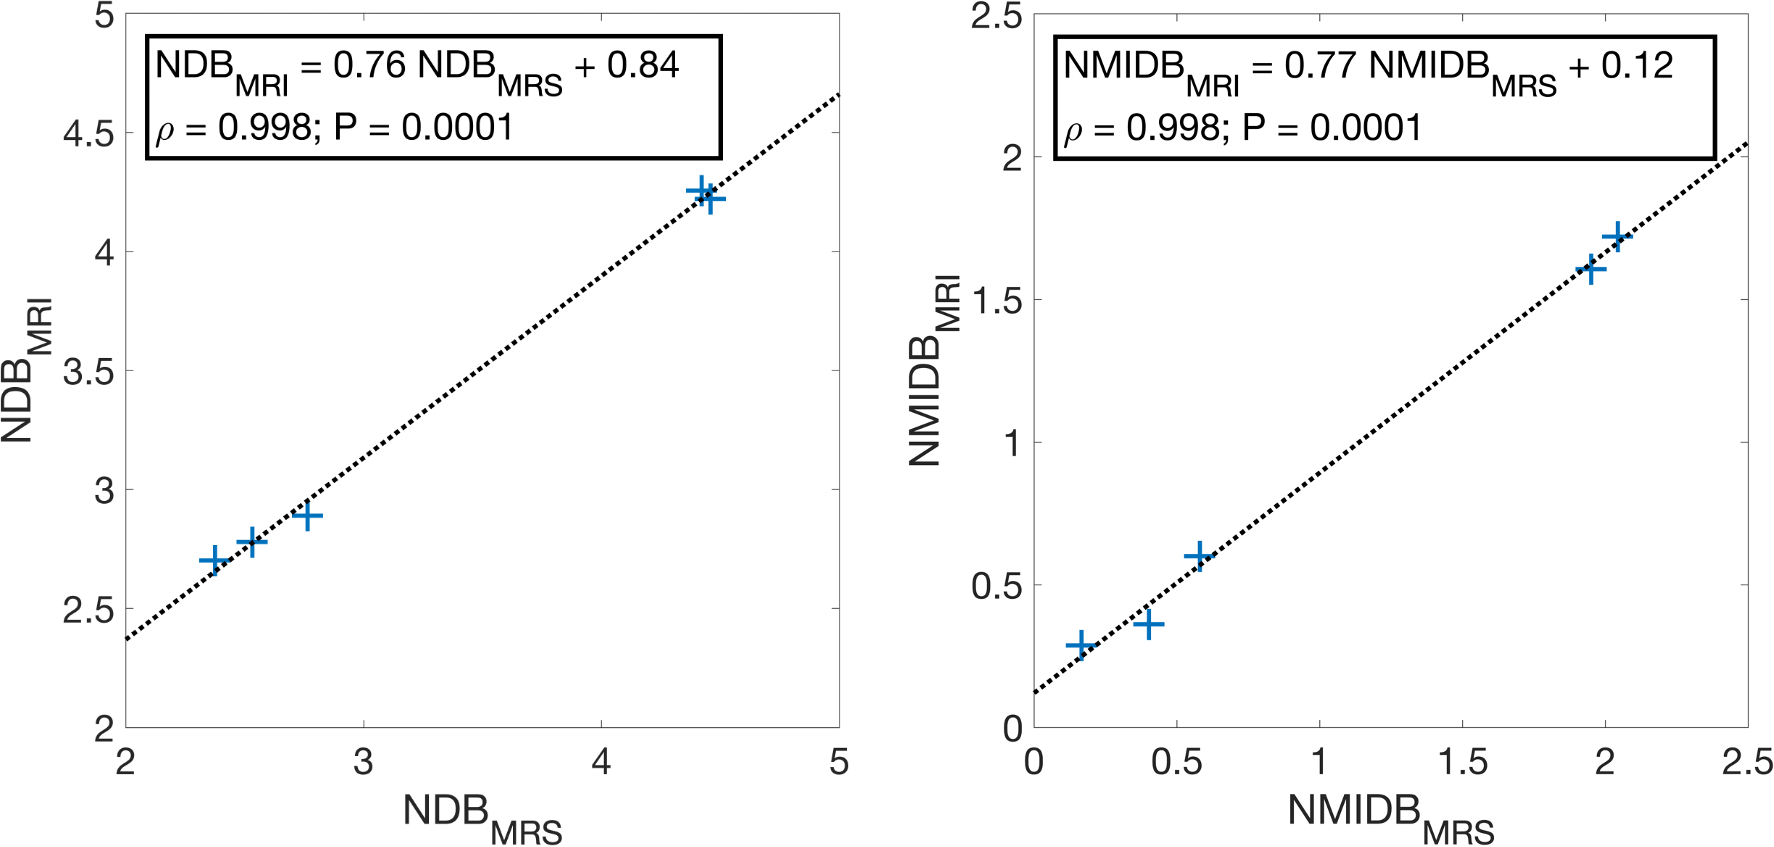
Regions of interest (ROI) were drawn on the phantom and in vivo reconstructed images, and summary statistics were calculated for each ROI. The Pearson correlation and P-value between the phantom NDB and NMIDB MRS and proposed methods were estimated, as well as the linear regression parameters.
Results
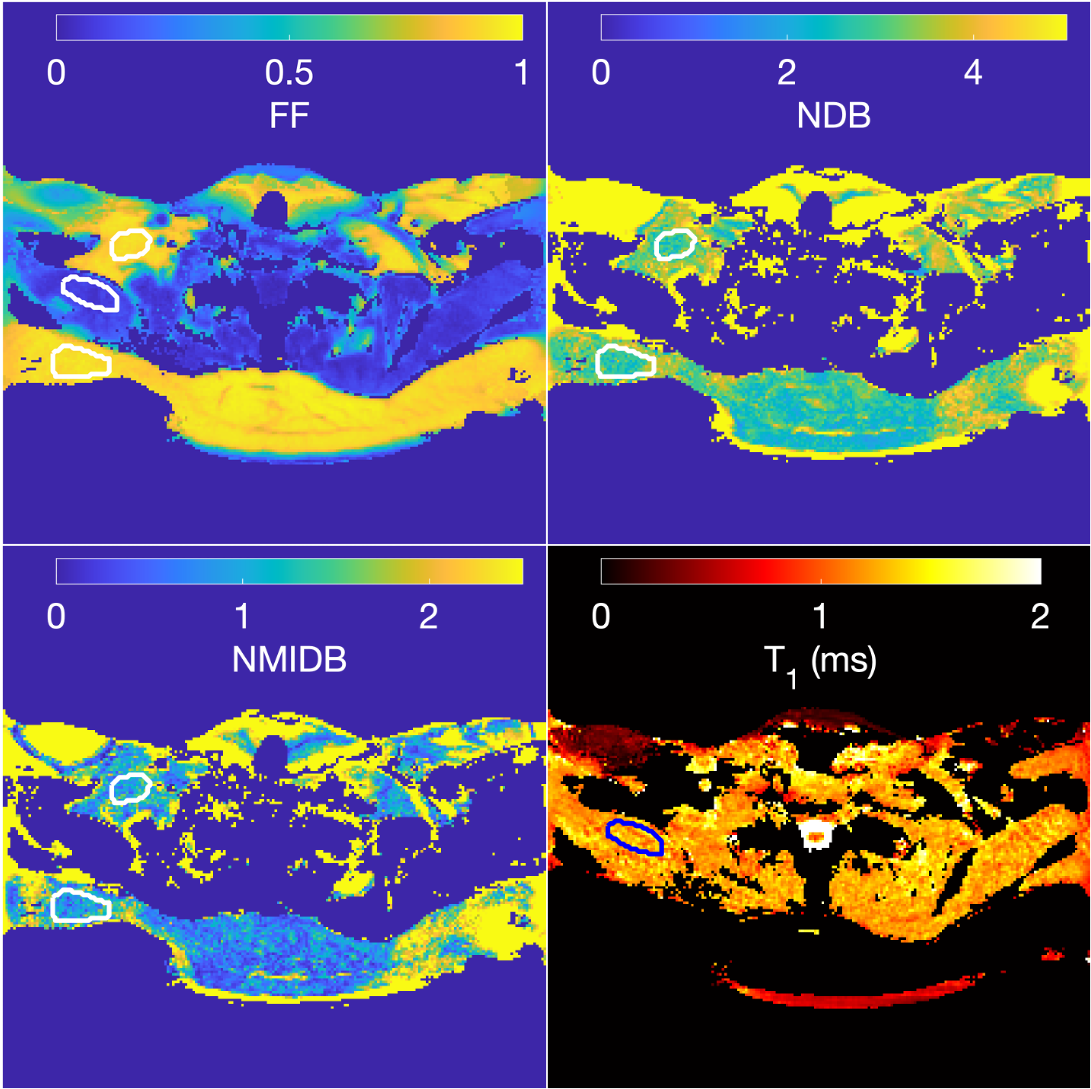
The ground-truth simulation and estimated parameters can be seen in Fig 2. The parameter maps from the vegetable oil phantom are in Fig. 3 and the MRI-MRS correlations in Fig. 4. The phantom estimated T1s (and SDs) from the MRS/proposed method were: 884/966 ms (35 ms) and 931/950 ms (48 ms) for 30% FF and water tubes, respectively. The BAT parameter maps are in Fig. 5. The estimated mean NDB (SDs) for BAT/subcutaneous adipose tissue (SAT) were 2.92 (0.41)/2.91 (0.44) and NMIDB were 1.08 (0.37)/1.00 (0.35). The estimated muscle T1 was 1284 ms (155 ms).Discussion
The estimated NDB/NMIDB and T1s from the simulated TG phantom closely agree with the ground-truth parameter maps. In the TG oil phantom, the proposed method’s NDB and NMIDB strongly correlate with those from MRS, and the T1 estimates from the MRF approach are similar to those from MRS. The NDB/NMIDB from the BAT and SAT, and muscle T1 estimates are consistent with those reported in the literature7,24. Further work is needed to determine parameter estimation bias and precision, especially in partial volumes of fat.Conclusion
The proposed method shows potential for single breath-hold, simultaneous multi-parametric triglyceride and tissue water characterization in the challenging BAT anatomy.Acknowledgements
NIH R01DK124845References
1. Bydder M, Girard O, Hamilton G. Mapping the double bonds in triglycerides. Magnetic Resonance Imaging. 2011;29(8):1041–1046.
2. Berglund J, Ahlström H, Kullberg J. Model-based mapping of fat unsaturation and chain length by chemical shift imaging--phantom validation and in vivo feasibility. Magnetic Resonance in Medicine. 2012; 68(6):1815–27.
3. Peterson P, Månsson S. Simultaneous quantification of fat content and fatty acid composition using MR imaging. Magnetic Resonance in Medicine. 2013;69(3):688–697.
4. Leporq B, Lambert SA, Ronot M, Vilgrain V, Van Beers BE. Quantification of the triglyceride fatty acid composition with 3.0 T MRI. NMR in Biomedicine. 2014;27(10):1211–1221.
5. Schneider M, Janas G, Lugauer F, Hoppe E, Nickel D, Dale BM, Kiefer B, Maier A, Bashir MR. Accurate fatty acid composition estimation of adipose tissue in the abdomen based on bipolar multi-echo MRI. Magnetic Resonance in Medicine. 2019;81(4):2330–2346.
6. Trinh L, Peterson P, Leander P, Brorson H, Månsson S. In vivo comparison of MRI‐based and MRS‐based quantification of adipose tissue fatty acid composition against gas chromatography. Magnetic Resonance in Medicine. 2020;(March):1–11.
7. Peterson P, Trinh L, Månsson S. Quantitative 1H MRI and MRS of fatty acid composition. Magnetic Resonance in Medicine. 2021;85(1):49–67.
8. Cencini M, Biagi L, Kaggie JD, Schulte RF, Tosetti M, Buonincontri G. Magnetic resonance fingerprinting with dictionary-based fat and water separation (DBFW MRF): A multi-component approach. Magnetic Resonance in Medicine. 2019;81(5):3032–3045.
9. Ostenson J, Damon BM, Welch EB. MR fingerprinting with simultaneous T1, T2, and fat signal fraction estimation with integrated B0 correction reduces bias in water T1 and T2 estimates. Magnetic Resonance Imaging. 2019;60:7–19.
10. Nolte T, Gross-Weege N, Doneva M, Koken P, Elevelt A, Truhn D, Kuhl C, Schulz V. Spiral blurring correction with water–fat separation for magnetic resonance fingerprinting in the breast. Magnetic Resonance in Medicine. 2019;(April):1–16.
11. Koolstra K, Webb AG, Veeger TTJ, Kan HE, Koken P, Börnert P. Water–fat separation in spiral magnetic resonance fingerprinting for high temporal resolution tissue relaxation time quantification in muscle. Magnetic Resonance in Medicine. 2020;84(2):646–662.
12. Jaubert O, Cruz G, Bustin A, Schneider T, Lavin B, Koken P, Hajhosseiny R, Doneva M, Rueckert D, Botnar RM, et al. Water–fat Dixon cardiac magnetic resonance fingerprinting. Magnetic Resonance in Medicine. 2020;83(6):2107–2123.
13. Leporq B, Ratiney H, Pilleul F, Beuf O. Liver fat volume fraction quantification with fat and water T1 and T2*estimation and accounting for NMR multiple components in patients with chronic liver disease at 1.5 and 3.0 T. European Radiology. 2013;23(8):2175–2186.
14. Deng J, Neff LM, Rubert NC, Zhang B, Shore RM, Samet JD, Nelson PC, Landsberg L. MRI characterization of brown adipose tissue under thermal challenges in normal weight, overweight, and obese young men. Journal of Magnetic Resonance Imaging. 2018;47(4):936–947.
15. Ouwerkerk R, Hamimi A, Matta J, Abd-Elmoniem KZ, Eary JF, Sater ZA, Chen KY, Cypess AM, Gharib AM. Proton MR spectroscopy measurements of white and brown adipose tissue in healthy humans: Relaxation parameters and unsaturated fatty acids. Radiology. 2021;299(2):396–406.
16. Zhao B, Setsompop K, Adalsteinsson E, Gagoski B, Ye H, Ma D, Jiang Y, Ellen Grant P, Griswold MA, Wald LL. Improved magnetic resonance fingerprinting reconstruction with low-rank and subspace modeling. Magnetic Resonance in Medicine. 2018;79(2):933–942.
17. Jaubert O, Arrieta C, Cruz G, Bustin A, Schneider T, Georgiopoulos G, Masci PG, Sing-Long C, Botnar RM, Prieto C. Multi-parametric liver tissue characterization using MR fingerprinting: Simultaneous T1, T2, T2*, and fat fraction mapping. Magnetic Resonance in Medicine. 2020;84(5):2625–2635.
18. Weigel M. Extended phase graphs: Dephasing, RF pulses, and echoes - Pure and simple. Journal of Magnetic Resonance Imaging. 2015;41(2):266–295.
19. Hamilton G, Yokoo T, Bydder M, Cruite I, Schroeder ME, Sirlin CB, Middleton MS. In vivo characterization of the liver fat 1H MR spectrum. NMR in Biomedicine. 2011;24(7):784–790.
20. Lu W, Yu H, Shimakawa A, Alley M, Reeder SB, Hargreaves BA. Water-fat separation with bipolar multiecho sequences. Magnetic Resonance in Medicine. 2008;60(1):198–209.
21. Walsh DO, Gmitro a F, Marcellin MW. Adaptive reconstruction of phased array MR imagery. Magnetic Resonance in Medicine. 2000;43(5):682–90.
22. Stefan D, Cesare F Di, Andrasescu A, Popa E, Lazariev A, Vescovo E, Strbak O, Williams S, Starcuk Z, Cabanas M, et al. Quantitation of magnetic resonance spectroscopy signals: the jMRUI software package. Measurement Science and Technology. 2009;20(10):104035.
23. Vanhamme L, Van Den Boogaart A, Van Huffel S. Improved Method for Accurate and Efficient Quantification of MRS Data with Use of Prior Knowledge. Journal of Magnetic Resonance. 1997;129(1):35–43.
24. Bojorquez JZ, Bricq S, Acquitter C, Brunotte F, Walker PM, Lalande A. What are normal relaxation times of tissues at 3 T? Magnetic Resonance Imaging. 2017;35:69–80.Figures