3492
Evaluation of MR Fingerprinting at 0.55T1Department Of Electrical and Computer Engineering, University of Southern California, Los Angeles, CA, United States, 2Department Of Biomedical Engineering, University of Southern California, Los Angeles, CA, United States, 3Division of Intramural Research, National Heart, Lung, and Blood Institute, National Institutes of Health, Bethesda, MD, United States, 4Department of Radiology, Case Western Reserve University, Cleveland, OH, United States
Synopsis
We perform a thorough comparison of MRF with reference relaxometry approaches on a NIST/ISMRM phantom and a healthy volunteer. In the NIST phantom, relative bias from -4.7% to 27.7% for the NiCl2 vials and from 5.01% to 28% for the MnCl2 vials within a biological relevant T1 and T2 range. In-vivo, MRF has good repeatability (variations <2%) but substantial bias in WM and GM against the reference approach.
Introduction
MR fingerprinting (MRF)1,2 is a powerful and time-efficient approach for high-resolution whole brain relaxometry. This method has been optimized and evaluated extensively at 1.5T and 3T. At lower field strengths, new opportunities are available due to scaling of relaxation parameters (shorter T1, longer T2 and T2*), scaling of signal-to-noise ratio (SNR), relaxed specific absorption rate (SAR) constraints, and improved B0 and B1+ field homogeneity.The feasibility of MRF at 0.55T was recently demonstrated by Campbell-Washburn et al.3 and reported high quality T1 and T2 maps, with only slightly compromised spatial resolution. In this study, we performed a thorough comparison of MRF with standard approaches with a NIST/ISMRM phantom and a healthy volunteer. We included gold standard approaches such as inversion-recovery spin-echo (IRSE) and single-echo spin-echo (SESE).
Methods
Experiments were performed using a whole body 0.55T system (prototype MAGNETOM Aera, Siemens Healthineers, Erlangen, Germany) equipped with high-performance shielded gradients (45 mT amplitude, 200 T/m/s slew rate). FISP-based 3D MRF3,4 was compared against standard T1 and T2 mapping approaches as summarized in Table 1. The MRF sequence was provided by Case Western Reserve University under a C2P agreement.Comparisons were performed in the NIST/ISMRM phantom5 and in one healthy volunteer (M/28). 3D MRF was performed at three time points (~1.5 hours apart) to demonstrate the test-retest repeatability. MRF only was performed on another 3 healthy volunteers (1F/2M, age 25-33) to demonstrate the inter-subject variability. For phantom scans, region-of-interest (ROI)-based T1 and T2 correlations between MRF and standard approaches were calculated. The relative errors of MRF were calculated for vials with T1 or T2 within a biologically relevant range. For human validation scans, IRSE T1, SESE T2 and MRF T1 and T2 maps are reported and relative differences in mean T1 and T2 between 3 repetitions are calculated, focusing on white matter (WM) and grey matter (GM). For other volunteer scans, ROI-based MRF T1 and T2 values were reported in histograms.
Results
Figure 1 shows the linear regression results of MRF (left) T1 and (right) T2 between standard approaches of the optimal constant B1+ scaling factor (0.92). For a biological relevant ranges of T1 (100-1000 ms) and T2 (40-200 ms), the relative errors of MRF T1 and T2 range from -4.7% to 27.7% and from 5.01% to 28%, respectively.Figure 2 shows the comparison between human MRF with 3 repetitions and standard approaches. MRF underestimated T2 in both WM and GM up to -50%. On the other hand, MRF has good repeatability across 3 repetitions. The differences in mean T1 and T2 values between the repetitions are all within ±2%.
Figure 3 shows T1 and T2 histograms from 0.55T MRF in four healthy volunteers. All histograms have approximated Gaussian shape. Mean values matched3, but coefficients of variation were higher.
Figure 4 shows representative MRF T1 and T2 maps of one slice from each of the volunteers. The maps appear to be tissue-wise homogenous with clearly visible tissue boundaries and no obvious spatial artifacts were observed.
Discussion
In this work, we have evaluated brain MRF against standard (very slow) T1 and T2 mapping approaches. MRF showed good agreement with gold-standard measurements in the ISMRM/NIST phantom and biased measurements in the healthy volunteer, especially for T2. MRF measurements of WM and GM T1 and T2 showed excellent intra-subject repeatability and good agreement across healthy volunteers.There are several limitations in this study. First, we correct for global B1+ scaling by using phantom measurements (Figure 1). This may not be sufficient for spatially varying B1+ (expected to be minimal at 0.55T) or slab profile effects (can be significant when using low time-bandwidth RF excitations).
Second, reference T1 and T2 measurements might be biased due to insufficient TR (4000 ms). We had to choose such a TR to keep the overall scan time feasible for the most motivated volunteer (~3 hours total).
Third, we didn not perform temperature correction for MRF. As studied by Statton11 et al., this would improve accuracy and repeatability.
We suspect that the substantial underestimation of T2 in human (Figure 2) is due to magnetization transfer (MT) effects6–8. Hilbert et al.9 demonstrated that ignoring MT would lead to discrepancies between dictionary simulation and the acquired MRF signal. We hypothesize that MT effects due to on-resonance RF excitation are worse at lower field strengths due to a narrowed absorption spectrum of the macromolecule pool. Improving MRF at 0.55T either through pulse design10 or modeling during dictionary generation9, will be our future work.
Low field imaging generally has reduced SNR and amplified concomitant field effects. SNR can be compensated by more efficient sampling12 and spatial blurring due to concomitant fields can be mitigated with higher-order encoding corrections13–15. The full potential of MRF at 0.55T remains to be investigated.
Conclusion
We evaluated 3D FISP-based MRF of human brain at 0.55T. Relaxometry results were consistent with a recent publication3. This implementation shows biases in human experiments that are likely due to MT effects. Further investigation is needed to resolve these biases, and to explore the full potential of MRF at 0.55T.Acknowledgements
We acknowledge
grant support from the National Science Foundation (#1828736) and research
support from Siemens Healthnieers. We thank Sophia Cui, Yongwan Lim and Bilal Tasdelen for helpful discussions.
References
1. Ma D, Gulani V, Seiberlich N, et al. Magnetic resonance fingerprinting. Nature. 2013;495(7440):187-192. doi:10.1038/nature11971
2. Jiang Y, Ma D, Seiberlich N, Gulani V, Griswold MA. MR fingerprinting using fast imaging with steady state precession (FISP) with spiral readout. Magn Reson Med. 2015;74(6):1621-1631. doi:10.1002/mrm.25559
3. Campbell-Washburn AE, Jiang Y, Körzdörfer G, Nittka M, Griswold MA. Feasibility of MR fingerprinting using a high-performance 0.55 T MRI system. Magn Reson Imaging. June 2021. doi:10.1016/j.mri.2021.06.002
4. Ma D, Jiang Y, Chen Y, et al. Fast 3D Magnetic Resonance Fingerprinting for a Whole-Brain Coverage. 2017;00:1-8. doi:10.1002/mrm.26886
5. Stupic KF, Ainslie M, Boss MA, et al. A standard system phantom for magnetic resonance imaging. Magn Reson Med. 2021;86(3):1194-1211. doi:10.1002/mrm.28779
6. Wolff SD, Balaban RS. Magnetization transfer contrast (MTC) and tissue water proton relaxation in vivo. Magn Reson Med. 1989;10(1):135-144. doi:10.1002/MRM.1910100113
7. Henkelman RM, Stanisz GJ, Graham SJ. Magnetization transfer in MRI: a review. 2001. doi:10.1002/nbm.683
8. Gloor M, Scheffler K, Bieri O. Quantitative magnetization transfer imaging using balanced SSFP. Magn Reson Med. 2008;60(3):691-700. doi:10.1002/MRM.21705
9. Hilbert T, Xia D, Block KT, et al. Magnetization transfer in magnetic resonance fingerprinting. Magn Reson Med. 2020;84(1):128-141. doi:10.1002/MRM.28096
10. A.G. Teixeira RP, Malik SJ, Hajnal J V. Fast quantitative MRI using controlled saturation magnetization transfer. Magn Reson Med. 2019;81(2):907-920. doi:10.1002/mrm.27442
11. Statton BK, Koerzdoerfer G, Smith J, Finnegan ME, Quest RA, Grech-Sollars M. Temperature dependence, accuracy, and repeatability of T1 and T2 relaxation times for the ISMRM / NIST system phantom measured using MR fingerprinting. 2021;(May):1-15. doi:10.1002/MRM.29065
12. Restivo MC, Ramasawmy R, Bandettini WP, Herzka DA, Campbell-Washburn AE. Efficient spiral in‐out and EPI balanced steady‐state free precession cine imaging using a high‐performance 0.55T MRI. Magn Reson Med. 2020;84(5):2364. doi:10.1002/MRM.28278
13. Vannesjo SJ, Haeberlin M, Kasper L, et al. Gradient system characterization by impulse response measurements with a dynamic field camera. Magn Reson Med. 2013;69(2):583-593. doi:10.1002/MRM.24263/FORMAT/PDF
14. Campbell-Washburn AE, Xue H, Lederman RJ, Faranesh AZ, Hansen MS. Real-time distortion correction of spiral and echo planar images using the gradient system impulse response function. Magn Reson Med. 2016;75(6):2278-2285. doi:10.1002/MRM.25788/FORMAT/PDF
15. Lee NG, Ramasawmy R, Campbell-washburn AE, Nayak KS. MaxGIRF: Image Reconstruction incorporating Maxwell Fields and Gradient Impulse Response Function Distortion. In: Proc. 2021 ISMRM & SMRT Virtual Conference and Exhibition. ; 2021.
16. Drain LE. A Direct Method of Measuring Nuclear Spin-Lattice Relaxation Times. Proc Phys Soc Sect A. 1949;62(5):301. doi:10.1088/0370-1298/62/5/306
17. Hahn EL. An accurate nuclear magnetic resonance method for measuring spin-lattice relaxation times. Phys Rev. 1949;76(1):145-146. doi:10.1103/PHYSREV.76.145
18. Hahn EL. Spin Echoes. Phys Rev. 1950;80(4):580. doi:10.1103/PhysRev.80.580
19. Andr Jung B, Weigel M. Review: MR Physics for Clinicians Spin Echo Magnetic Resonance Imaging. 2013. doi:10.1002/jmri.24068
Figures
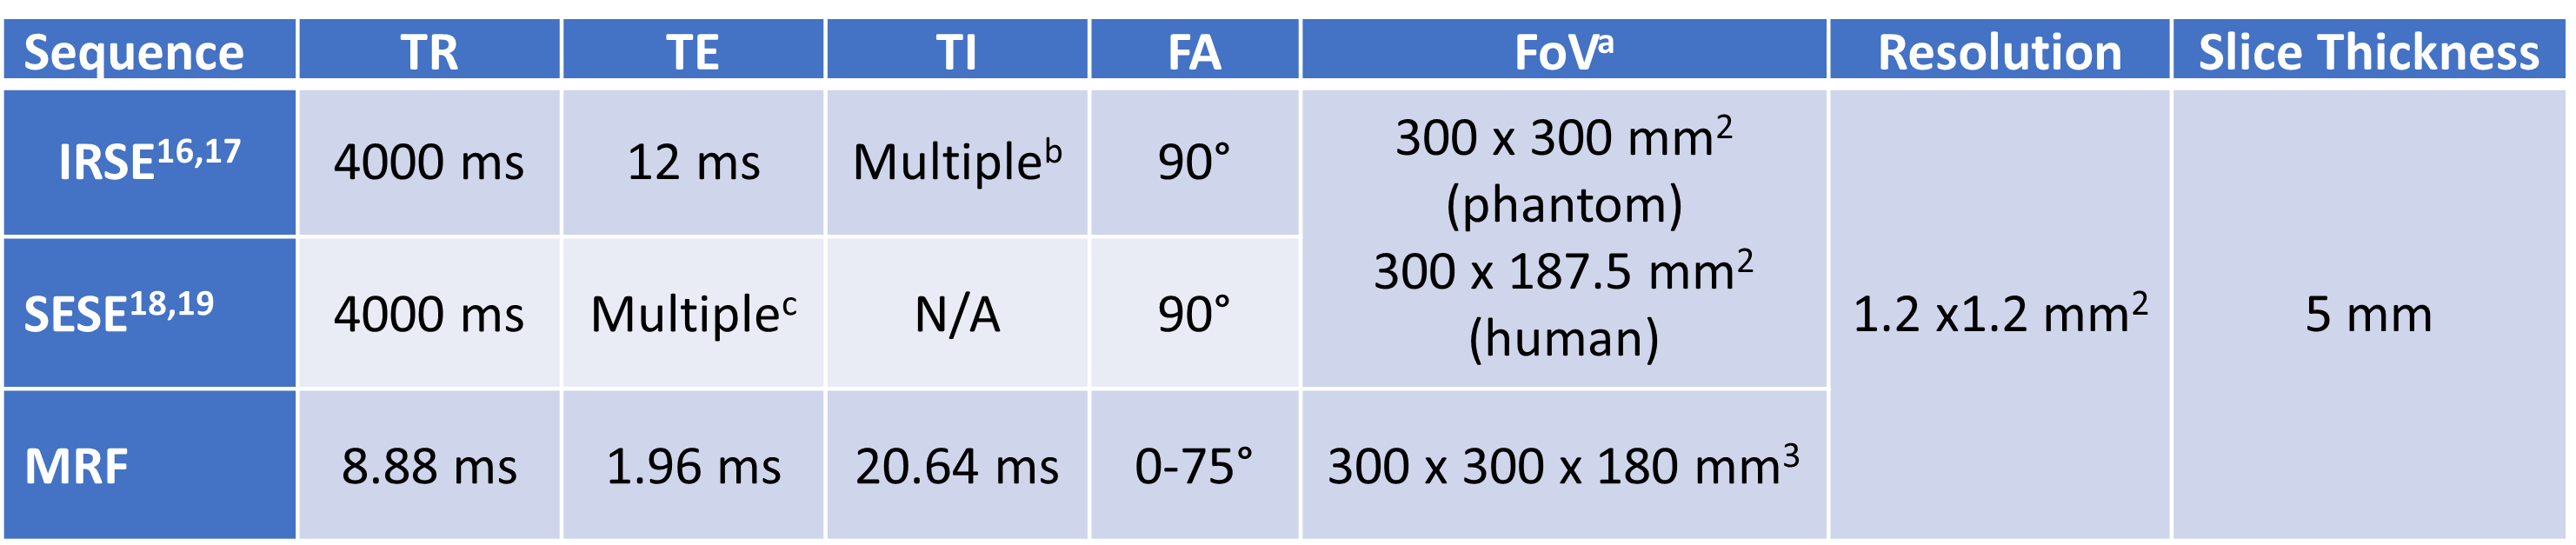
Table 1. Detailed parameters of the sequences. a. FoV was reduced to 300 mm x187.5 mm for human scan to reduce scan time. b. TI’s = [50, 100, 200, 400, 600, 800, 1000, 1600] ms. c. TE’s = [25, 50, 75, 100, 125, 150, 200] ms.
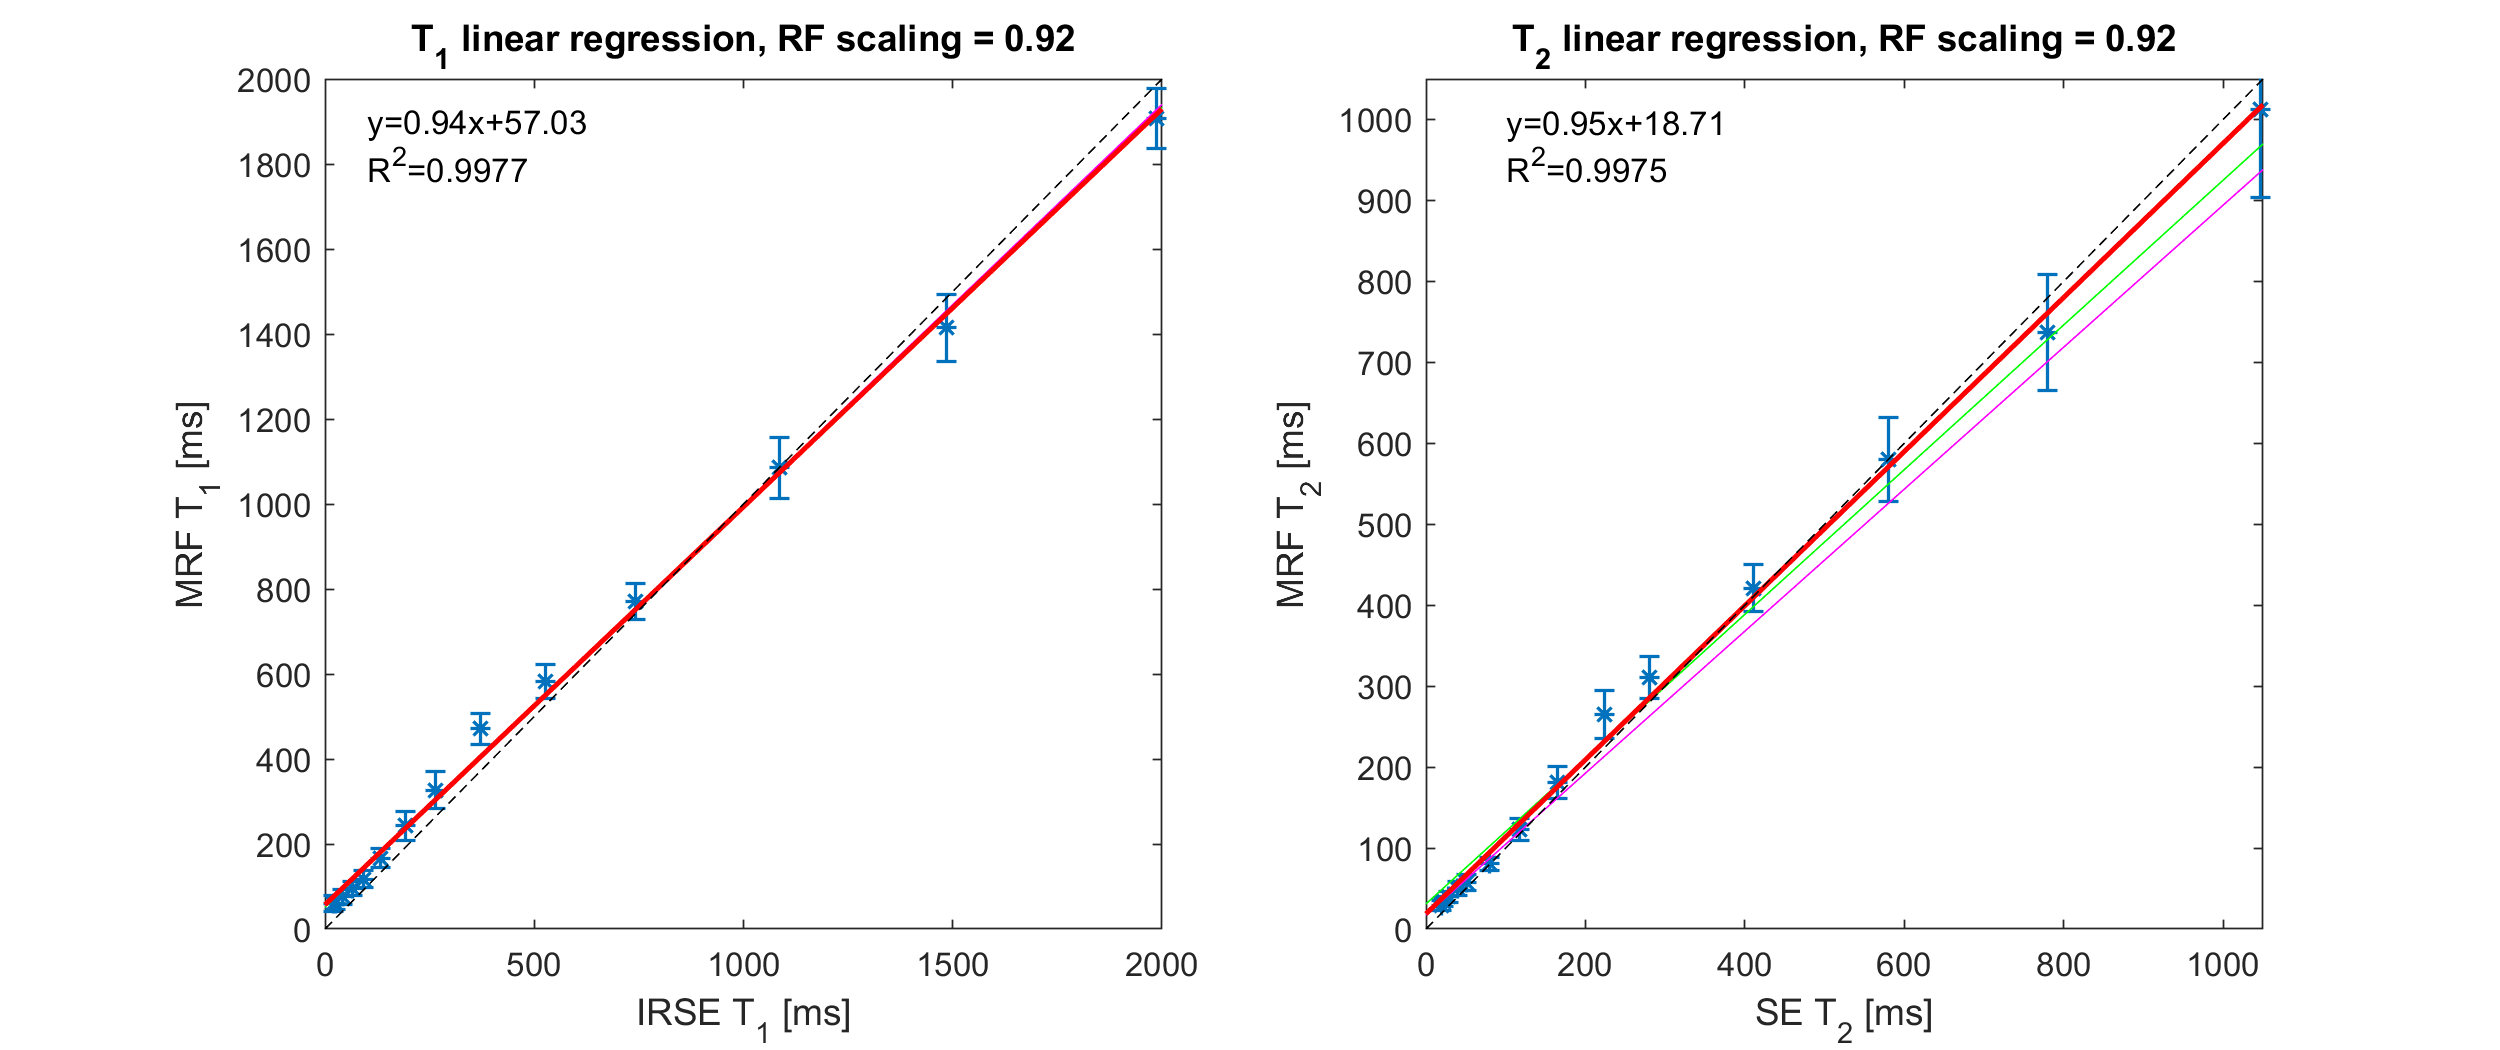
Figure 1. Selection of B1+ scale factor. Plot show linear regression of MRF T1 and T2 in the ISMRM/NIST phantom, to select an optimal B1+ scale factor (0.92). The thin magenta, thick red, and thin green lines correspond to the fitted model for constant B1+ scale factors of [0.88, 0.92, 0.96], respectively. The dashed black line is identity. Note that the green and magenta lines are not visible on the T1 linear regression plot, because MRF T1 is insensitive to the B1+ scale. The scale factor (0.92) was chosen based on the largest R2 and the slope closest to 1.
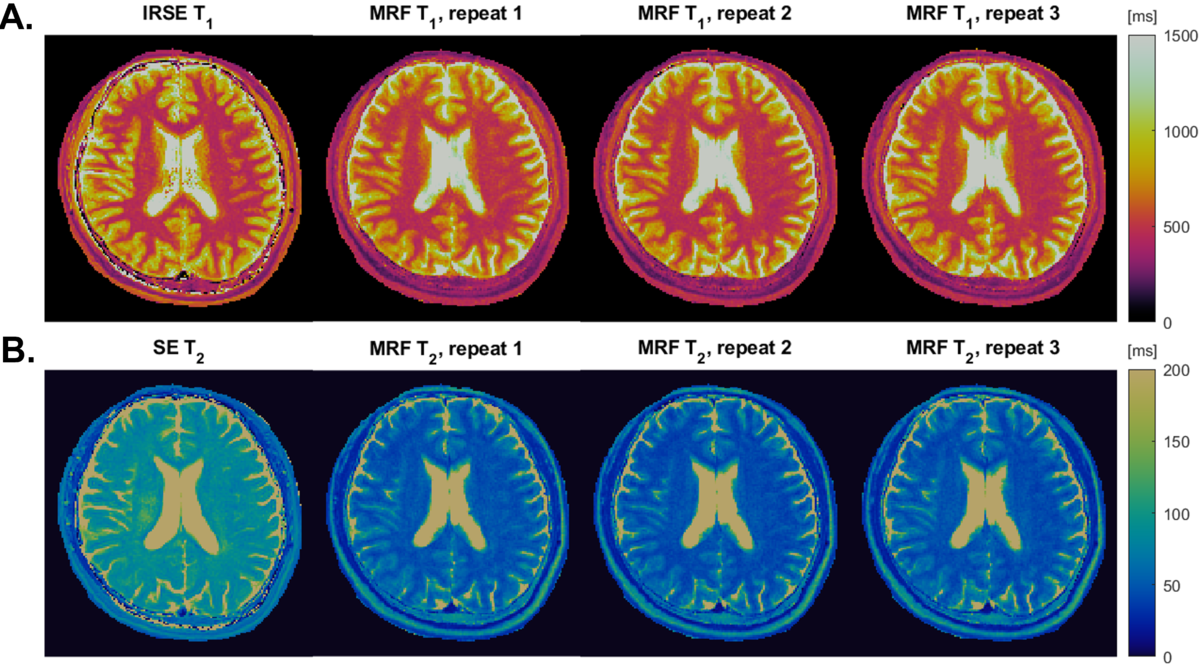
Figure 2. Human Validation and Test-Retest Repeatability. In-vivo T1 and T2 maps from a reference approach and MRF with 3 repetitions (~1.5 hours apart). (A) IRSE T1 and MRF T1 maps. (B) SE T2 and MRF T2 maps. MRF T1 values in WM and GM are within 15% of the reference values. MRF T2 values are roughly 50% lower than the reference values. We suspect this discrepancy is largely due to MT effects due to on-resonance excitation, that were not modeled in the MRF dictionary generation. Note, there is also a small 2.5mm S-I discrepancy in slice location causing the features to be slightly different.
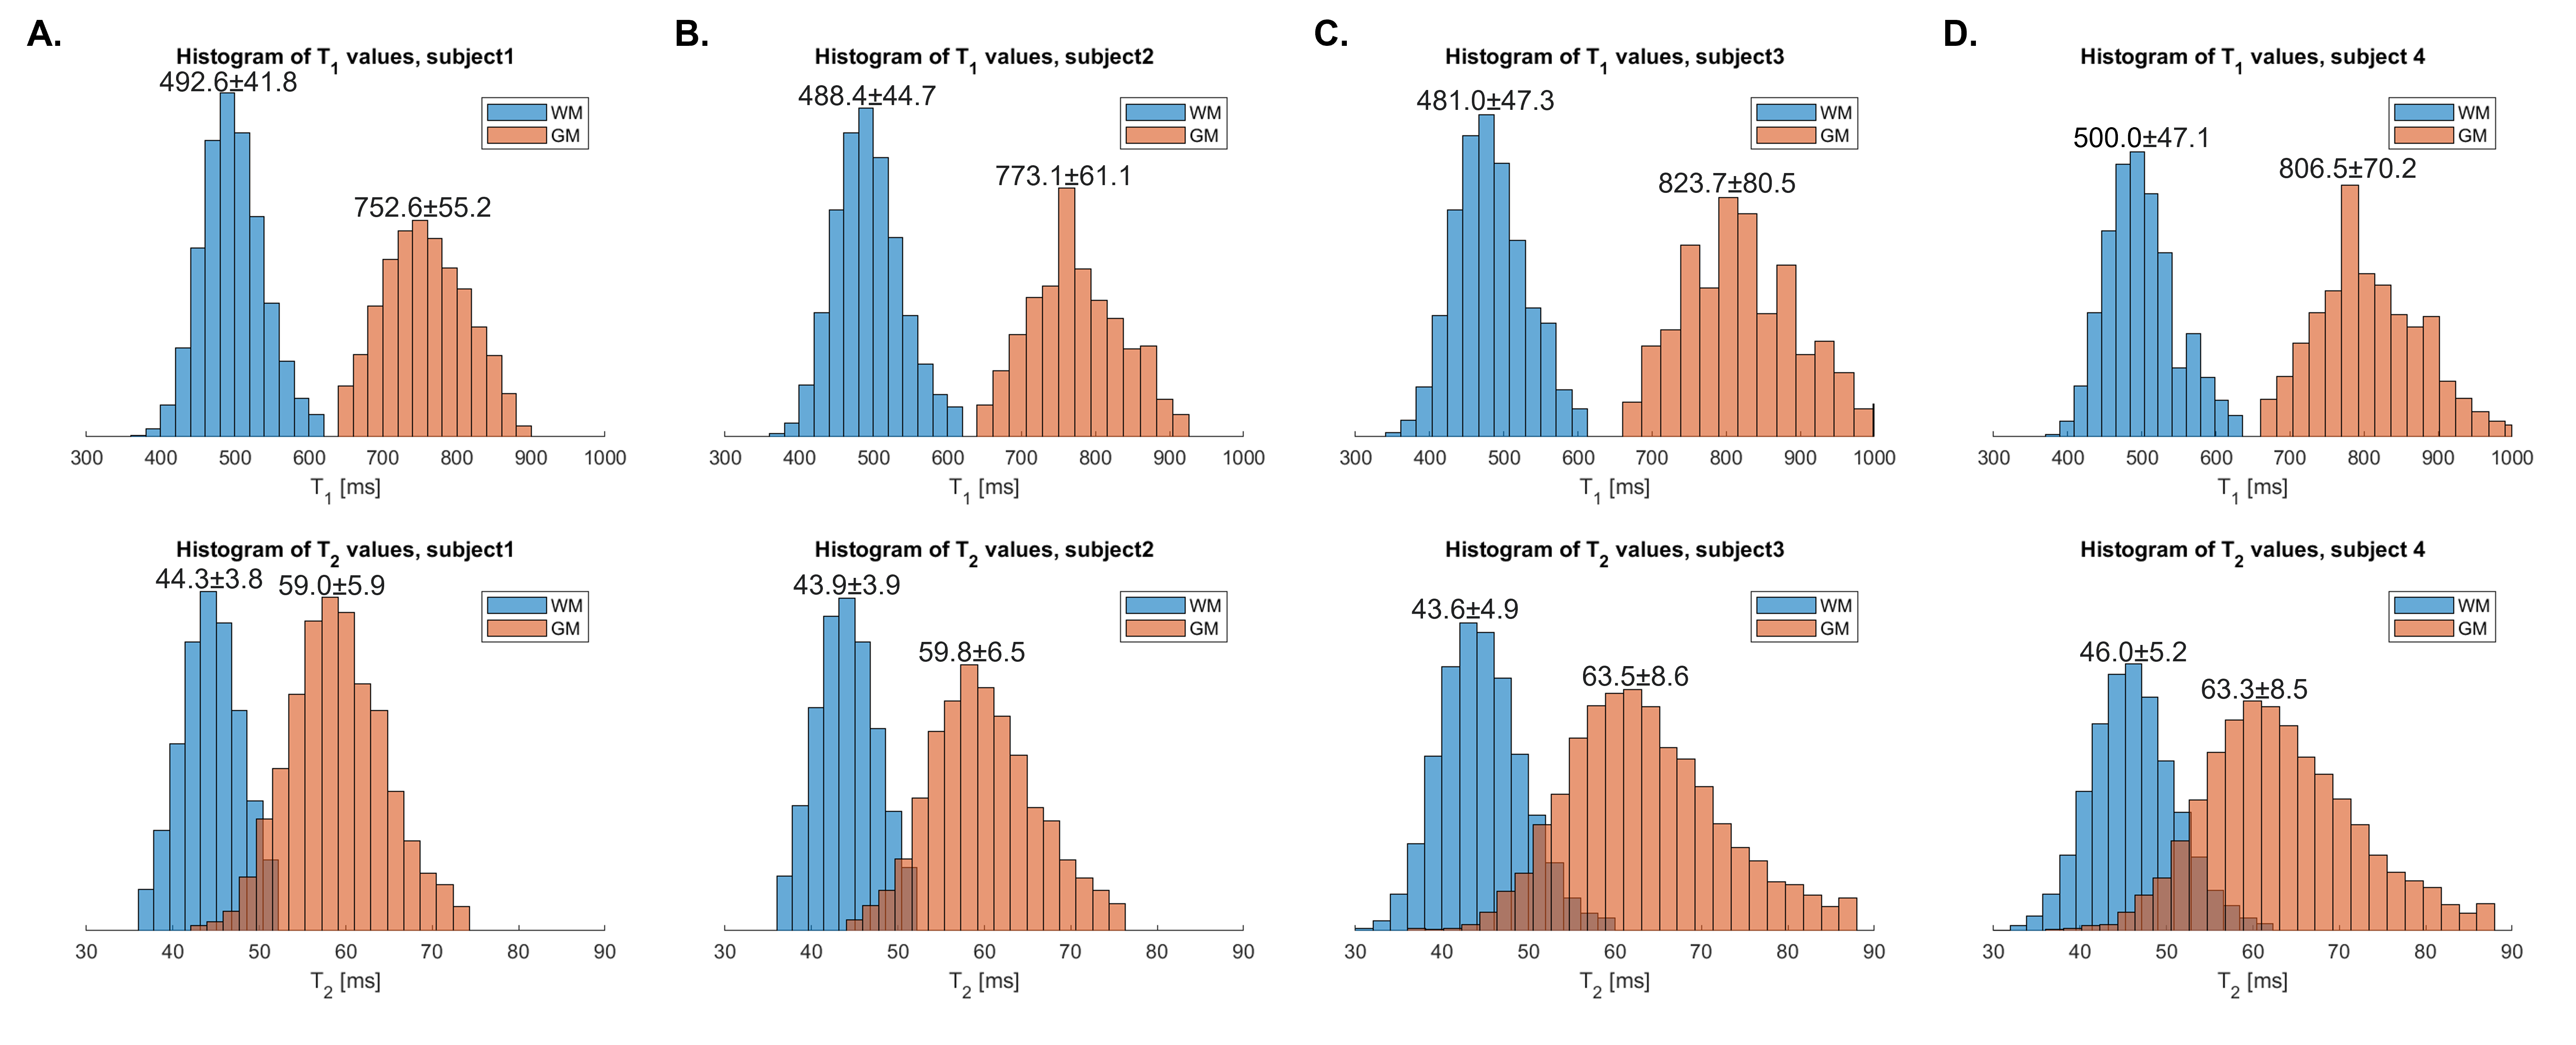
Figure 3. Inter-Subject Variability of WM and GM T1 and T2 maps. T1 and T2 histograms from 0.55T MRF in the four healthy volunteers (panel A-D). All histograms have approximated Gaussian shape. The mean±SD values are shown above each histogram. Each volunteer’s WM and GM T1 has a coefficient of variation <10% and T2 has a coefficient of variation ~10%. Mean values matched Ref (3), but coefficients of variation were higher.
Figure 4. Volumetric T1 and T2 maps from MRF, from four subjects (animated GIF). Shown are axial slices from the (1st row) T1 and (2nd row) T2 maps from each of the volunteers (column 1-4). The maps are relatively homogenous within each tissue (e.g., WM, GM), and have clearly tissue boundaries. No obvious spatial artifacts were observed. Image are windowed to showcase WM and GM (not CSF).