3486
Locally low-rank denoising of multi-echo fMRI data preserves detection of resting-state networks following scan truncation1Mayo Clinic Graduate School of Biomedical Sciences, Rochester, MN, United States, 2Department of Radiology, Mayo Clinic, Rochester, MN, United States
Synopsis
Functional magnetic resonance imaging (fMRI) has inherent limitations of fast acquisitions due to low signal-to-noise ratio (SNR) and artifacts. Multi-echo fMRI acquires images at multiple TEs, increasing robustness to off-resonance based signal loss and improving sensitivity to neural activity. However, noise is substantial given limitations of EPI, although consistent across TEs contributing to prolonged scan times required for sufficient statistical power. Reduction of acquisition time with reconstruction and processing techniques is of interest. This study extends preliminary work on locally low-rank denoising of multi-echo fMRI data to explore scan time reduction through processing with retrospective truncation.
Introduction
Image data in blood oxygenation level dependent (BOLD)1 functional magnetic resonance imaging (fMRI) inherit limitations of fast acquisitions, namely low signal to noise ratio (SNR) and artifacts, especially distortion and signal dropout in regions of magnetic susceptibility.2 Multi-echo fMRI acquires images at multiple TEs following each excitation.3,4 Short-TE data provide signal strength while long-TE data facilitate BOLD contrast.5,6 This imparts some robustness to off-resonance based signal loss through echo combination strategies, and improved sensitivity to neural activity. However, noise is substantial given limitations of EPI, although it is stable through TEs. Methods to reduce scan time are of particular interest in reconstruction and processing for fMRI.7,8,9,10 This study extends our preliminary work on locally low-rank denoising of multi-echo fMRI data11 to explore scan time reduction through retrospective truncation and processing.Methods
ME-LLR Denoising: A time series of multi-echo MRI data is modeled as a 3-way tensor $$$G=X+Z$$$ of dimensionality $$$N\times T\times E$$$ with $$$N$$$ spatial indices, $$$T$$$ timeframes, and $$$E$$$ echoes; where $$$G$$$ is the unknown image data of interest $$$X$$$ contaminated with zero-mean noise $$$Z$$$. In ME-LLR, low-rank of local spatiotemporal regions12 vectorized in echoes is promoted through a specific matricization:$$\hat{X}
=
C_{(2)}^{-1}
\bigg\{
Q^{-1}
\sum_b
(I \otimes R_b)^* SVT_{\lambda/2}
\big\{
(I \otimes R_b)C_{(2)}\{G\}
\big\}
\bigg\}
$$
where $$$C_{(n)}\{U\}$$$ is the $$$n$$$th matricization of a tensor $$$U$$$ and $$$C_{(2)}\{G\}$$$ the $$$NE\times T$$$ matricization of $$$G$$$; $$$R_b$$$ is a binary operator extracting subsets of rows of $$$C_{(2)}\{G\}$$$ corresponding to local spatial subregions, $$$\otimes$$$ is the Kronecker product facilitating extraction through echoes, $$$SVT$$$ is singular value thresholding,13,14 $$$\lambda$$$ is a regularization parameter, and $$$Q=\sum_b (I \otimes R_b^* R_b)$$$ for identity matrix $$$I$$$.
ME-LLR was implemented in Matlab (The MathWorks Inc., Natick, MA, USA) and applied to DICOM image data. ME-LLR was applied to retrospectively truncated exam data, scaling the singular value threshold by $$$\sqrt{T}$$$ to balance fidelity and regularization. $$$\lambda$$$ was set such that at full duration, $$$(\lambda/2)\sqrt{T}=1000$$$.
Data Acquisition: Under an IRB-approved protocol and with written informed consent, resting-state fMRI data were acquired in seven healthy volunteers on a compact 3T (C3T) scanner.15-17 The C3T's high-performance gradient system enabled relatively high spatial resolution (1.4×1.4×2.8 mm3) multi-band multi-echo fMRI with whole-brain coverage at TR = 1.810 s with image data matrix Nx×Ny×Nz×Nt=160×160×51×234, with 7:04 scan duration, 22.4 cm FOV, 74$$$^{\circ}$$$ flip angle, multi-band (MB=3) and in-plane (R=3) acceleration.17 Echo times were 12.10, 34.24, 56.57 ms. A sagittal MPRAGE was also acquired. Physiologic data were collected during scans.
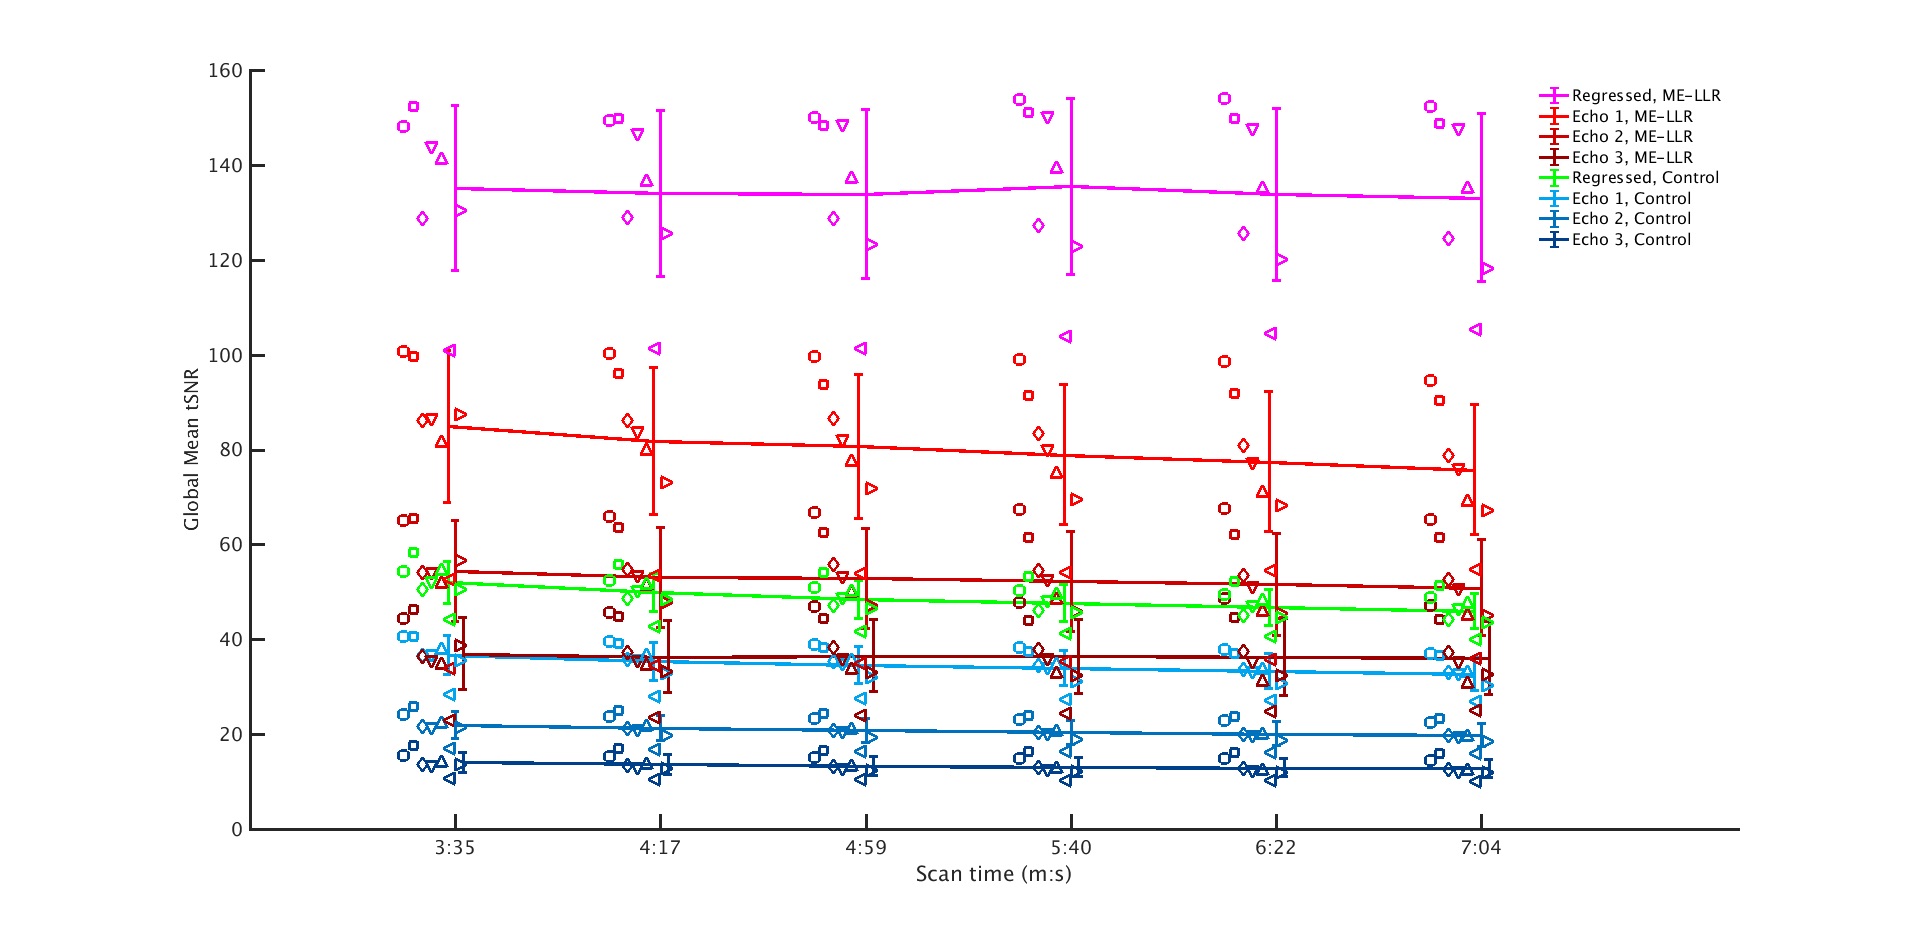
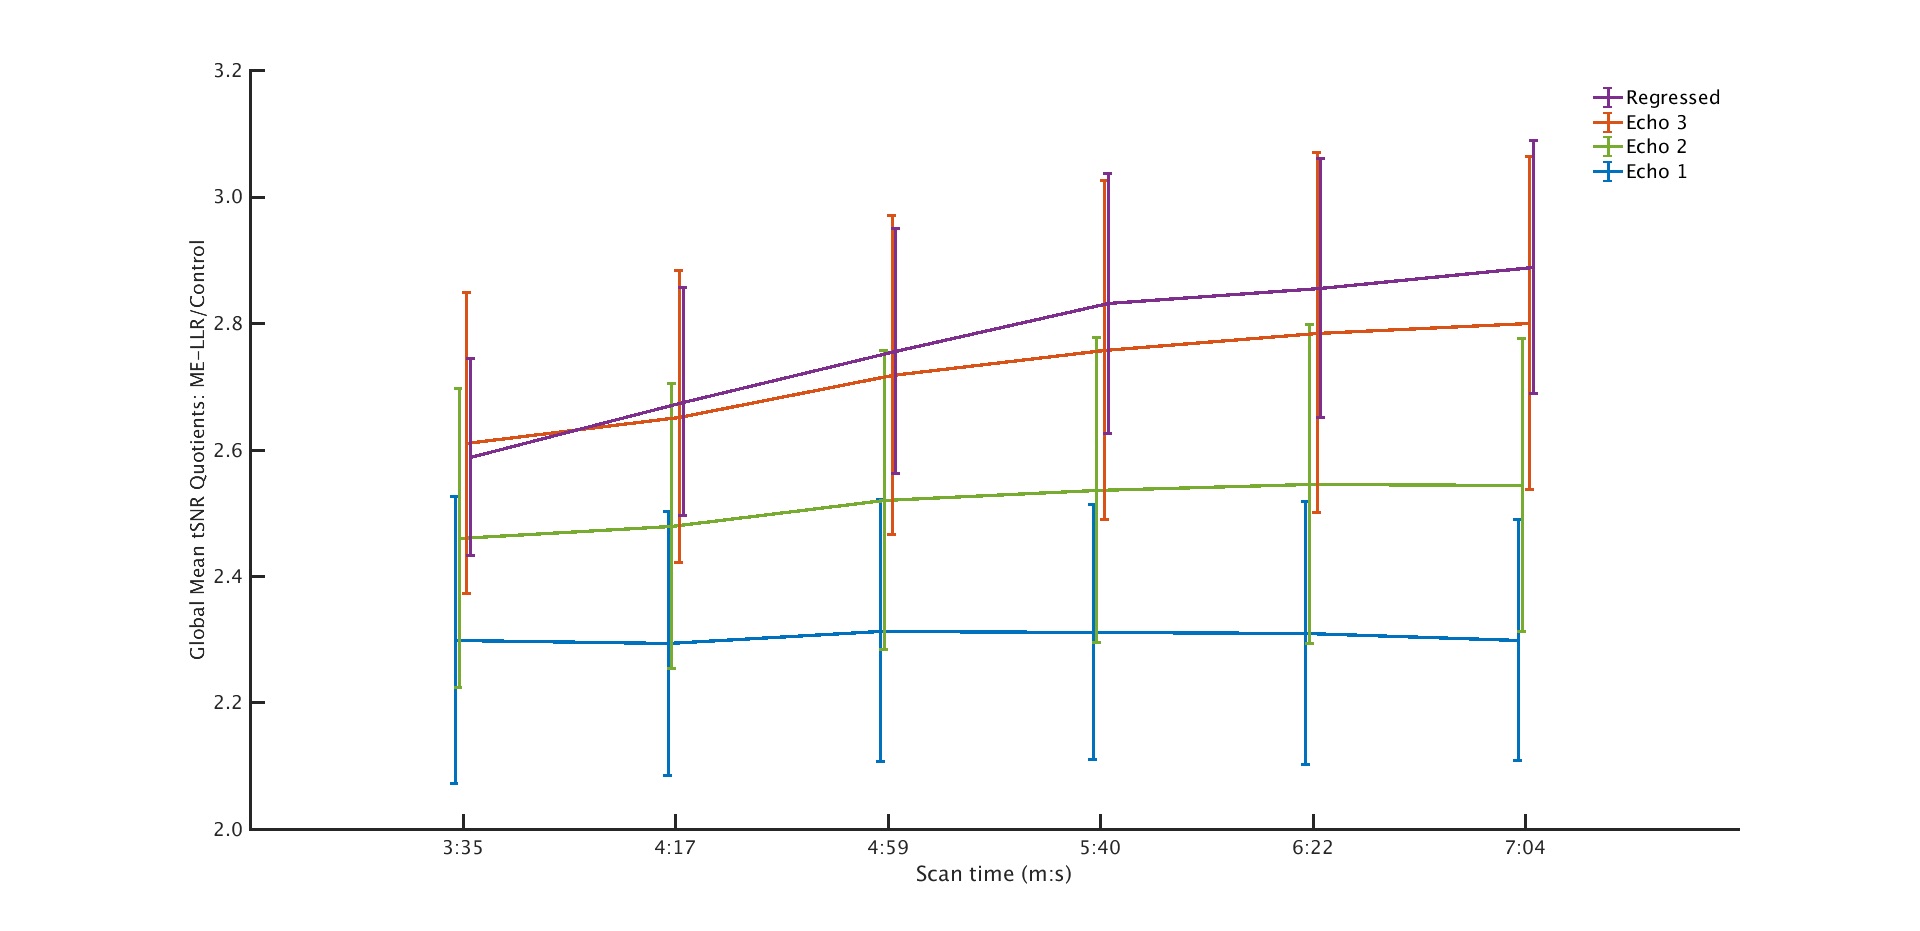
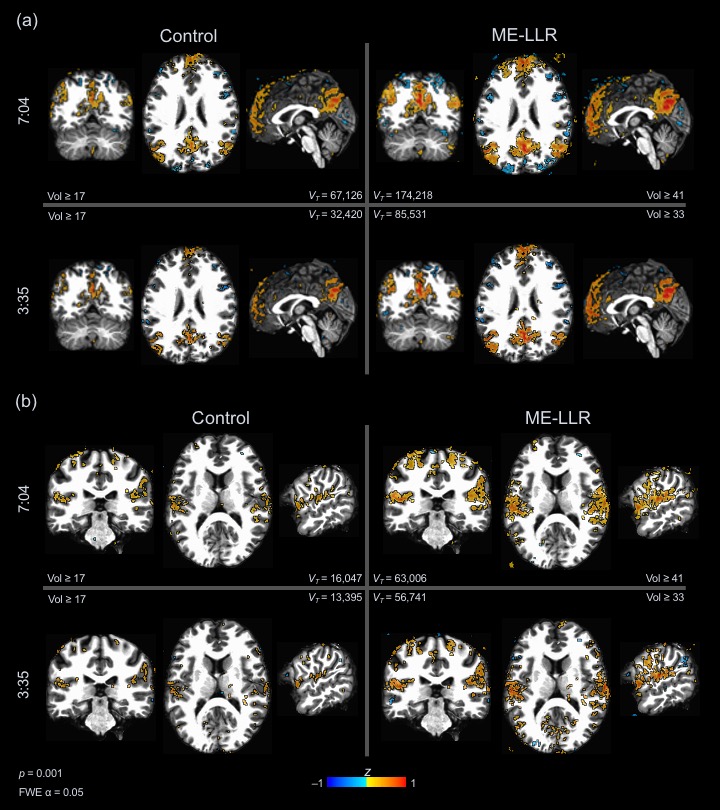
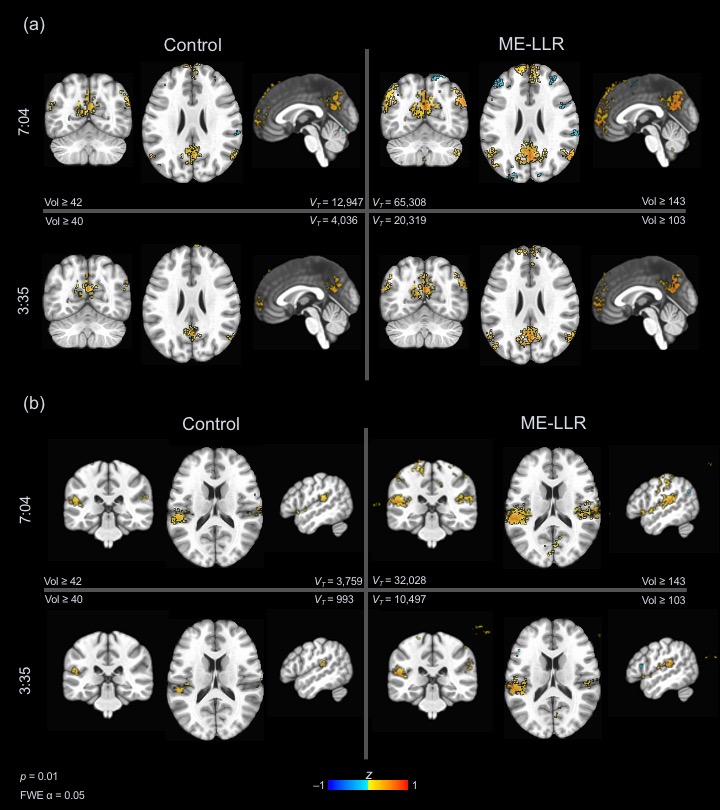
Functional Processing: Vendor-generated DICOM (“control”) image data and ME-LLR denoised data were processed in parallel with equivalent pipelines at varying durations, retrospectively truncating from full to half duration in increments of 23 TRs before ME-LLR denoising or functional processing. Processing was completed using Analysis of Functional Neuroimages (AFNI).18 Data were corrected for physiologic interference with RETROICOR19 and adjusted for slice timing, aligned to anatomic data processed with FreeSurfer,20 spatially normalized to the MNI152_T1_2009c template, motion-corrected and volume-registered preceding T2*-weighted echo combination;21,22 then scaled, and regressed with demeaned and derivative motion parameters and ANATICOR.23 4 initial TRs were discarded.24 Seed-based connectivity analysis was completed using spherical ROIs of 5 mm radius (515 voxels), set in the posterior cingulate cortex (MNI coordinates [x,y,z] = [3 (R), -63 (P), 23 (S)] mm) and transverse temporal gyrus ([x,y,z] = [-53, -33, 17] mm) to respectively target default mode and auditory networks. These masks were applied to single-subject data yielding averaged time series seeds for each subject and processing variant, used to compute Fisher z-transformed Pearson correlation coefficient maps. Group analysis was completed with one-sample, two-sided t-tests against zero mean. Group-level t-statistic maps were compared between variants at full and half durations. For all durations, whole-brain mean temporal SNR (tSNR) was recorded following registration for first, second, and third-echo data using '3dTstat -cvarinv' and masking with AFNI; and for regressed data as the masked quotient of mean preprocessed time series and residual time series standard deviation.
Results
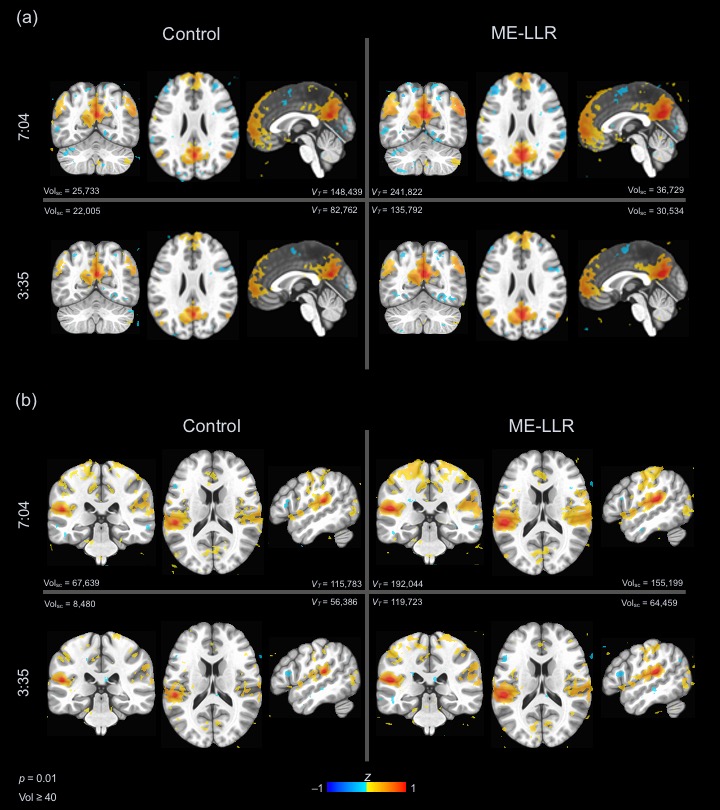
At all durations and for all data variants, ME-LLR introduced substantial increases in tSNR as demonstrated in Figure 1. Figure 2 shows corresponding quotients of ME-LLR to control. ME-LLR introduces approximate 130%, 150%, and 170% increases respectively for first, second, and third-echo data at full duration and approximately 180% for regressed data. These enhancements are stable for data truncated to half duration. In seed-based connectivity analyses, ME-LLR facilitates inference of resting-state networks at subject and group levels at half duration comparable to full-duration control. Figure 3 shows and quantifies network maps computed for a single subject at full and half-durations. Figure 4 demonstrates group-level maps at full and half durations. Figure 5 demonstrates a similar analysis but with spatial smoothing applied.Discussion & Conclusion
ME-LLR is a potential mechanism for reduction of scan time as demonstrated in a retrospective seed-based analysis of multi-echo fMRI data. Network maps derived from seed-based analyses were comparable between half-duration ME-LLR and full-duration control. Enhancements in tSNR were substantial and stable through varying durations. These results suggest a possibility of reduced scan time with acceptable results in mapping resting-state connectivity with multi-echo fMRI. This study was completed with resting-state data; similar benefits are expected for task-based applications.Acknowledgements
This work is supported by National Institutes of Health (NIH) U01 EB024450, NIH U01 EB026979, Mayo Clinic Graduate School of Biomedical Sciences, and the National Science Foundation (NSF) Graduate Research Fellowship Program (GRFP).References
1. Ogawa S, Lee TM, Kay AR, Tank DW. Proc Natl Acad Sci USA. 1990;87(24):9868–72.
2. Cordes D, Turski PA, Sorenson JA. Magn Reson Imaging. 2000;18(9):1055–68.
3. Speck O, Hennig J. Magn Reson Med. 1998;40(2):243–8.
4. Poser BA, Versluis MJ, Hoogduin JM, et al. Magn Reson Med. 2006;55(6):1227–35.
5. Peltier SJ, Noll DC. Neuroimage 2002;16(4):985–92.
6. Kundu P, Voon V, Balchandani P, et al. Neuroimage 2017;154(March):59–80.
7. Chiew M, Smith SM, Koopmans PJ, et al. Magn Reson Med. 2015;74(2):353–64.
8. Ades-Aron B, Lemberskiy G, Veraart J, et al. Radiology 2021;298(2):365–73.
9. Meyer NK, Campeau NG, Black DF, et al. Proc Intl Soc Mag Reson Med. 2021;2703.
10. Vizioli L, Moeller S, Dowdle L, et al. Nat Commun. 2021;12(1):1–15.
11. Meyer NK, Kang D, In M-H, et al. Proc Intl Soc Mag Reson Med. 2021;2868.
12. Trzasko JD, Manduca A. Proc Intl Soc Mag Reson Med. 2011;4371.
13. Cai JF, Candès EJ, Shen Z. SIAM J Optim. 2010; 20(4):1956–82.
14. Candes EJ, Sing-Long CA, Trzasko JD. IEEE Trans Signal Process. 2013;61(19):4643–57.
15. Foo TK, Laskaris E, Vermilyea M, et al. Magn Reson Med. 2018;80(5):2232–45.
16. Kang D, Jo HJ, In M-H, et al. Phys Med Biol. 2020;65(23):235024.
17. Kang D, Jo HJ, In M-H, et al. Proc Intl Soc Mag Reson Med. 2020;1218.
18. Cox RW. Comput Biomed Res. 1996;29(3):162–73.
19. Glover GH, Li TQ, Ress D. Magn Reson Med. 2000;44(1):162–7.
20. Reuter M, Schmansky NJ, Rosas HD, Fischl B. Neuroimage 2012;61(4):1402–18.
21. Posse S, Wiese S, Gembris D, et al. Magn Reson Med. 1999;42(1):87-97.
22. Kundu P, Inati SJ, Evans JW, et al. Neuroimage 2012;60(3):1759-70.
23. Jo HJ, Saad ZS, Simmons WK, et al. Neuroimage 2010;52(2):571–82.
24. Caballero-Gaudes C, Reynolds RC. Neuroimage 2017;154:128–49.
Figures