3482
A single artificial neural network solution to detect pancreatic and lung cancer from high-resolution 1H MR plasma/serum spectra1Department of Radiology, The Johns Hopkins University School of Medicine, Baltimore, MD, United States, 2Department of Pathology, The Johns Hopkins University School of Medicine, Baltimore, MD, United States, 3Department of Surgery, The Johns Hopkins University School of Medicine, Baltimore, MD, United States, 4Department of Oncology, The Johns Hopkins University School of Medicine, Baltimore, MD, United States, 5Department of Medicine, The Johns Hopkins University School of Medicine, Baltimore, MD, United States, 6Radiation Oncology and Molecular Radiation Sciences, The Johns Hopkins University School of Medicine, Baltimore, MD, United States
Synopsis
Early detection of cancers using blood-based analytes for routine screening is a rapidly advancing area. Here, we developed a neural-network based solution to detect pancreatic ductal adenocarcinoma (PDAC) and non-small cell lung cancer (NSCLC) with high sensitivity and specificity using human plasma and serum samples to discriminate between subjects with no known pancreatic or lung disease, subjects with benign disease and subjects with PDAC or NSCLC.
Introduction
The poor prognosis of pancreatic ductal adenocarcinoma (PDAC) is mainly due to late-stage diagnosis1. Early detection of pancreatic cancer is a major unmet clinical need. Lung cancer is the most common cause of cancer death world-wide. The presence of metastatic disease at the time of diagnosis in most patients is a major cause of lung cancer mortality2 highlighting the importance of early detection and screening. Although inroads are being made in developing molecular imaging probes, these have not been clinically translated. There is an urgent need for noninvasive clinically translatable biomarkers of PDAC and NSCLC. Accurate blood-based tests could improve the early detection of these cancers. Here we have evaluated the application of neural-network analysis to 1H MR spectra of human plasma and serum samples to identify PDAC and NSCLC.Methods
Plasma samples from healthy participants with no clinical evidence of pancreatic disease participants (normal, n=49), from participants with benign pancreatic lesions (benign, n=49), and from participants with PDAC (PDAC/malignant, n=53) and serum samples from participants with benign lung lesions (benign, n=11) and from participants with NSCLC (n = 22), were analyzed with 1H MRS. The studies were performed under approved IRB protocols using de-identified samples. 1H MR spectra of plasma were acquired on a Bruker Avance III 750 MHz (17.6 T) MR spectrometer equipped with a 5 mm probe. Serum spectra were acquired on a Bruker 500 MHz (11.7T) MR spectrometer equipped with a 5 mm probe. Plasma or serum samples (250µL) were diluted with D2O buffer (350µL) and spectra with water suppression were acquired using pre-saturation and a single pulse sequence (identified as ZGPR spectra) with the following experimental parameters: spectral width of 15495.86 Hz (8012 Hz for spectra acquired at 500 MHz), data points of 64 K (32K for spectra acquired at 500 MHz), 90o flip angle, relaxation delay of 10 s, acquisition time 2.11 s (2.0447 s for spectra acquired at 500 MHz), 64 scans with 8 dummy scans, receiver gain 64 (80.6 for spectra acquired at 500 MHz). Spectral acquisition, processing and quantification were performed using TOPSPIN 3.5 software. Area under peaks were integrated and normalized with respect to the reference signal.Following initial normalization of spectral data to plasma volumes, mean spectra for each classification group and the differences of the mean spectra of benign and malignant from the control group were calculated to identify segments of the spectra that exhibit significant differences to provide a set of key target locations in the spectra. The spectral differences with respect to the mean of the control spectra at each of these target locations were computed to construct a feature vector. This feature vector was used as the input variable for the neural network analysis to discriminate the three classes. To enhance the accuracy and robustness, a specialized data augmentation technique based on the Variational Auto-Encoder (VAE) neural network approach was used to appropriately scale the number of feature vectors in each class to make them equal. This data augmentation made the training data size more suitable to meet the demands of neural-network training to prevent overfitting. Also, the equal number of feature-vectors in each class can help to minimize biases arising from unbalanced distribution of samples between the three classes. To further reduce overfitting and biases, a minimalist neural network design was used and data samples were randomly divided into training, validation and testing purposes. All the artificial neural-network functions were developed in MATLAB 2020b (MathWorks, Inc).
Results
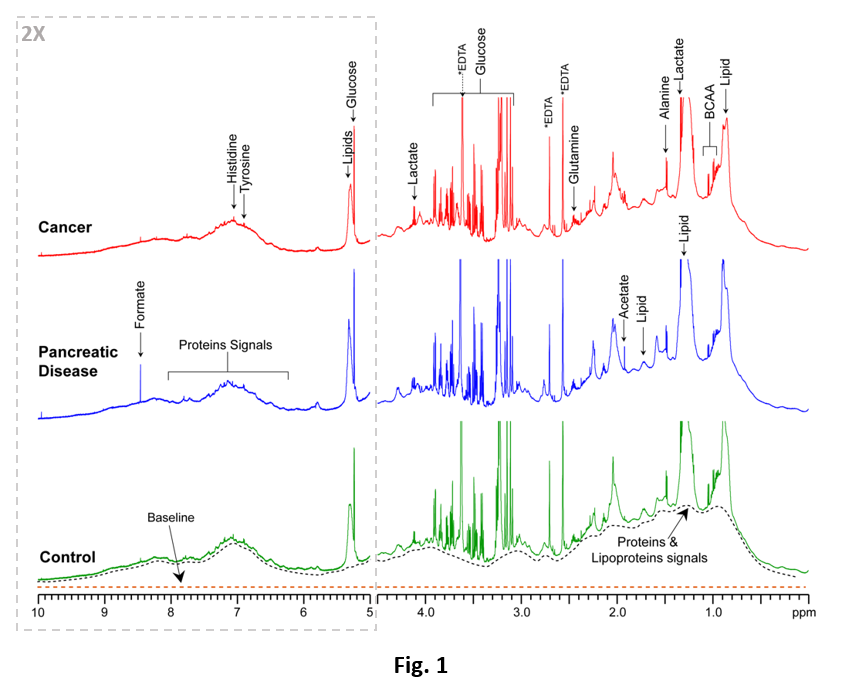
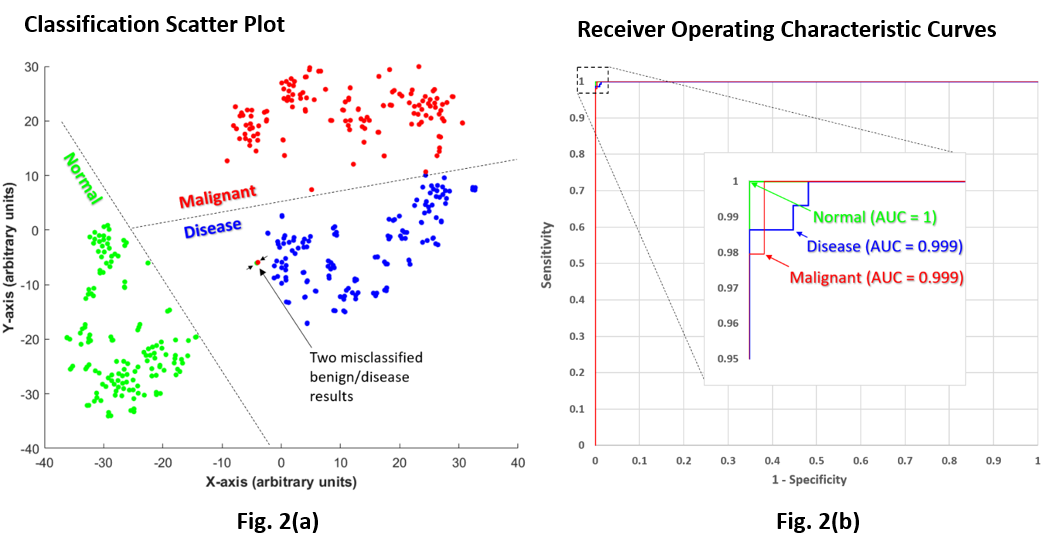
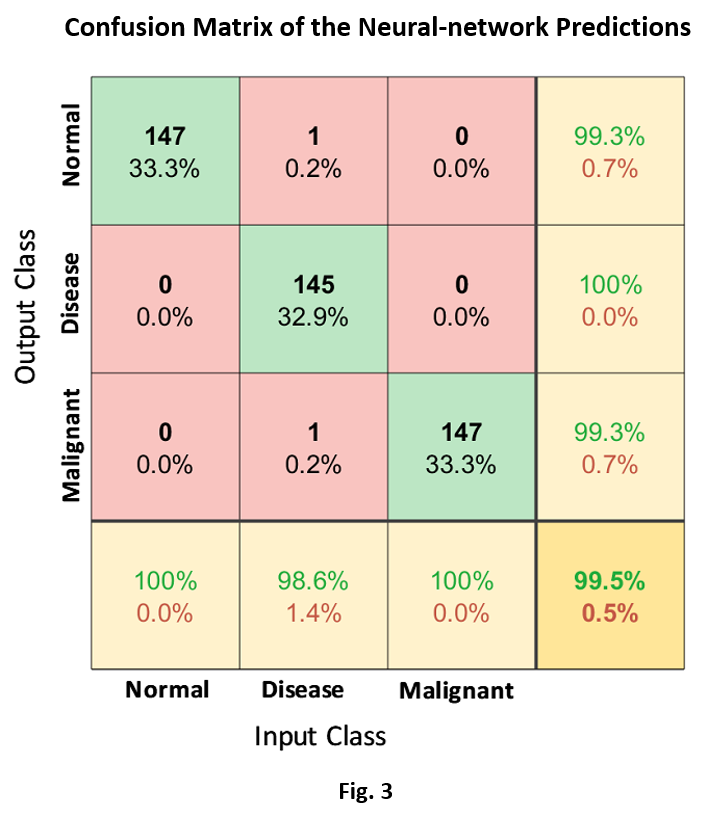
Representative 1H MR spectra from each group are displayed in Fig. 1. The results and the performance of the neural network to successfully discriminate the three classes are illustrated in Fig. 2(a‑b). The scatter plot in Fig. 2(a) illustrates the neural network’s ability to successfully encode the feature vectors into well-separated clusters of the classes with minimal overlap. The classification approach provided the basis for the high sensitivity, specificity, and precision accuracy presented in the receiver operating characteristics (ROC) curves in Fig. 2(b). The confusion matrix plot in Fig. 3 shows the prediction accuracies within each class and as well as between all classes.Discussion
A combination of spectral features extraction and neural network processing of 1H MRS data of plasma and serum samples can successfully discriminate between normal, benign and malignant PDAC and NSCLC.Acknowledgements
Acknowledgement: This work was supported by NIH R35CA209960, R01CA193365, and U01CA210170. We thank Dr. Karen Horton for her support.References
1. Blackford AL, Canto MI, Klein AP, Hruban RH, Goggins M: Recent trends in the incidence and survival of Stage 1A Pancreatic Cancer: A Surveillance, Epidemiology, and End Results analysis. J Natl Cancer Inst., 2020, 112:1162-9
2. Herbst, R.S., Morgensztern, D. & Boshoff, C. The biology and management of non-small cell lung cancer. Nature 553, 446-454 (2018)
Figures