3475
Dynamic spectral modes of resting-state BOLD time courses in white matter1Vanderbilt University Institute of Imaging Science, Nashville, TN, United States
Synopsis
We investigated voxel-wise spectrograms derived from the time-varying spectral patterns of BOLD signals in white matter. Finite-window spectra are non-stationary but may be categorized into five distinct modes that recur over time. Close scrutiny of the signal profiles reveals distinct spatial distributions of the occurrences and durations of these modes, and such distributions are highly consistent across individuals. In addition, two communities of white matter voxels may be identified according to a hierarchical arrangement of transitions among modes. Our findings reveal the non-stationary nature of BOLD spectral patterns, and provide a novel spatial-temporal-frequency characterization of resting-state signals in white matter.
Introduction
A growing body of evidence has shown that BOLD signals can be reliably detected in white matter (WM) and reflect neural activities. We recently showed that the power spectra of WM time courses differ in shape from those in gray matter in the low-frequency band, and they vary as a function of location and depend on local neurovascular and anatomical relationships within WM.1 Those analyses implicitly assumed the resting-state time courses were statistically stationary. However, BOLD signals in gray matter exhibit dynamic variations that in turn lead to time-varying functional connectivity, but whether such temporal variations also occur in WM has not previously been investigated. Here we demonstrate that BOLD power spectra estimated over finite time windows vary over time and reflect a superposition of multiple sub-patterns that recur over time.Methods
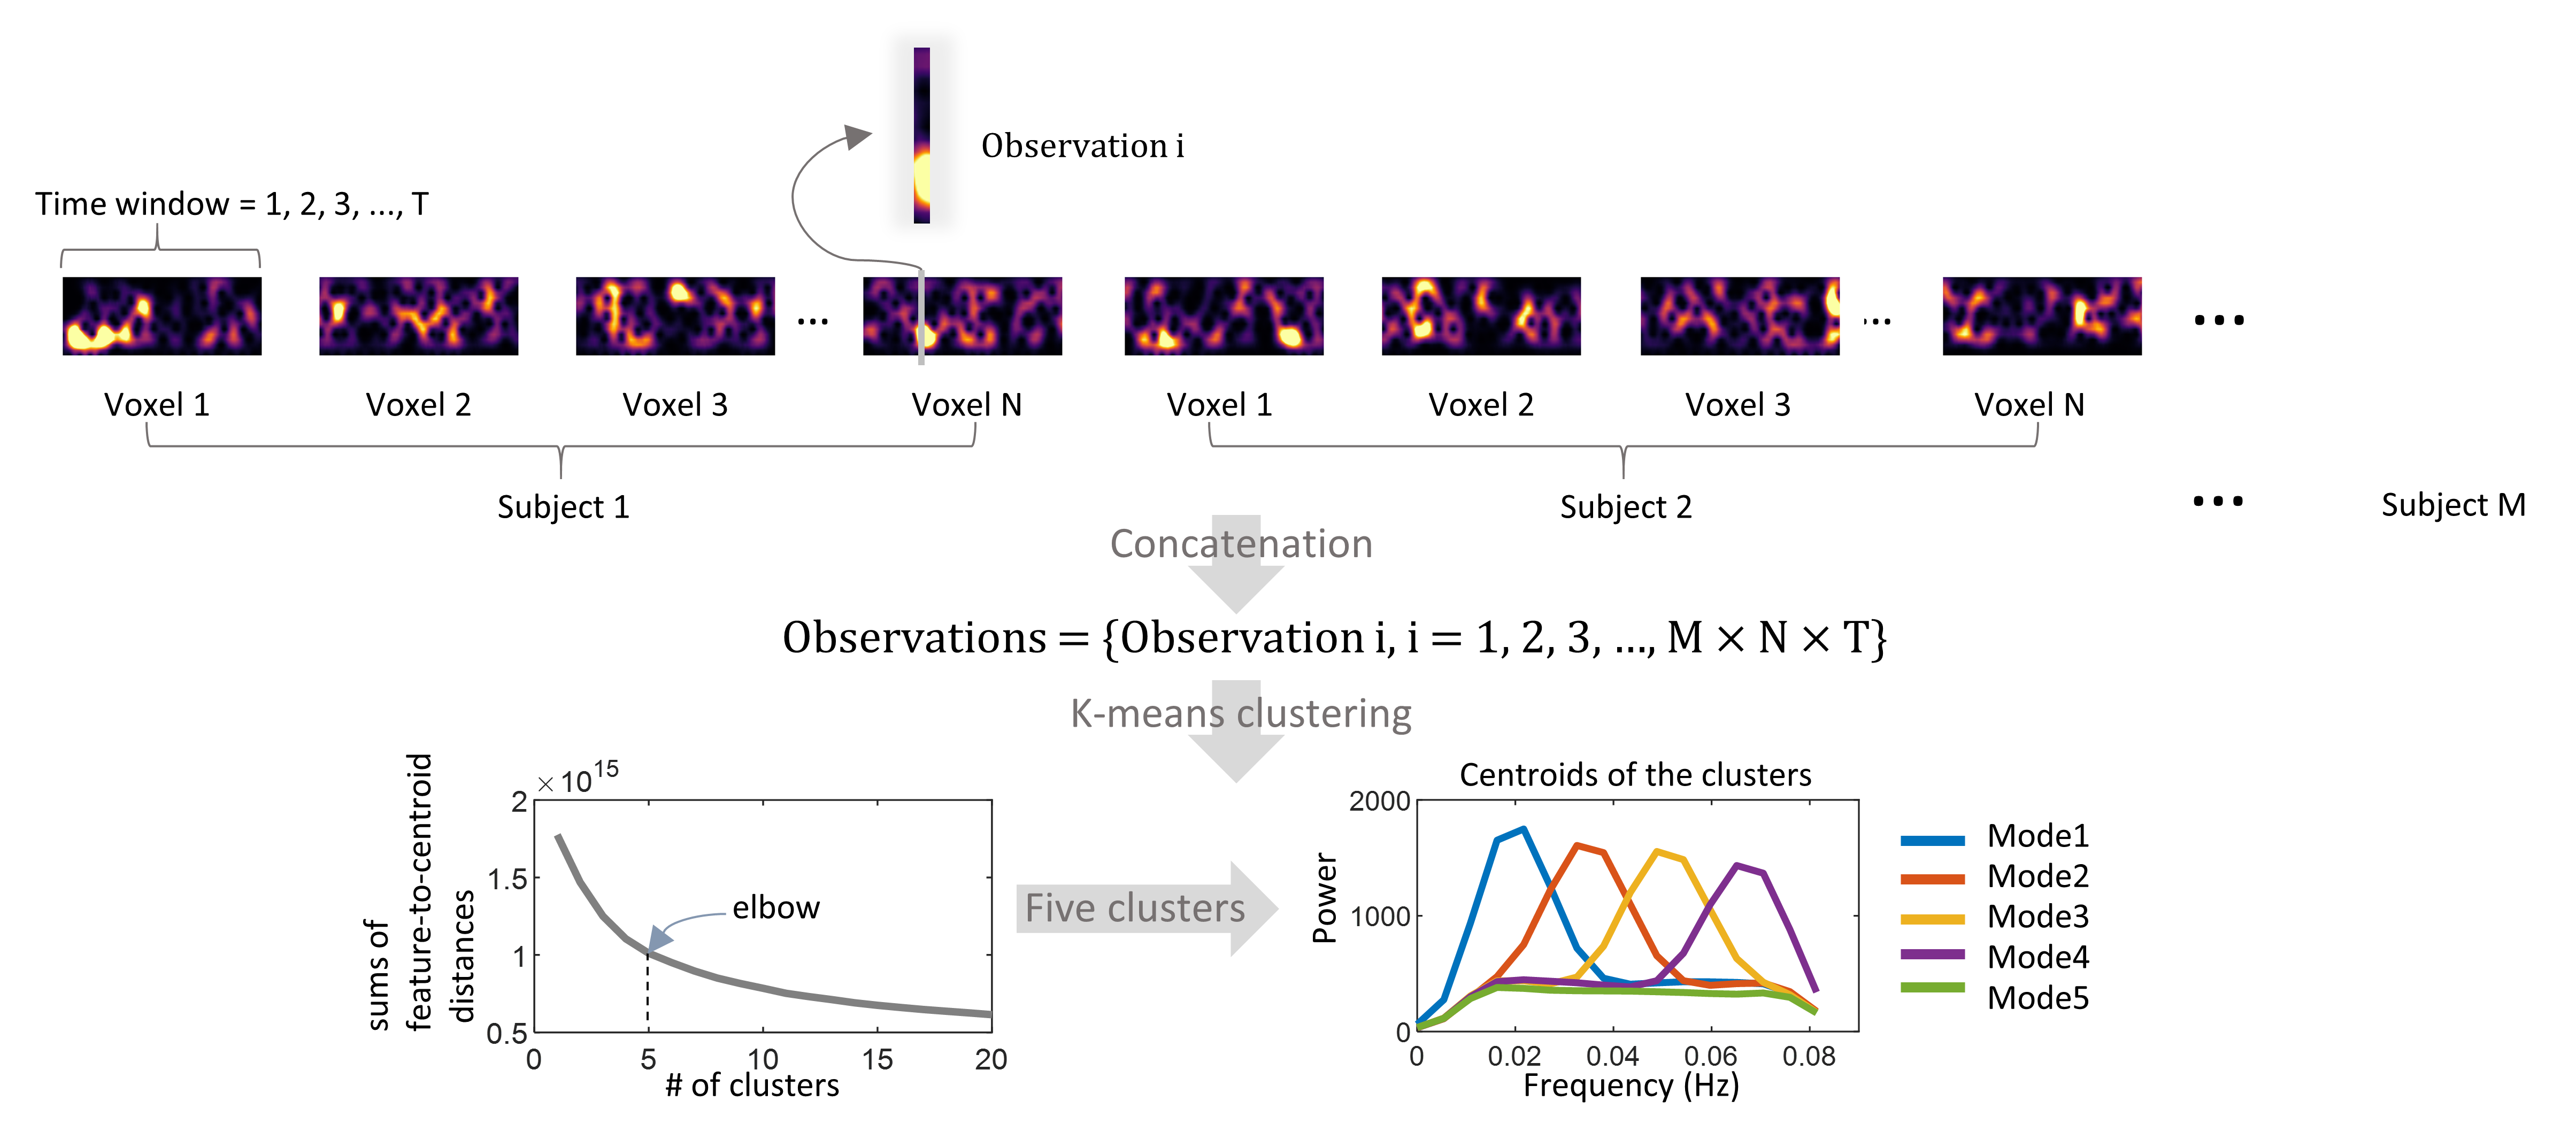
Resting-state MRI scans of 200 subjects were randomly selected from the human connectome project (HCP) database. All were healthy young adults, 88 M /112 F, 22 to 35 years. The imaging protocols are described in detail in previous reports.2 Images were preprocessed through the minimal preprocessing pipelines as detailed elsewhere.3 We performed additional processing including regression of head movement parameters, cardiac and respiratory noise, followed by a correction for linear trends and temporal filtering with a band-pass filter (0.01 – 0.08 Hz). As the analyses were restricted to WM, a group-wise WM mask was reconstructed by averaging the WM parcellations derived from the FreeSufer4 tool and thresholded at 0.95. Time-varying power spectra for each WM voxel were calculated using short-time Fourier transforms. Briefly, each time course was split into 266 windows. Each window was 100.8 s in length, with a 97.92 s section overlapped with the previous window. As illustrated in Figure 1, distinct spectral modes were derived using k-means clustering of the windowed spectral patterns across time windows, WM voxels, and subjects. The BOLD time course of each voxel can then be represented by transitions between the five modes over time. The occurrences, durations, and transition number were measured for every voxel, resulting in maps of their distributions for each subject.Results
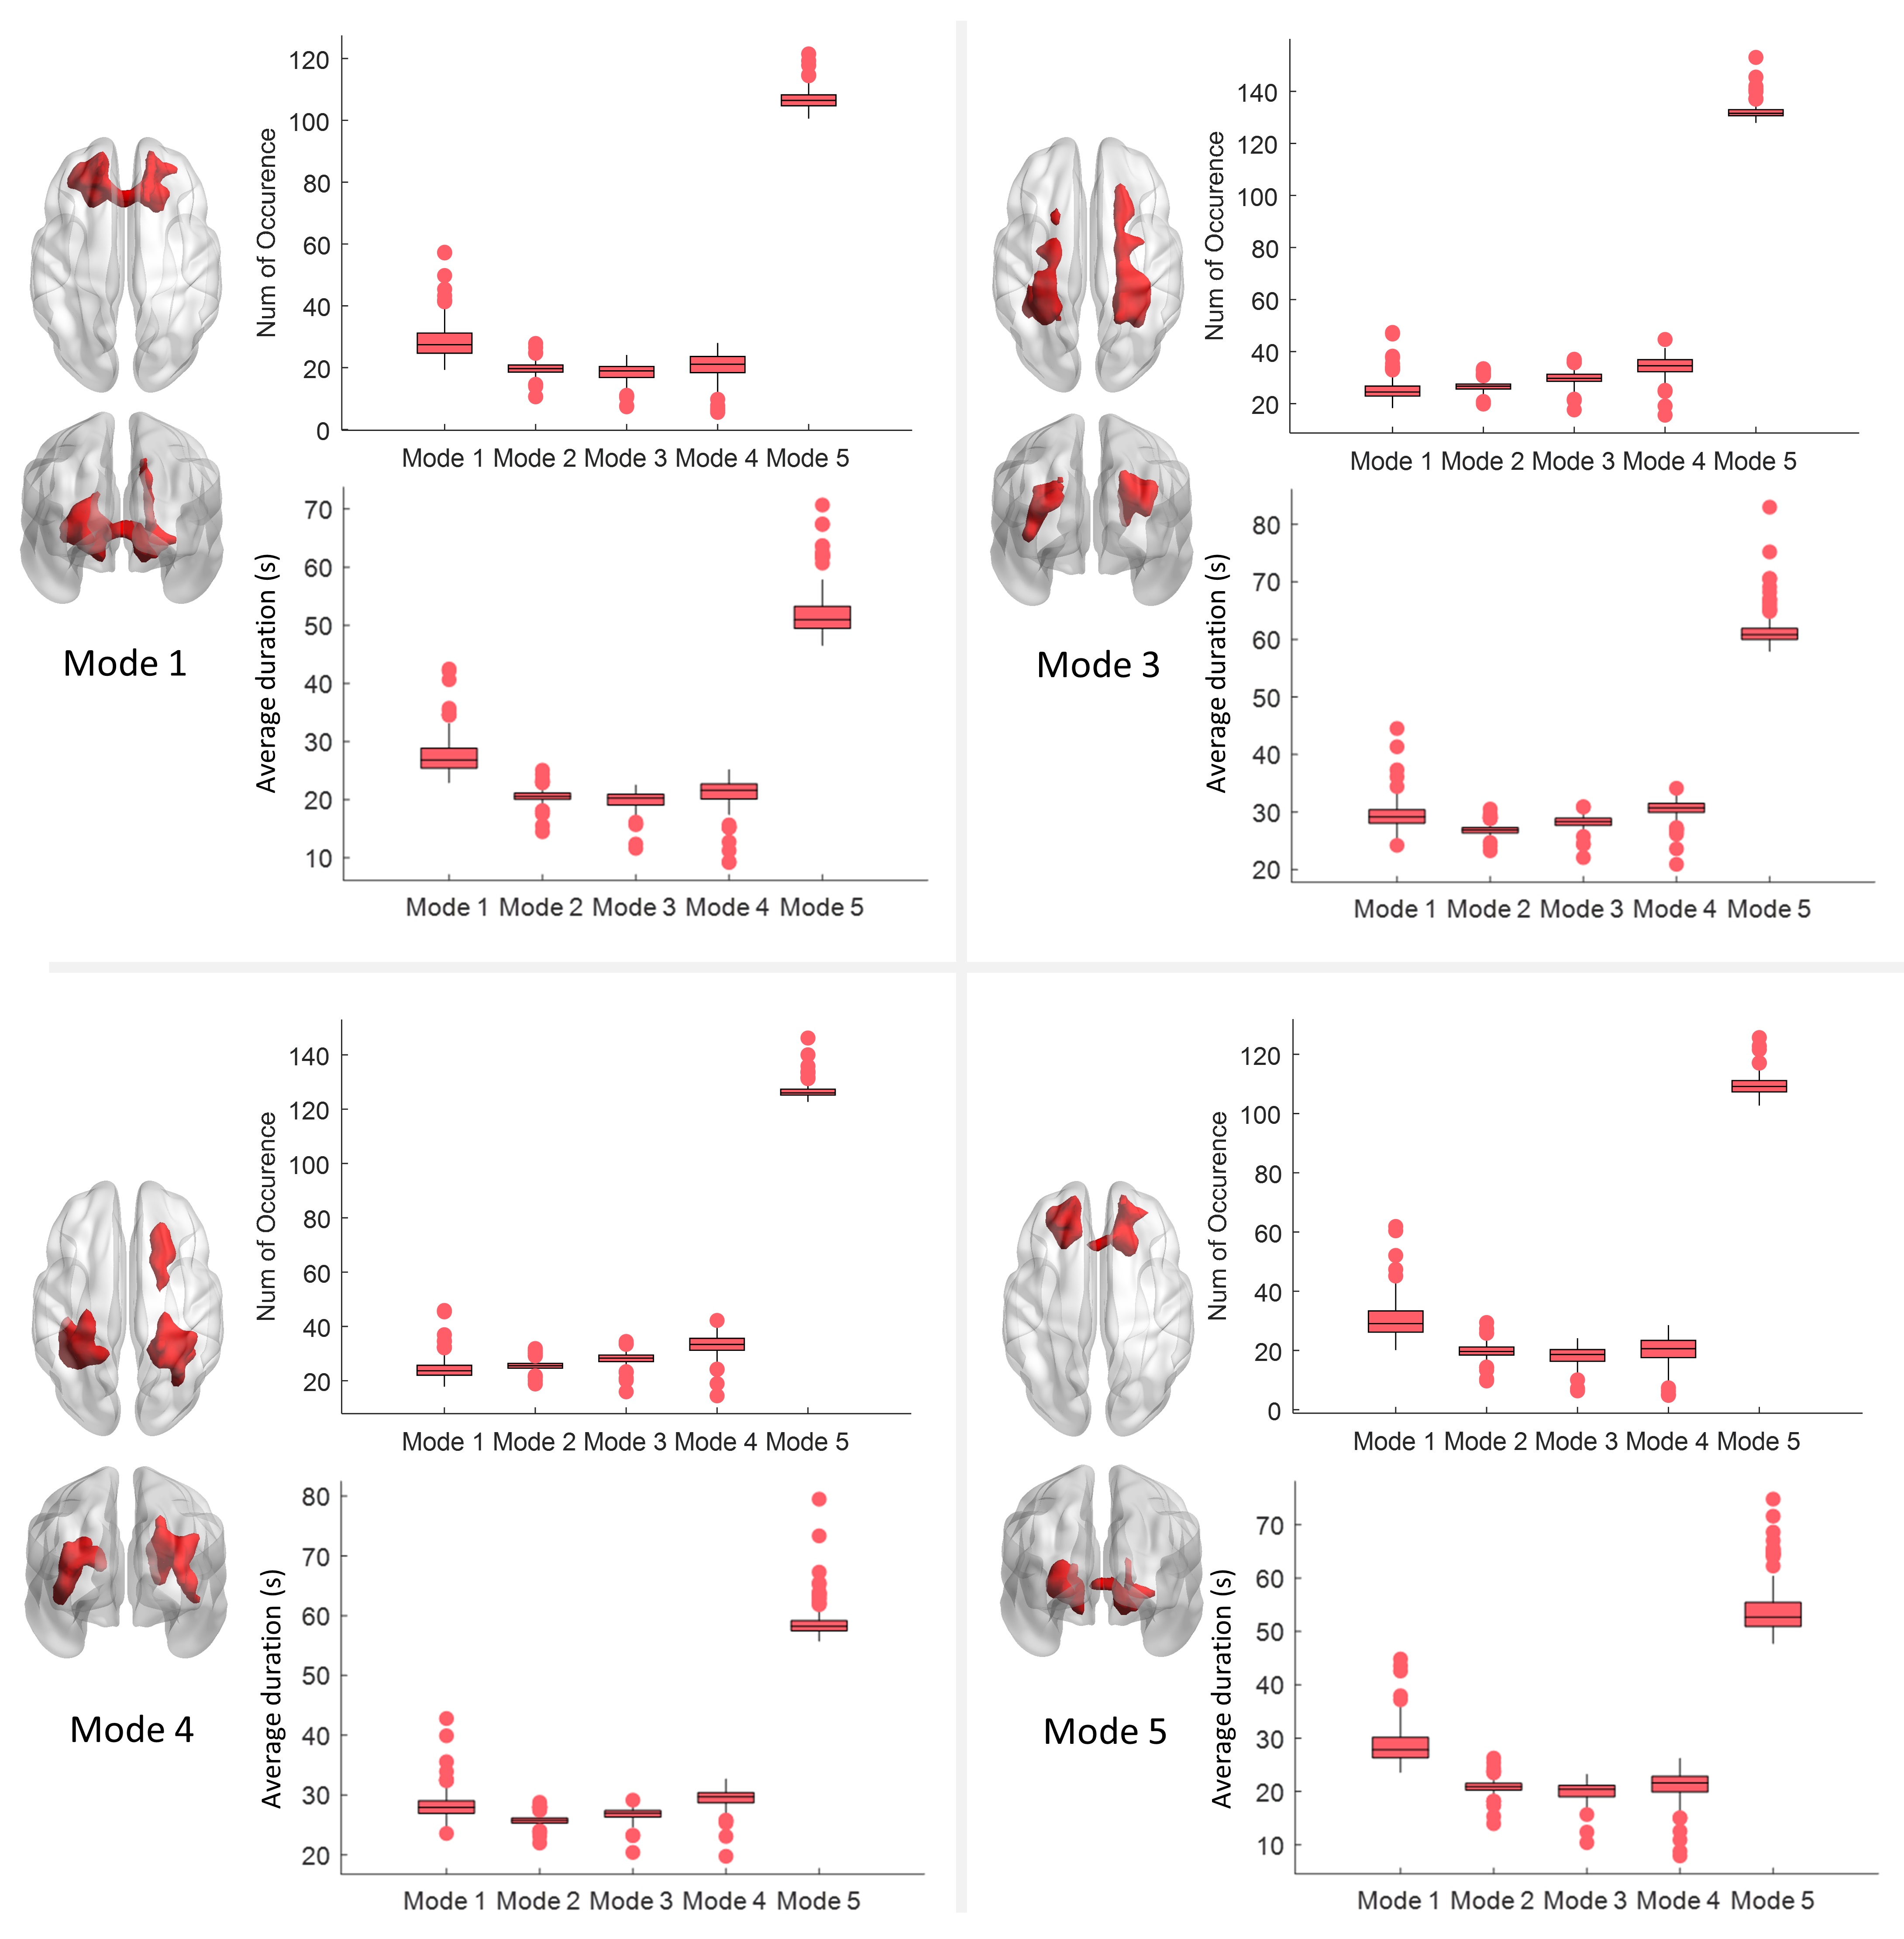
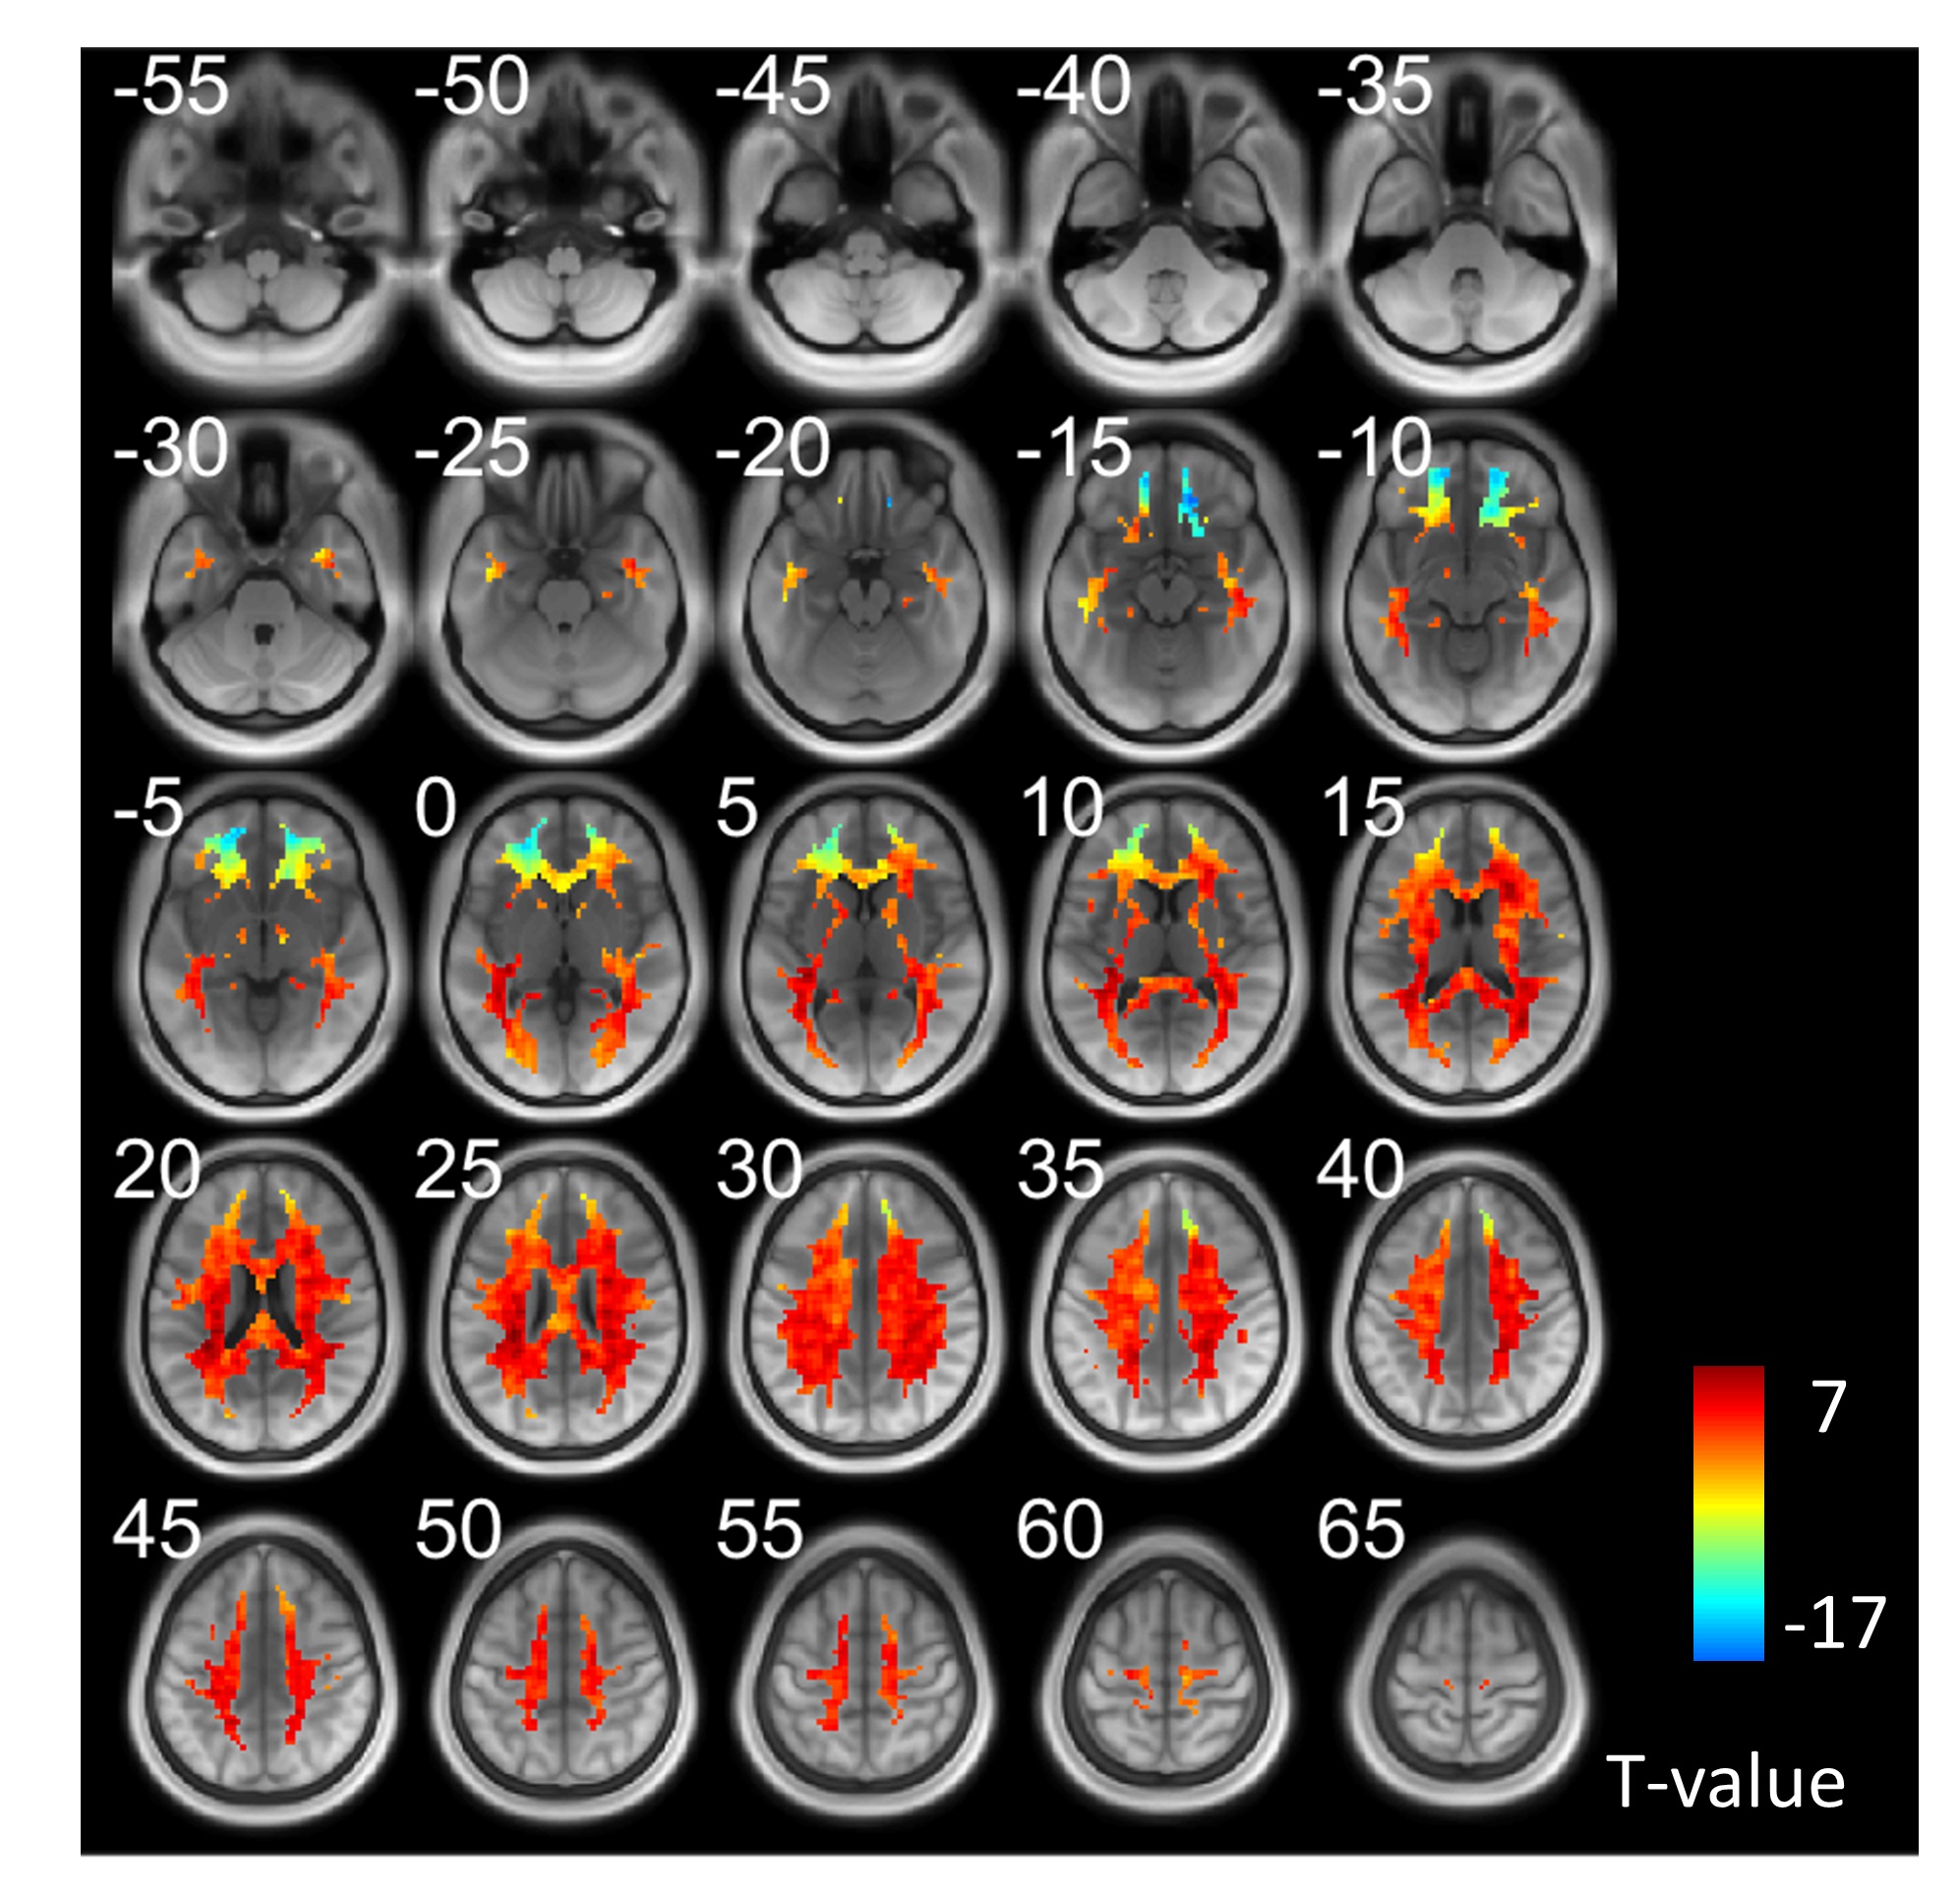
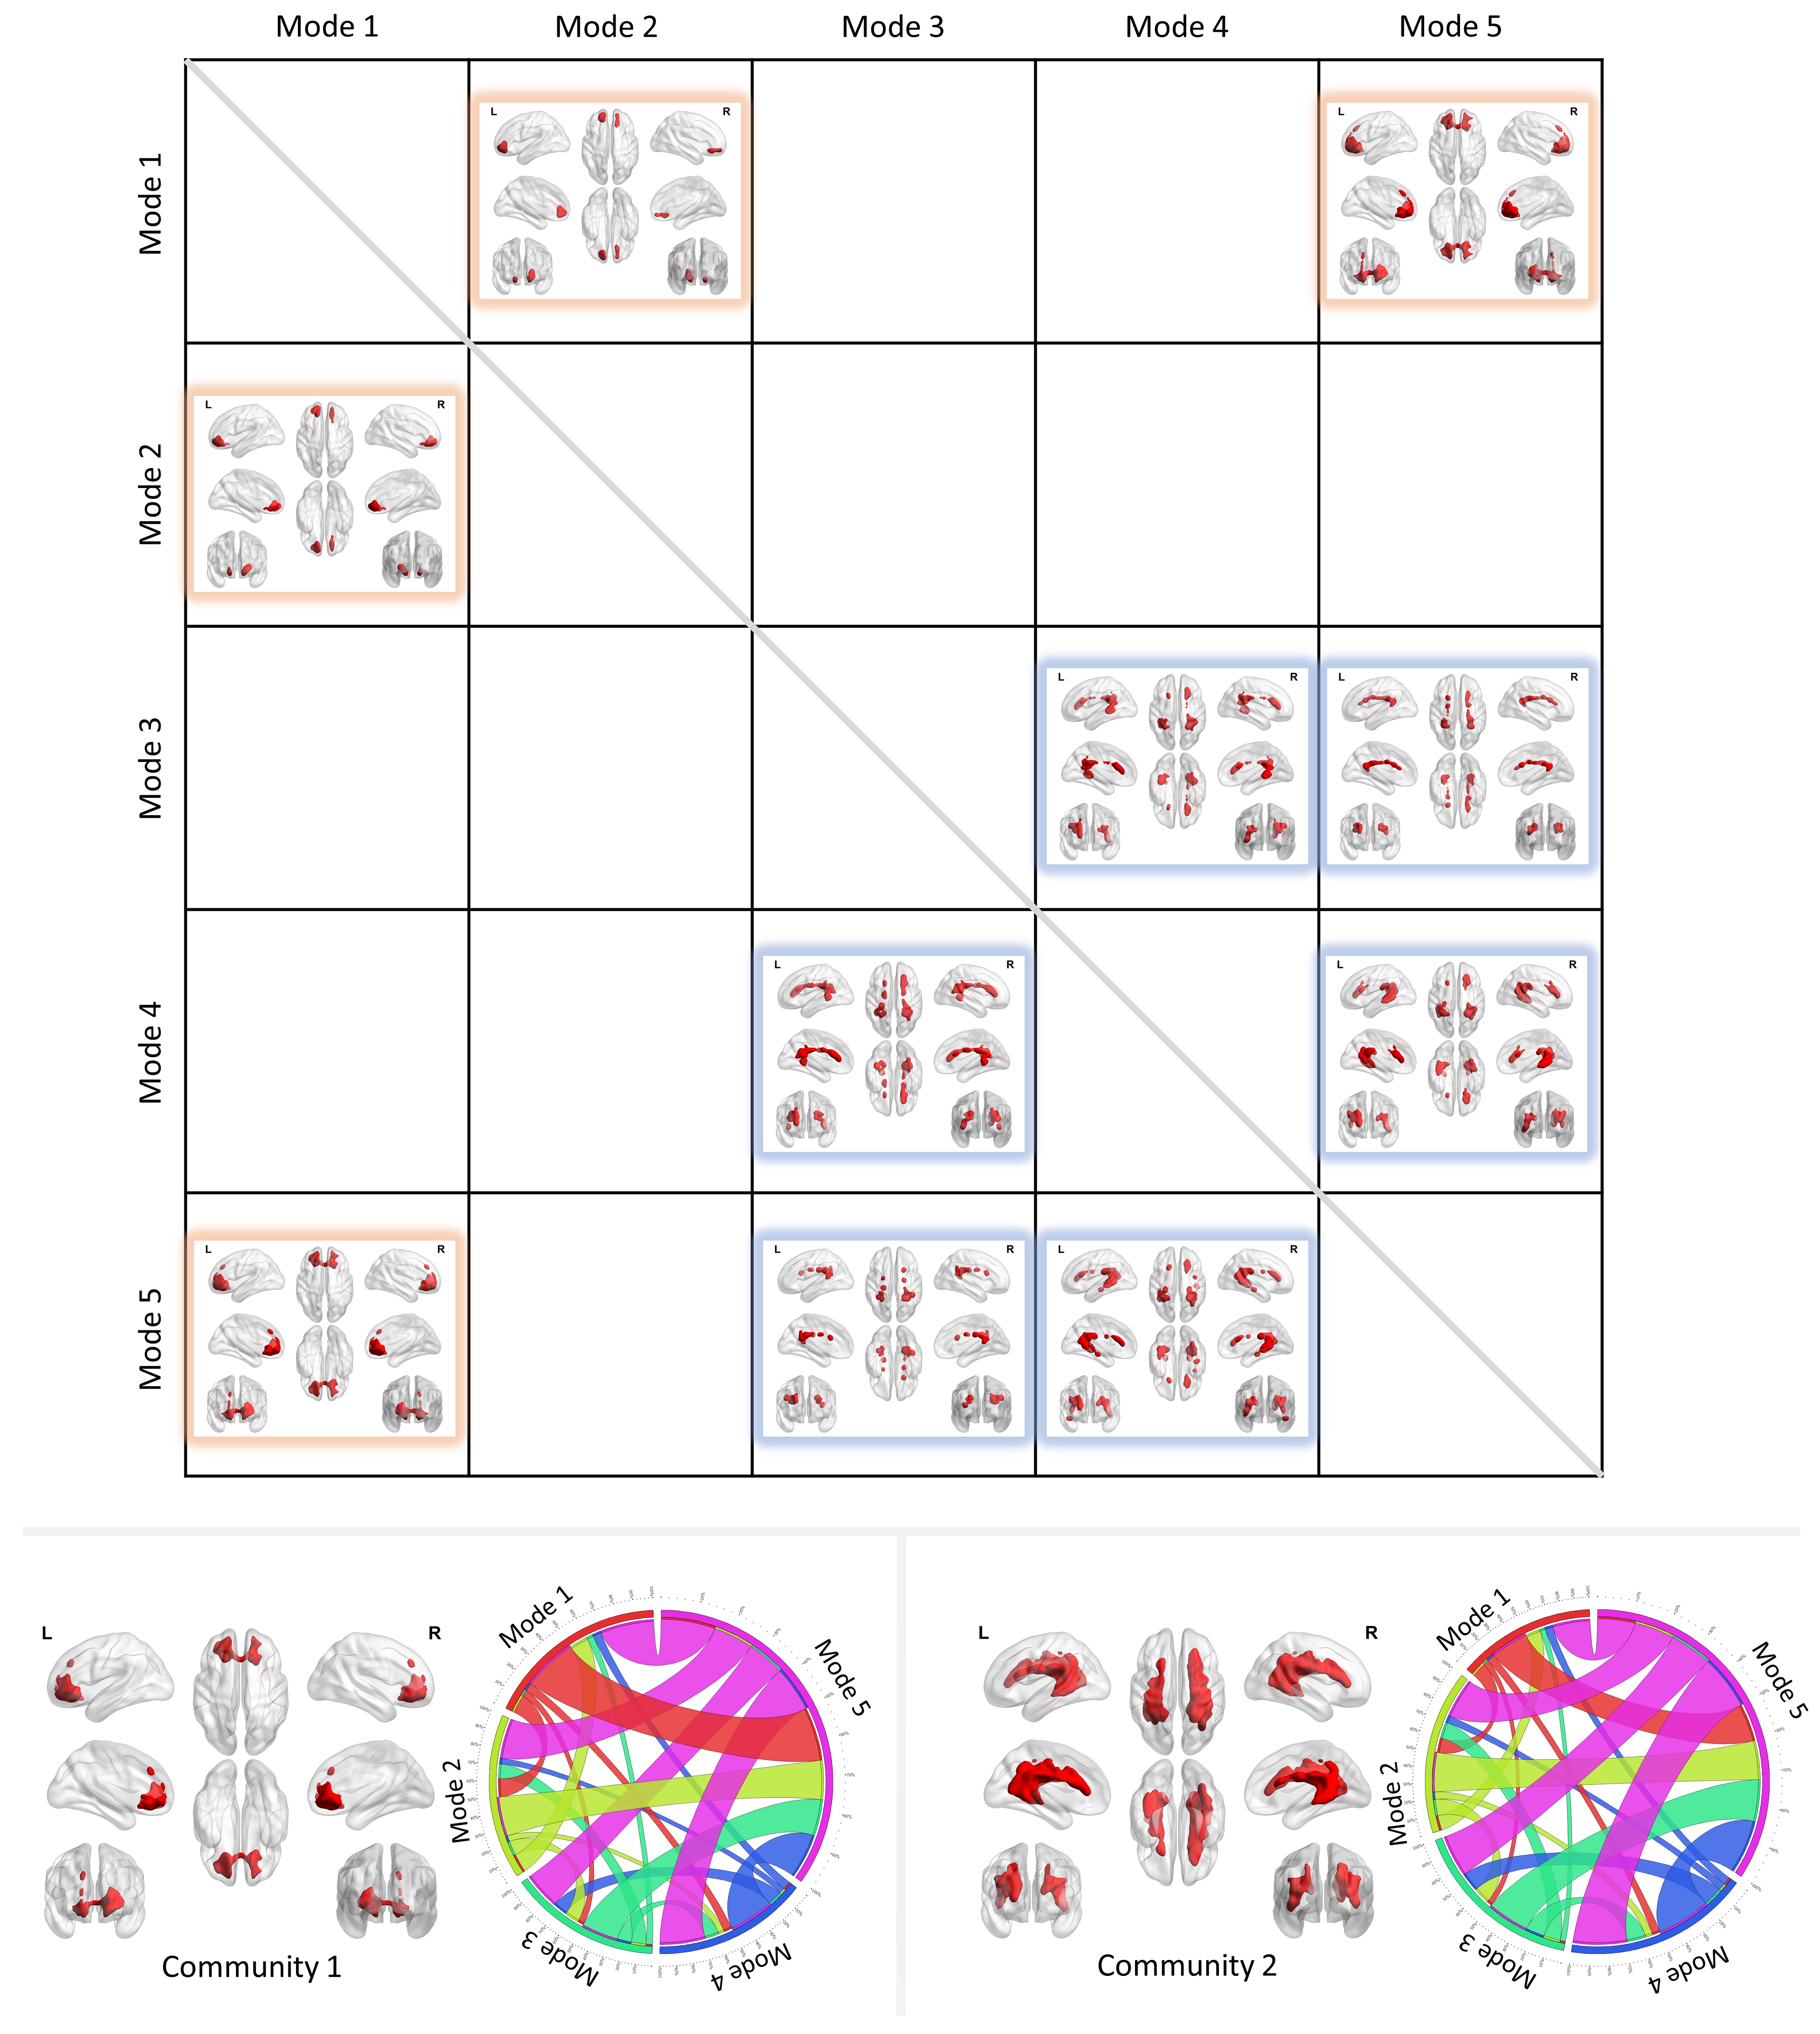
As shown in Figure 2, Modes 1-4, which we called unimodal modes, exhibit single sharp peaks at different frequencies within the range 0.01-0.08 Hz, while mode 5 is a uniform mode, with spectral power relatively constant and low across the frequency band of interest. The distribution of voxels that exhibit significantly high occurrences of each mode is visualized in Figure 3, where the inferior frontal WM voxels exhibit significantly higher occurrences of modes 1 and 5 than other voxels. Meanwhile, the paraventricular and temporal voxels exhibit significantly higher occurrences of modes 3 and 4 than other voxels. In addition, in general, modes 1 and 5 occur more often and persist longer than modes 3 and 4 in the inferior frontal area, whereas they arise less often and last for shorter times in paraventricular and temporal areas, where modes 3 and 4 occur more often. Figure 3 maps the number of transitions among the five modes for WM voxels. The inferior frontal area exhibits a significantly lower number of transitions compared to the rest of WM. Figure 4 shows the voxels that exhibit a significantly higher transition from one mode to another than the rest of WM voxels across subjects. Two communities of voxels could be clearly identified and are coded by different colors. The lower left panel shows the voxels that exhibit significantly higher transitions among modes 1, 2, and 5 (community 1), along with its transition probability among the five modes shown on the right. The lower right panel shows the voxels that exhibit significantly higher transitions among modes 3, 4, and 5 (community 2), along with its transition probability among the five modes shown on the right.Discussions
The current study shows that the distinct spectral patterns observed in our previous work1 are actually the unweighted combinations of a series of time-varying spectral patterns. The uniform mode, mode 5, exhibits substantially higher occurrence and duration than other modes, suggesting that BOLD fluctuations are maintained at a low power level across frequencies that uniformly vary between 0.01-0.08 Hz most of the time, accompanied by brief bursts (unimodal mode 1 2,3,4) with higher power at more concentrated frequency ranges. Moreover, these occurrences and durations are consistent across subjects, reflecting a highly reproducible pattern of WM BOLD signal, which has not previously been identified from the original time courses. Transitions between the uniform mode and unimodal modes were substantially more frequent than the transitions among unimodal modes. Particularly, direct transitions between modes 1, 2 and modes 3, 4 were rarely observed. These findings support the notion that mode 5 is a “baseline” mode from which a unimodal mode is likely to first transition before switching to other unimodal modes.Conclusion
Our findings revealed the non-stationary nature of the spectral patterns of BOLD fluctuations in WM. The measurements of BOLD spectra were highly consistent and reproducible, including occurrence, duration, and transitions of modes, and reveal recurring patterns of power spectra that have not been previously reported in WM BOLD signals, adding new information on the spatial-temporal-frequency-physiological associations in the human brain.Acknowledgements
This work was supported by the National Institutes of Health (NIH) grant R01 NS093669 (J.C.G) and R01 NS113832 (J.C.G), and Vanderbilt Discovery Grant FF600670 (Gao). Imaging data were provided by the Human Connectome Project, WU-Minn Consortium (Principal Investigators: David Van Essen and Kamil Ugurbil; 1U54MH091657) funded by the 16 NIH Institutes and Centers that support the NIH Blueprint for Neuroscience Research; and by the McDonnell Center for Systems Neuroscience at Washington University.References
1. Li, M., Gao, Y., Ding, Z. & Gore, J. C. Power spectra reveal distinct BOLD resting-state time courses in white matter. Proceedings of the National Academy of Sciences 118, e2103104118 (2021).
2. Van Essen, D. C. et al. The Human Connectome Project: A data acquisition perspective. Neuroimage 62, 2222–2231 (2012).
3. Glasser, M. F. et al. The minimal preprocessing pipelines for the Human Connectome Project. Neuroimage 80, 105–124 (2013).
4. Dale, A. M., Fischl, B. & Sereno, M. I. Cortical surface-based analysis. I. Segmentation and surface reconstruction. Neuroimage 9, 179–194 (1999).
Figures