3471
Perivascular Space Quantification with Deep Learning synthesized T2 from T1w and FLAIR images1Diagnostic Radiology and Nuclear Medicine, University of Maryland School of Medicine, Baltimore, MD, United States, 2Siemens Medical Solutions USA, Inc., Malvern, PA, United States
Synopsis
The perivascular space (PVS) plays a major role in brain waste clearance and brain metabolic homeostasis. Enlarged PVS (ePVS) is associated with many neurological disorders. ePVS is best depicted as hyper-intensities T2w images and can be reliable quantified with both the 3D T1w and T2w images. However many studies opt to acquire 3D FLAIR images instead of T2w due to its high specificity to white matter abnormalities (e.g. the ADNI study). Here we show that deep learning techniques can be used to synthesize T2w images from T1w & FLAIR images and improve the ePVS quantification in absence of T2w images.
Introduction
The perivascular space (PVS), also known as Virchow-Robin space, plays a major role in brain waste clearance and brain metabolic homeostasis. Large PVS dilation has been associated with many neurological disorders, such as Dementia [1-2], Alzheimer’s Diseases [3], or multiple sclerosis [4]. The PVS is best depicted as hyper-intensities T2w images. Recently Sepehrband et al. [5] proposed automatic quantification of the ePVS by combining the 3D T1 and 3D T2 volumes to enhance the PVS visibility. While 3D T1w images are often available, high resolution T2w images are more frequently absent. Instead, many studies opt to acquire 3D FLAIR images due to its high specificity to white matter abnormalities (e.g. the ADNI study). As deep learning techniques have shown great promise for MRI data synthesizing [6-7], we investigate if synthesized T2 images from the T1 and FLAIR image can assist in ePVS quantification.Methods
Data acquisition: 3D T1w, 3D T2w and 3D FLAIR images were acquired on 30 participants with a mixture of control and mild traumatic brain injury patients (Age: 38±15yrs, range: 20-72, 13F), with no other neurological disorders for DL model training. All 3D MRIs were conducted on a 3T system (MAGNETOM Prisma, Siemens Healthcare, Erlangen, Germany) using a 64ch head neck coil, with 1mm3 isotropic resolution, 256mm FOV and 176 sagittal sections. Other imaging parameters include 3D-T1w: TE/TR/TI = 3.37ms/4000ms/1400ms, FA = 6⁰, BW = 200Hz/Px. 3D-T2w: TE/TR = 349ms/3200ms, Turbo factor 280, BW = 781 Hz/Px. 3D-FLAIR: TE/TR/TI = 390ms/5000ms/1800ms, Turbo factor 280, BW = 781 Hz/Px. An additional cohort of 20 healthy volunteers (Age: 33±13yrs, range: 21-60, 12F) were used as test subjects for ePVS quantification.Image processing: The 3D T1w & T2w images were processed using the Human Connectome Project (HCP) pipeline [8], which include registration and sub-cortical segmentation with Freesurfer. 3D FLAIR images were further linearly aligned to the T1w images for each subject. All volumes were bias corrected by N4ITK [9] followed with histogram-based intensity normalization [10]. ePVS quantification was performed as in [5] where an enhanced perivascular contrast (EPC) image was calculated first using 3D T1 and 3D T2 volumes, followed by Frangi filter and thresholding. ePVS values were calculated within the whole brain white matter, as well as in 70 subregions from segmentation results. ePVS volumes calculated from the pair of 3D T1w and 3D T2w were considered as the ground truth.
With a slightly different pipeline skipping the EPC image calculation, ePVS was also quantified using the 3D T1w images only. ePVS from T1 only was calculated to provide a comparison basis in absence of T2w volume.
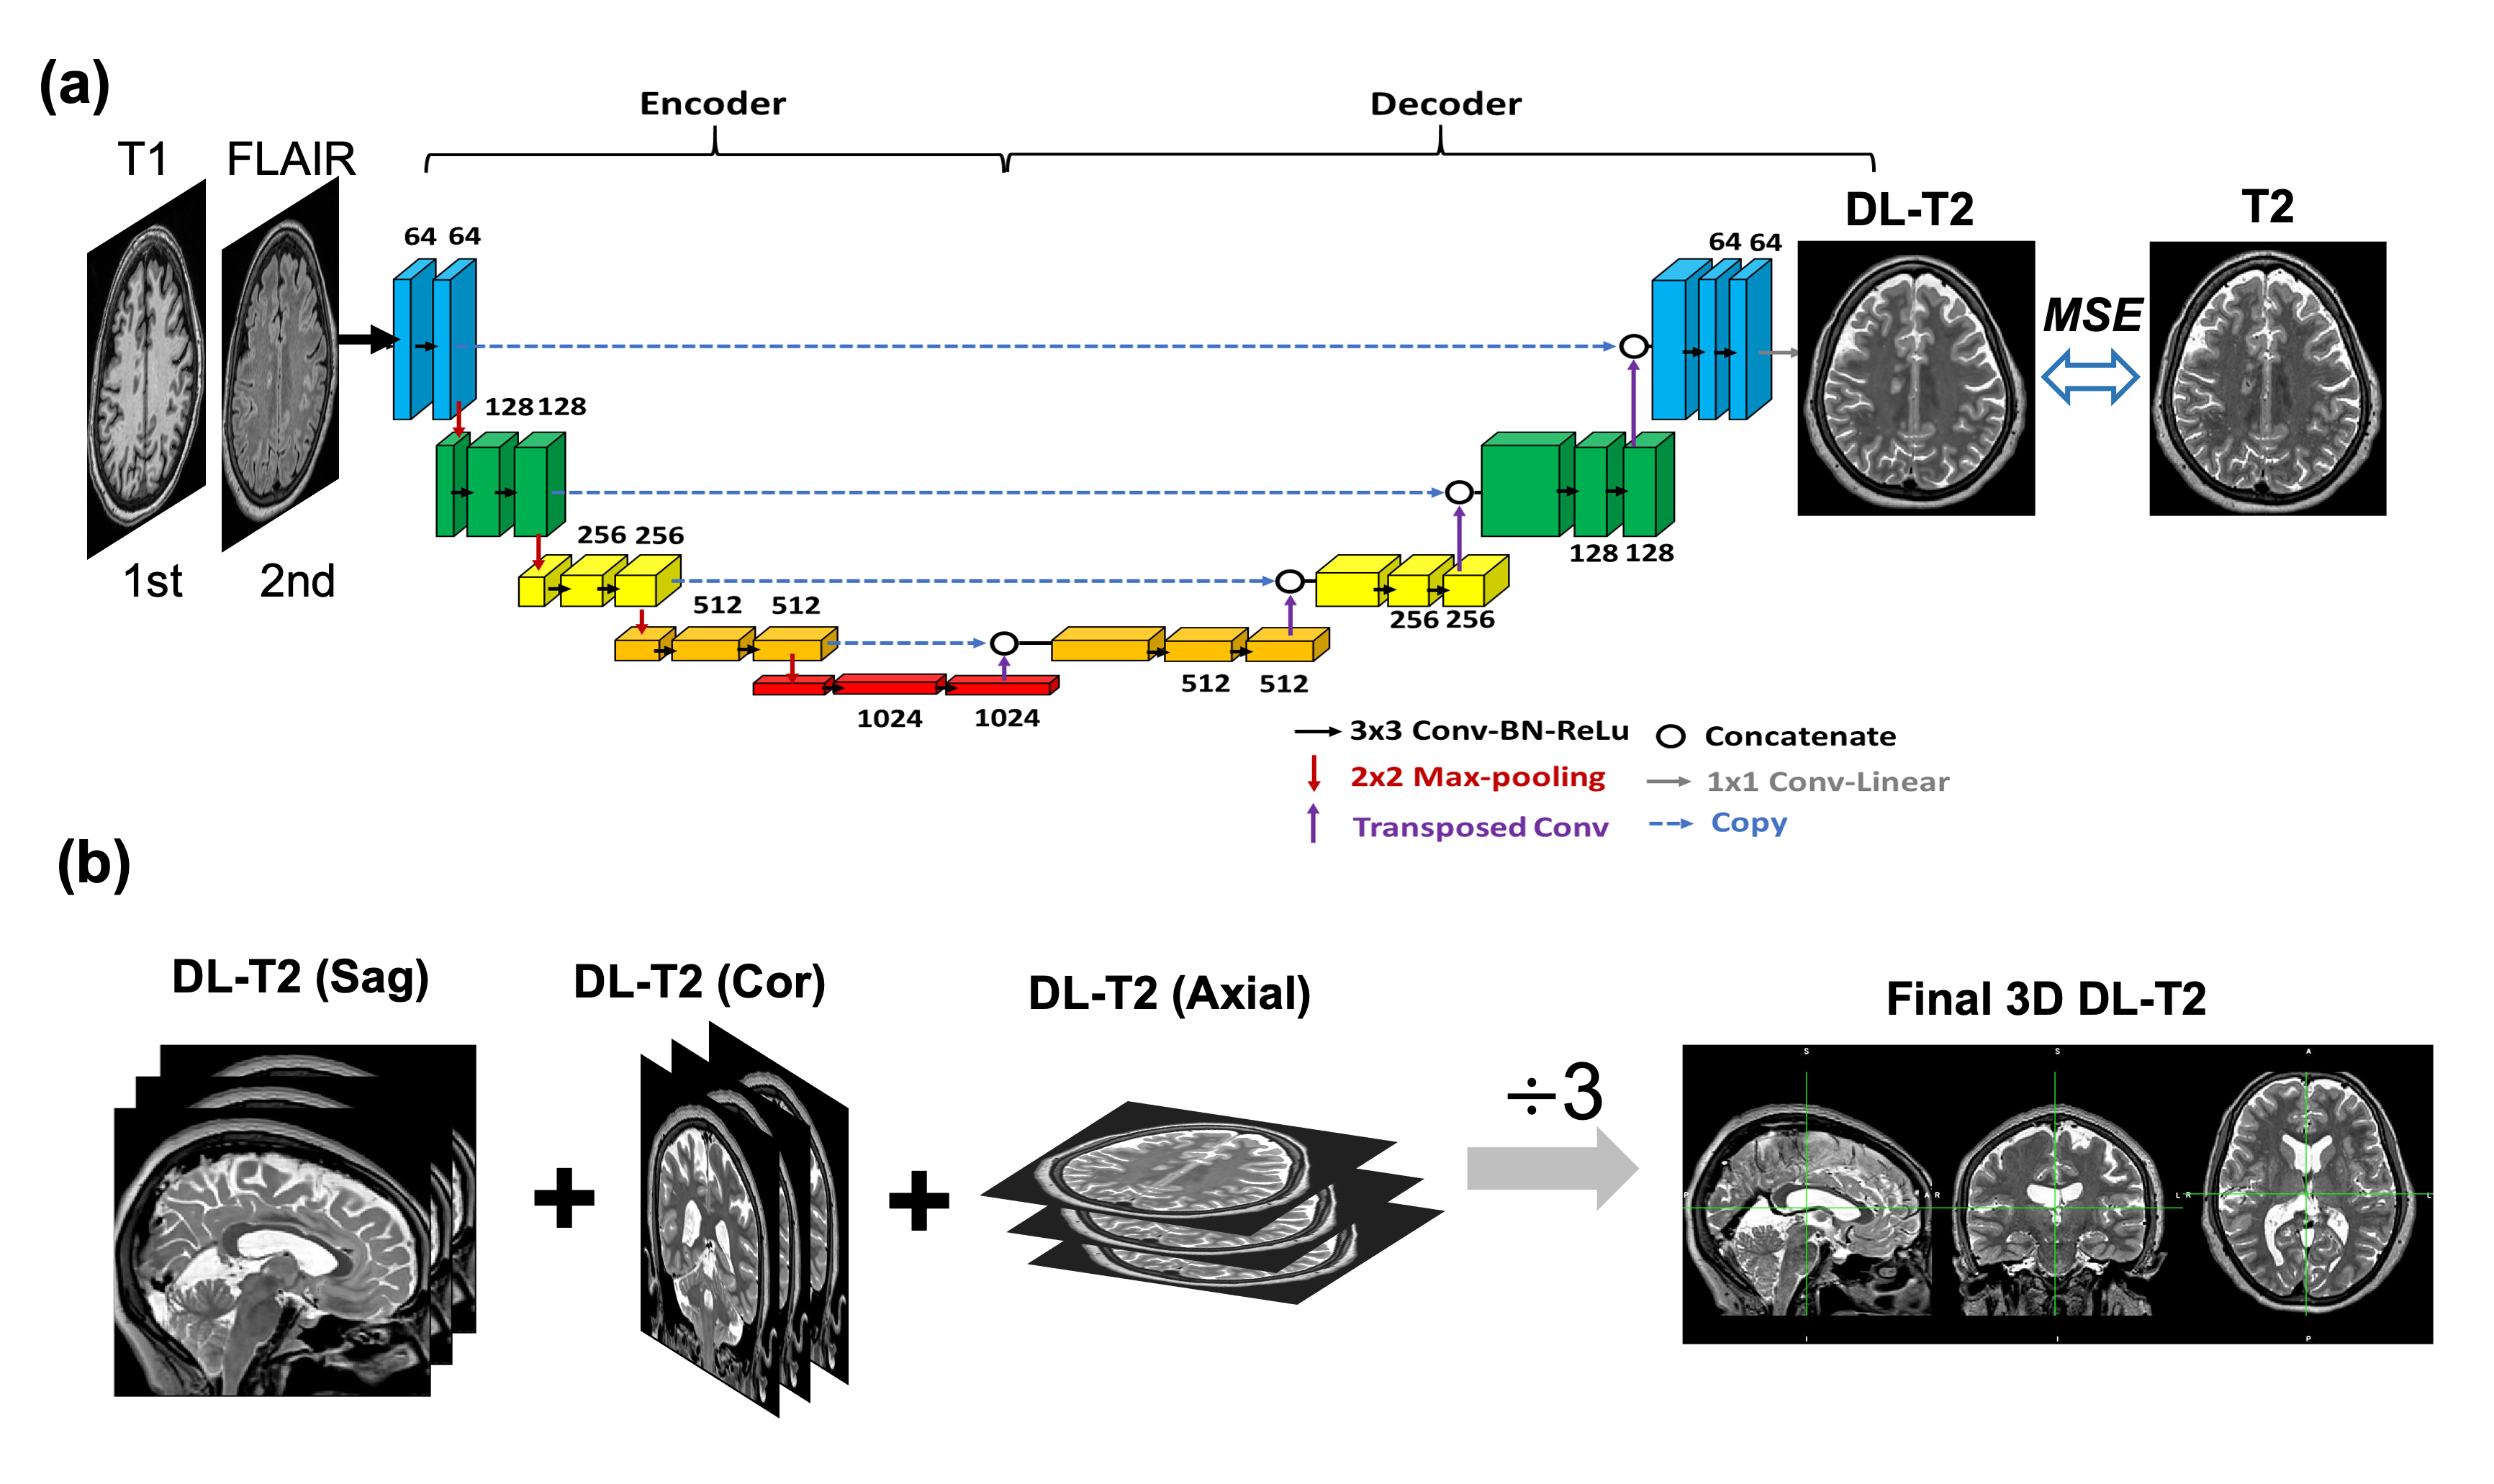
Deep Learning model training: A schematic diagram of the DL model architecture is illustrated in Figure 1 based on U-Net convolution-neural-network (CNN) [11]. Training process: 2D stacks of T1w and FLAIR image pairs were used as input to the network, and the corresponding T2w images were used as the target. Inference process: the 2D data were fed into the network as sagittal, coronal and axial slices individually, effectively creating 3 sets of predication datasets, followed with averaging to produce the final 3D DL T2 volume. Training and validation were randomly split as 80% and 20% from the 30 datasets built upon PyTorch with the loss function defined as the mean squared error (MSE), 100 epochs and a learning rate at 0.001.
Results from Testing Data
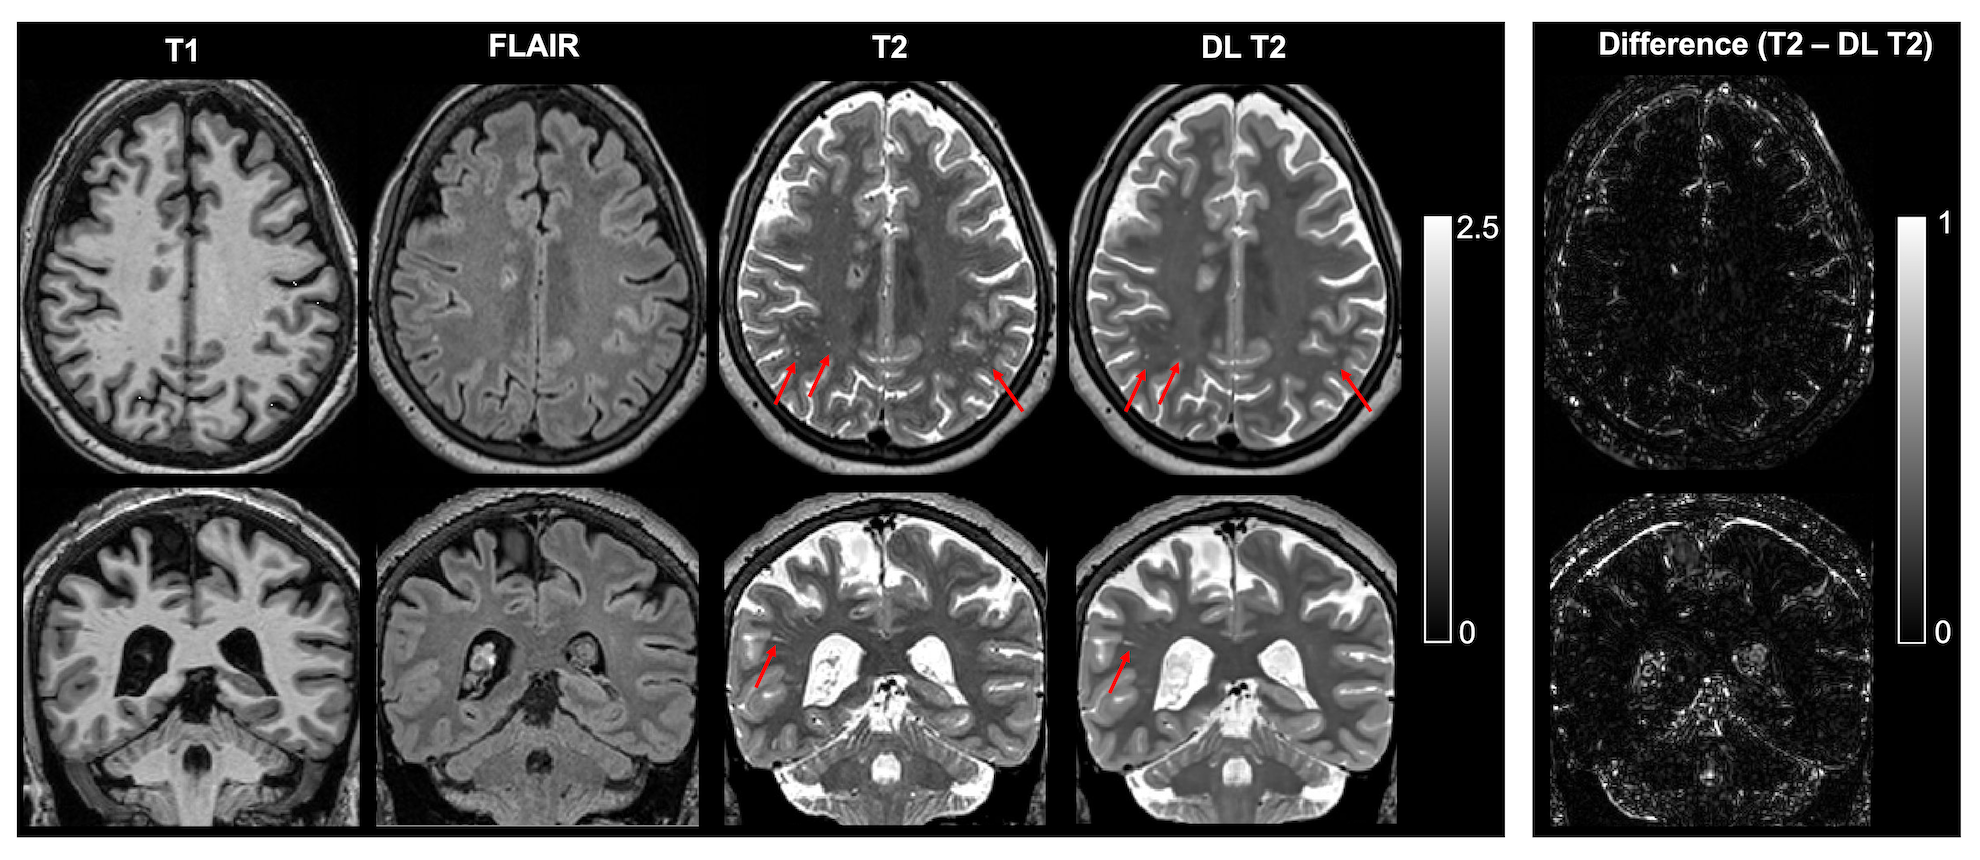
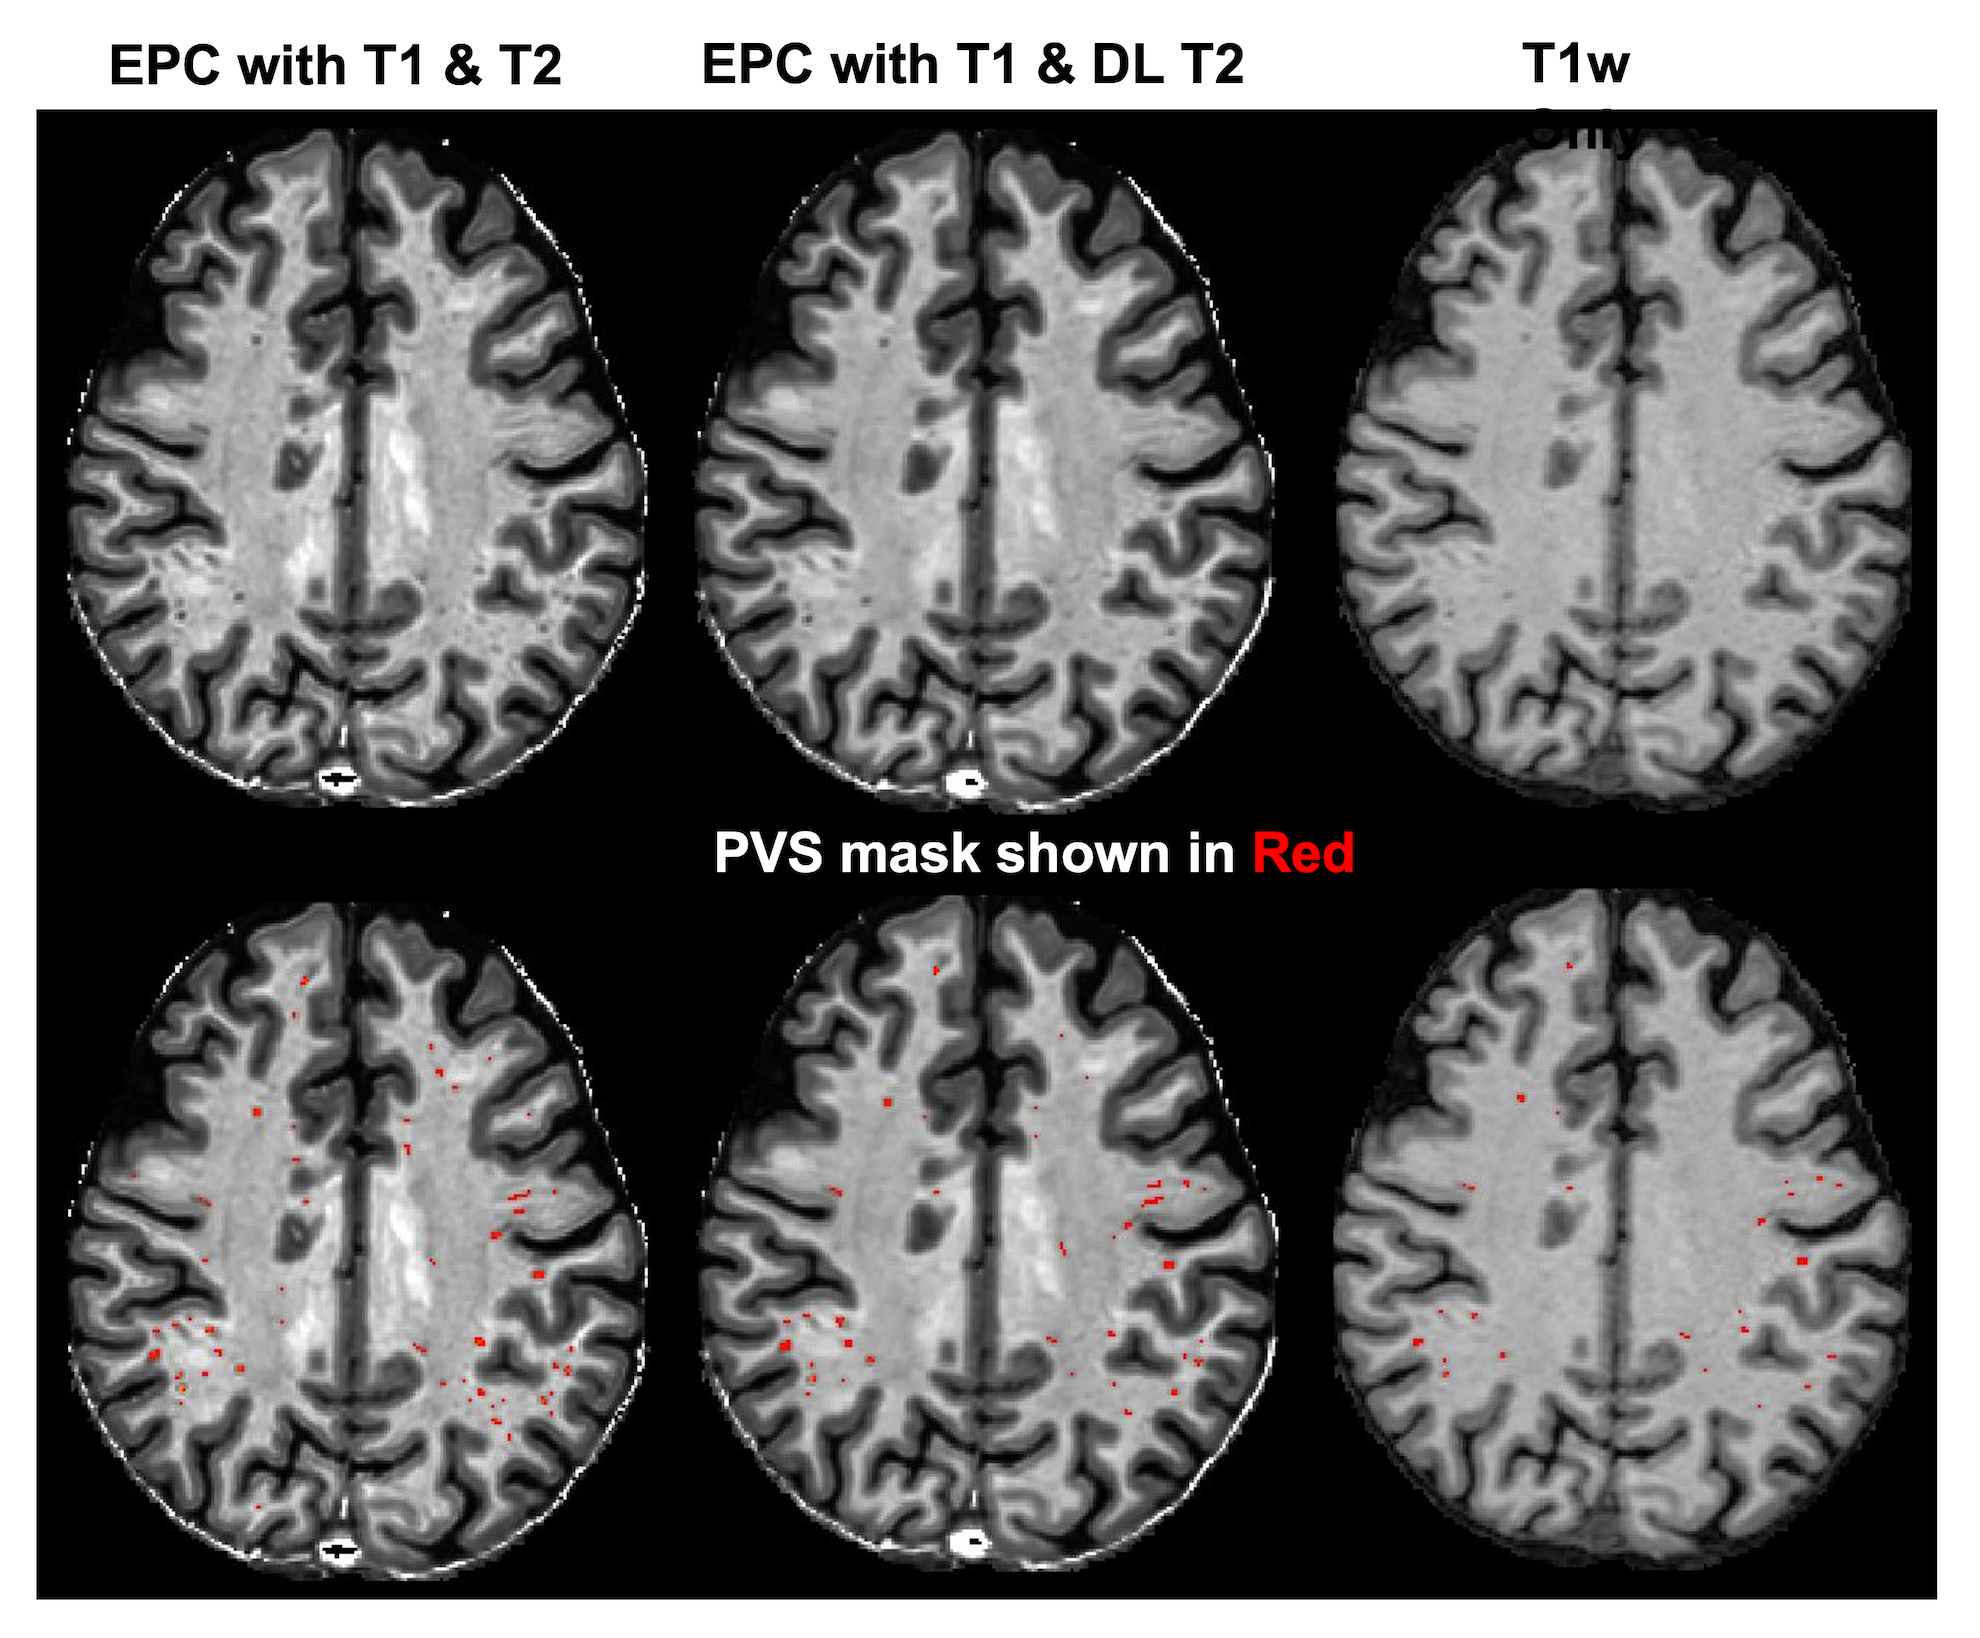
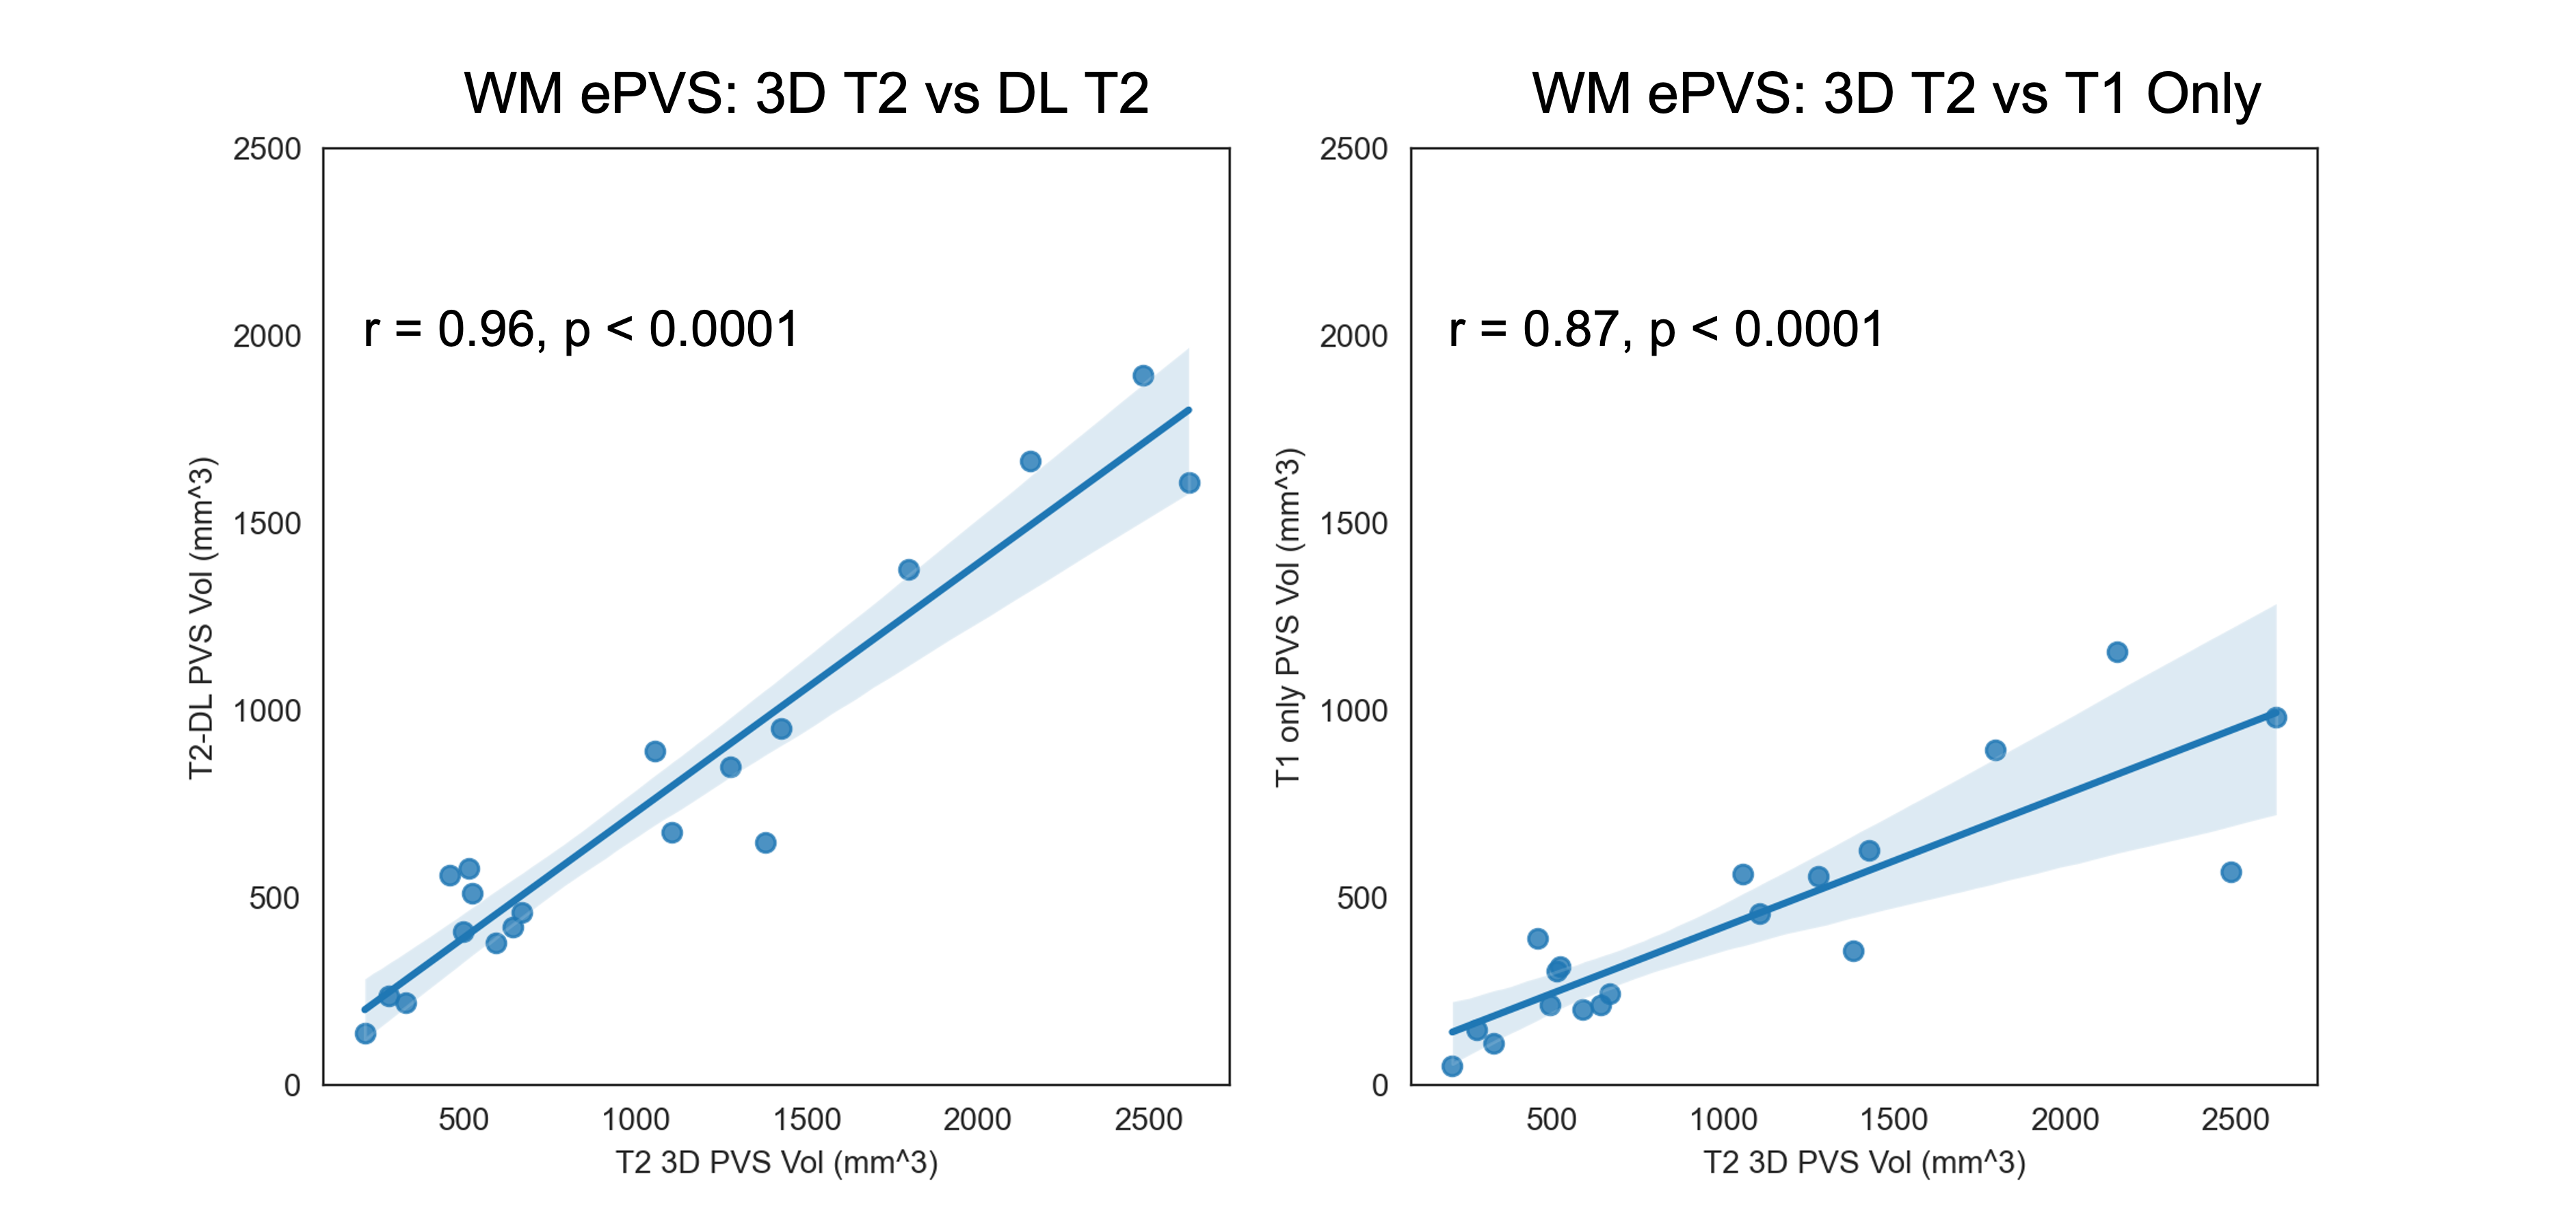
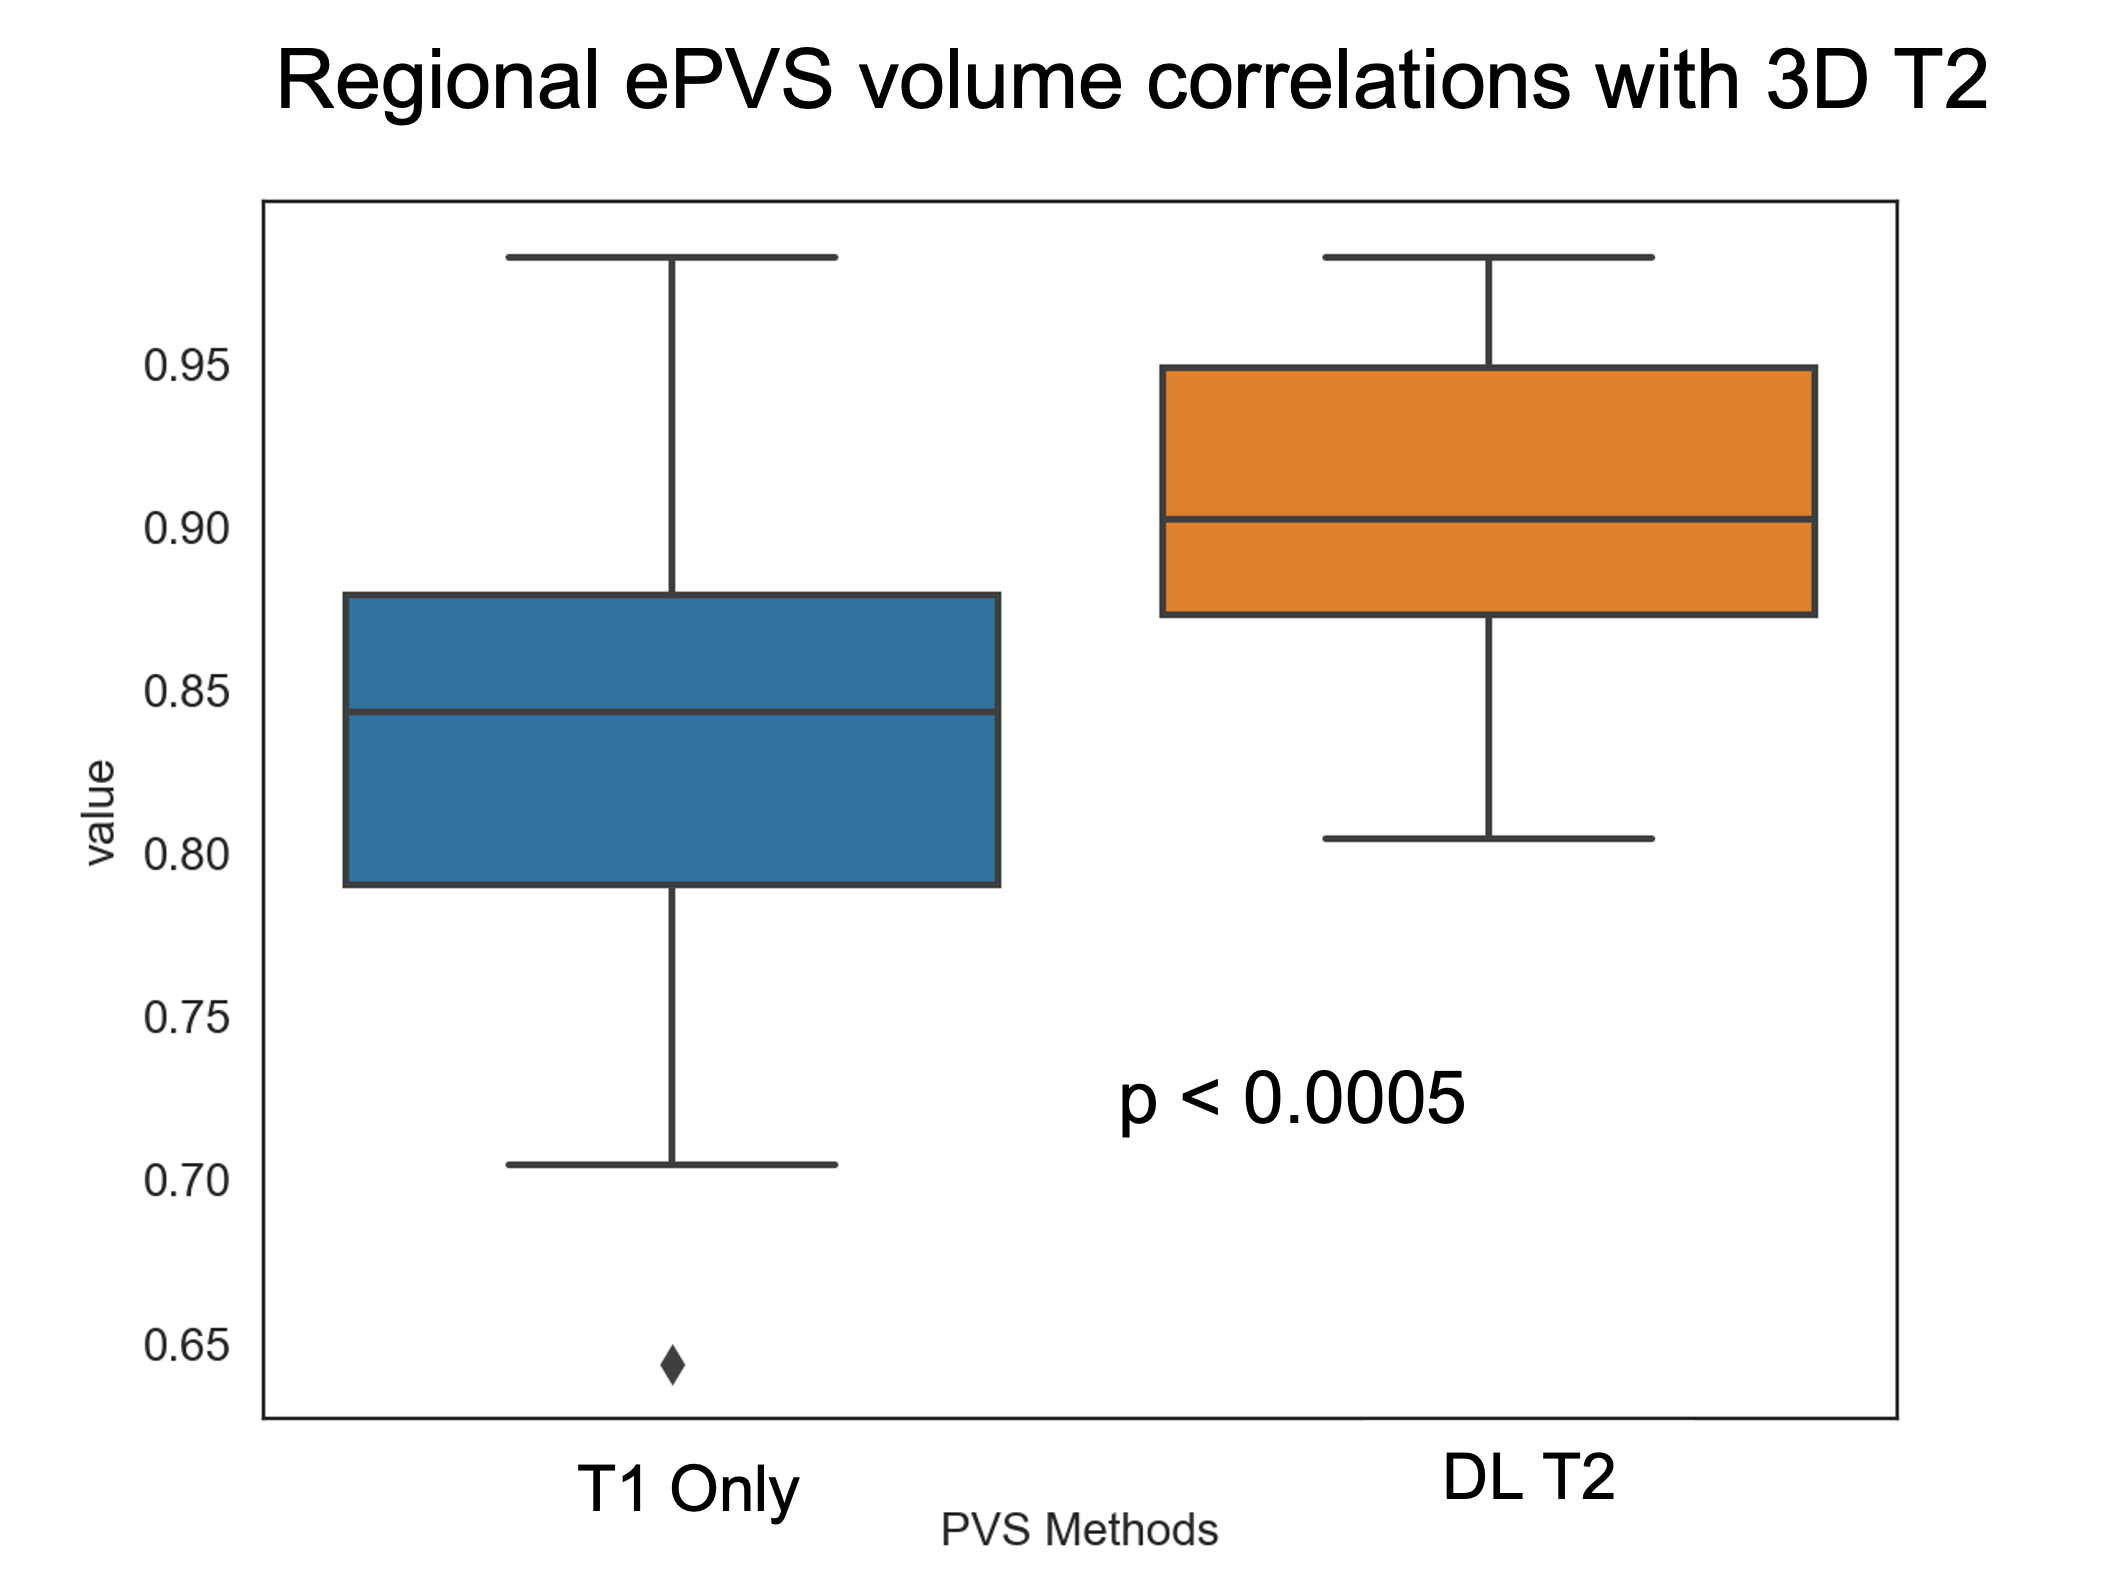
Figure 2 shows the deep learning results from a testing subject. The DL T2 is highly similar to the target 3D T2 images, with errors mostly appear at tissue interfaces. Although a bit smoothed, the DL T2 did show many small ePVS regions (red arrows in Figure 2) that are otherwise non-remarkable on the FLAIR images. Figure 3 shows the enhanced PVS contrast images which is roughly of T1/T2 contrast and the automatically segmented ePVS masks. The DL T2 provided enhanced PVS visualization than the T1w image only, and a more comparable ePVS segmentation results. Figure 4 shows the calculated total ePVS volume within whole brain white matter for DL T2 and T1 only, as compared to the 3D T2. DL T2 ePVS volumes was strongly correlated with the ground truth values from 3D T2 (r = 0.96) and is more advantageous than using the T1w volume only (r = 0.87). Figure 5 shows the boxplot of correlation coefficients of regional ePVS volumes using different methods vs. values calculated with 3D T2. The correlation coefficient using the DL T2 method is significantly higher than the T1 only case.Discussion
Automatic ePVS quantification needs minimally a high-resolution 3D T1w volume but is much enhanced if high-resolution 3D T2w volume is also available to derive an enhanced PVS contrast (EPC) image. In this study, we show that in the case of missing T2w volume, the T1w and FLAIR images can be used to synthesize T2w volume with deep learning. The DL T2 volume provides comparable ePVS estimation as a 3D T2 volume, as compared to with T1w images only. Future work will include incorporating the white matter hyper-intensity abnormalities from the FLAIR images in more robust ePVS quantification.Acknowledgements
The study was conducted at University of Maryland School of Medicine Center for Innovative Biomedical Resources, Translational Research in Imaging @ Maryland (CTRIM) – Baltimore, Maryland. The study is supported by NIH under grant 5R01NS105503. We thank Dr. Sepehrband for providing us with the PVS quantification tools.References
[1] Paradise M, Crawford JD, Lam BCP, Wen W, Kochan NA, Makkar S, Dawes L, Trollor J, Draper B, Brodaty H, Sachdev PS. Association of Dilated Perivascular Spaces With Cognitive Decline and Incident Dementia. Neurology. 2021 Mar 16;96(11):e1501-e1511.
[2] Javierre-Petit C, Schneider JA, Kapasi A, Makkinejad N, Tamhane AA, Leurgans SE, Mehta RI, Barnes LL, Bennett DA, Arfanakis K. Neuropathologic and Cognitive Correlates of Enlarged Perivascular Spaces in a Community-Based Cohort of Older Adults. Stroke. 2020 Sep;51(9):2825-2833.
[3] Boespflug EL, Simon MJ, Leonard E, et al. Targeted Assessment of Enlargement of the Perivascular Space in Alzheimer's Disease and Vascular Dementia Subtypes Implicates Astroglial Involvement Specific to Alzheimer's Disease. J Alzheimers Dis. 2018;66(4):1587-1597. doi:10.3233/JAD-180367.
[4] Granberg, T., Moridi, T., Brand, J.S. et al. Enlarged perivascular spaces in multiple sclerosis on magnetic resonance imaging: a systematic review and meta-analysis. J Neurol 267, 3199–3212 (2020).
[5] Sepehrband, F., Barisano, G., Sheikh-Bahaei, N. et al. Image processing approaches to enhance perivascular space visibility and quantification using MRI. Sci Rep 9, 12351 (2019).
[6] C. Zhao, A. Carass, J. Lee, Y. He, and J. L. Prince, “Whole Brain Segmentation and Labeling from CT Using Synthetic MR Images,” in MICCAI MLMI, vol. 10541, pp. 291–298, 2017.
[7] Su P, Guo S, Roys S, Maier F, Bhat H, Melhem ER, Gandhi D, Gullapalli RP, Zhuo J. Transcranial MR Imaging-Guided Focused Ultrasound Interventions Using Deep Learning Synthesized CT. AJNR Am J Neuroradiol. 2020 Oct;41(10):1841-1848.
[8] Glasser MF, Sotiropoulos SN, Wilson JA, Coalson TS, Fischl B, Andersson JL, Xu J, Jbabdi S, Webster M, Polimeni JR, Van Essen DC, Jenkinson M; WU-Minn HCP Consortium. The minimal preprocessing pipelines for the Human Connectome Project. Neuroimage. 2013 Oct 15;80:105-24.
[9] Tustison NJ, Avants BB, Cook PA, et al. N4ITK: improved N3 bias correction. IEEE Trans Med Imaging. 2010;29(6):1310-1320. doi:10.1109/TMI.2010.2046908.
[10] Cabeen, R. P., Laidlaw, D. H., and Toga, A. W. (2018). Quantitative Imaging Toolkit: Software for Interactive 3D Visualization, Data Exploration, and Computational Analysis of Neuroimaging Datasets. Proceedings of the ISMRM, 2854.
[11] Ronneberger O, Fischer P, Brox T. U-net: Convolutional networks for biomedical image segmentation. In: International Conference on Medical Image Computing and Computer-Assisted Intervention Cham, Switzerland: Springer; 2015;234–241
Figures