3463
1H-MRS and machine learning for predicting voxel-wise histopathology of tumor cells in newly-diagnosed glioma patients1Radiology & Biomedical Imaging, University of California, San Francisco, SAN FRANCISCO, CA, United States, 2Neurological Surgery, University of California, San Francisco, SAN FRANCISCO, CA, United States
Synopsis
Using spectrum obtained at the spatial location of 549 tissue samples from 261 newly diagnosed patients with glioma, we trained and tested an support vector regression (SVR) model on individual metabolites, and a 1D-CNN model on the whole spectrum, to predict tumor biology such as cellularity, Ki-67, and tumor aggressiveness. A regression based 1D-CNN model using the entire spectrum pre-trained on a similar classification task outperformed the SVR model using metabolite peak heights.
INTRODUCTION
Gliomas are highly infiltrative, heterogenous brain tumors with varying overall survival based on molecular subtype and grade[1]. Currently, the gold standard for the diagnosis of tumors includes the histopathological and molecular evaluation of tissue samples randomly taken from the patients during surgery[2,3]. However, these samples contribute to a very small fraction of heterogeneous tumor tissue, neglecting to capture the statistical distribution of biological properties that would allow for accurate characterization of tumor biology throughout the whole lesion[2,3]. Having a spatial map of tumor aggressiveness based on underlying tumor metabolism can: 1)help guide the selection of tissue samples for more accurate diagnosis of heterogenous lesions, 2)potentially increase the extent of resection of these highly infiltrative lesions, and 3)non-invasively characterize tumor that remains after surgery to inform subsequent treatment.Previous studies have demonstrated the benefit of using Proton Magnetic Resonance Spectroscopy (1H-MRS) and the derived Choline-to-NAA index (CNI) in probing the underlying cellular metabolism associated with tumor growth and poor survival[4,5], and identifying IDH/TERT promoter mutation status using the entire spectrum[6,7]. The goal of this study was to develop a deep learning model that utilizes the wealth of information contained in the entire spectrum to predict voxel-wise histopathology of tumor cells, including tumor cellularity, mitotic activity (Ki67), and a composite tumor aggressiveness index (CTAI; defined as the sum of normalized cellularity and Ki67) using tissue samples with spatially-mapped coordinates on 3D 1H-MRSI.
METHODS
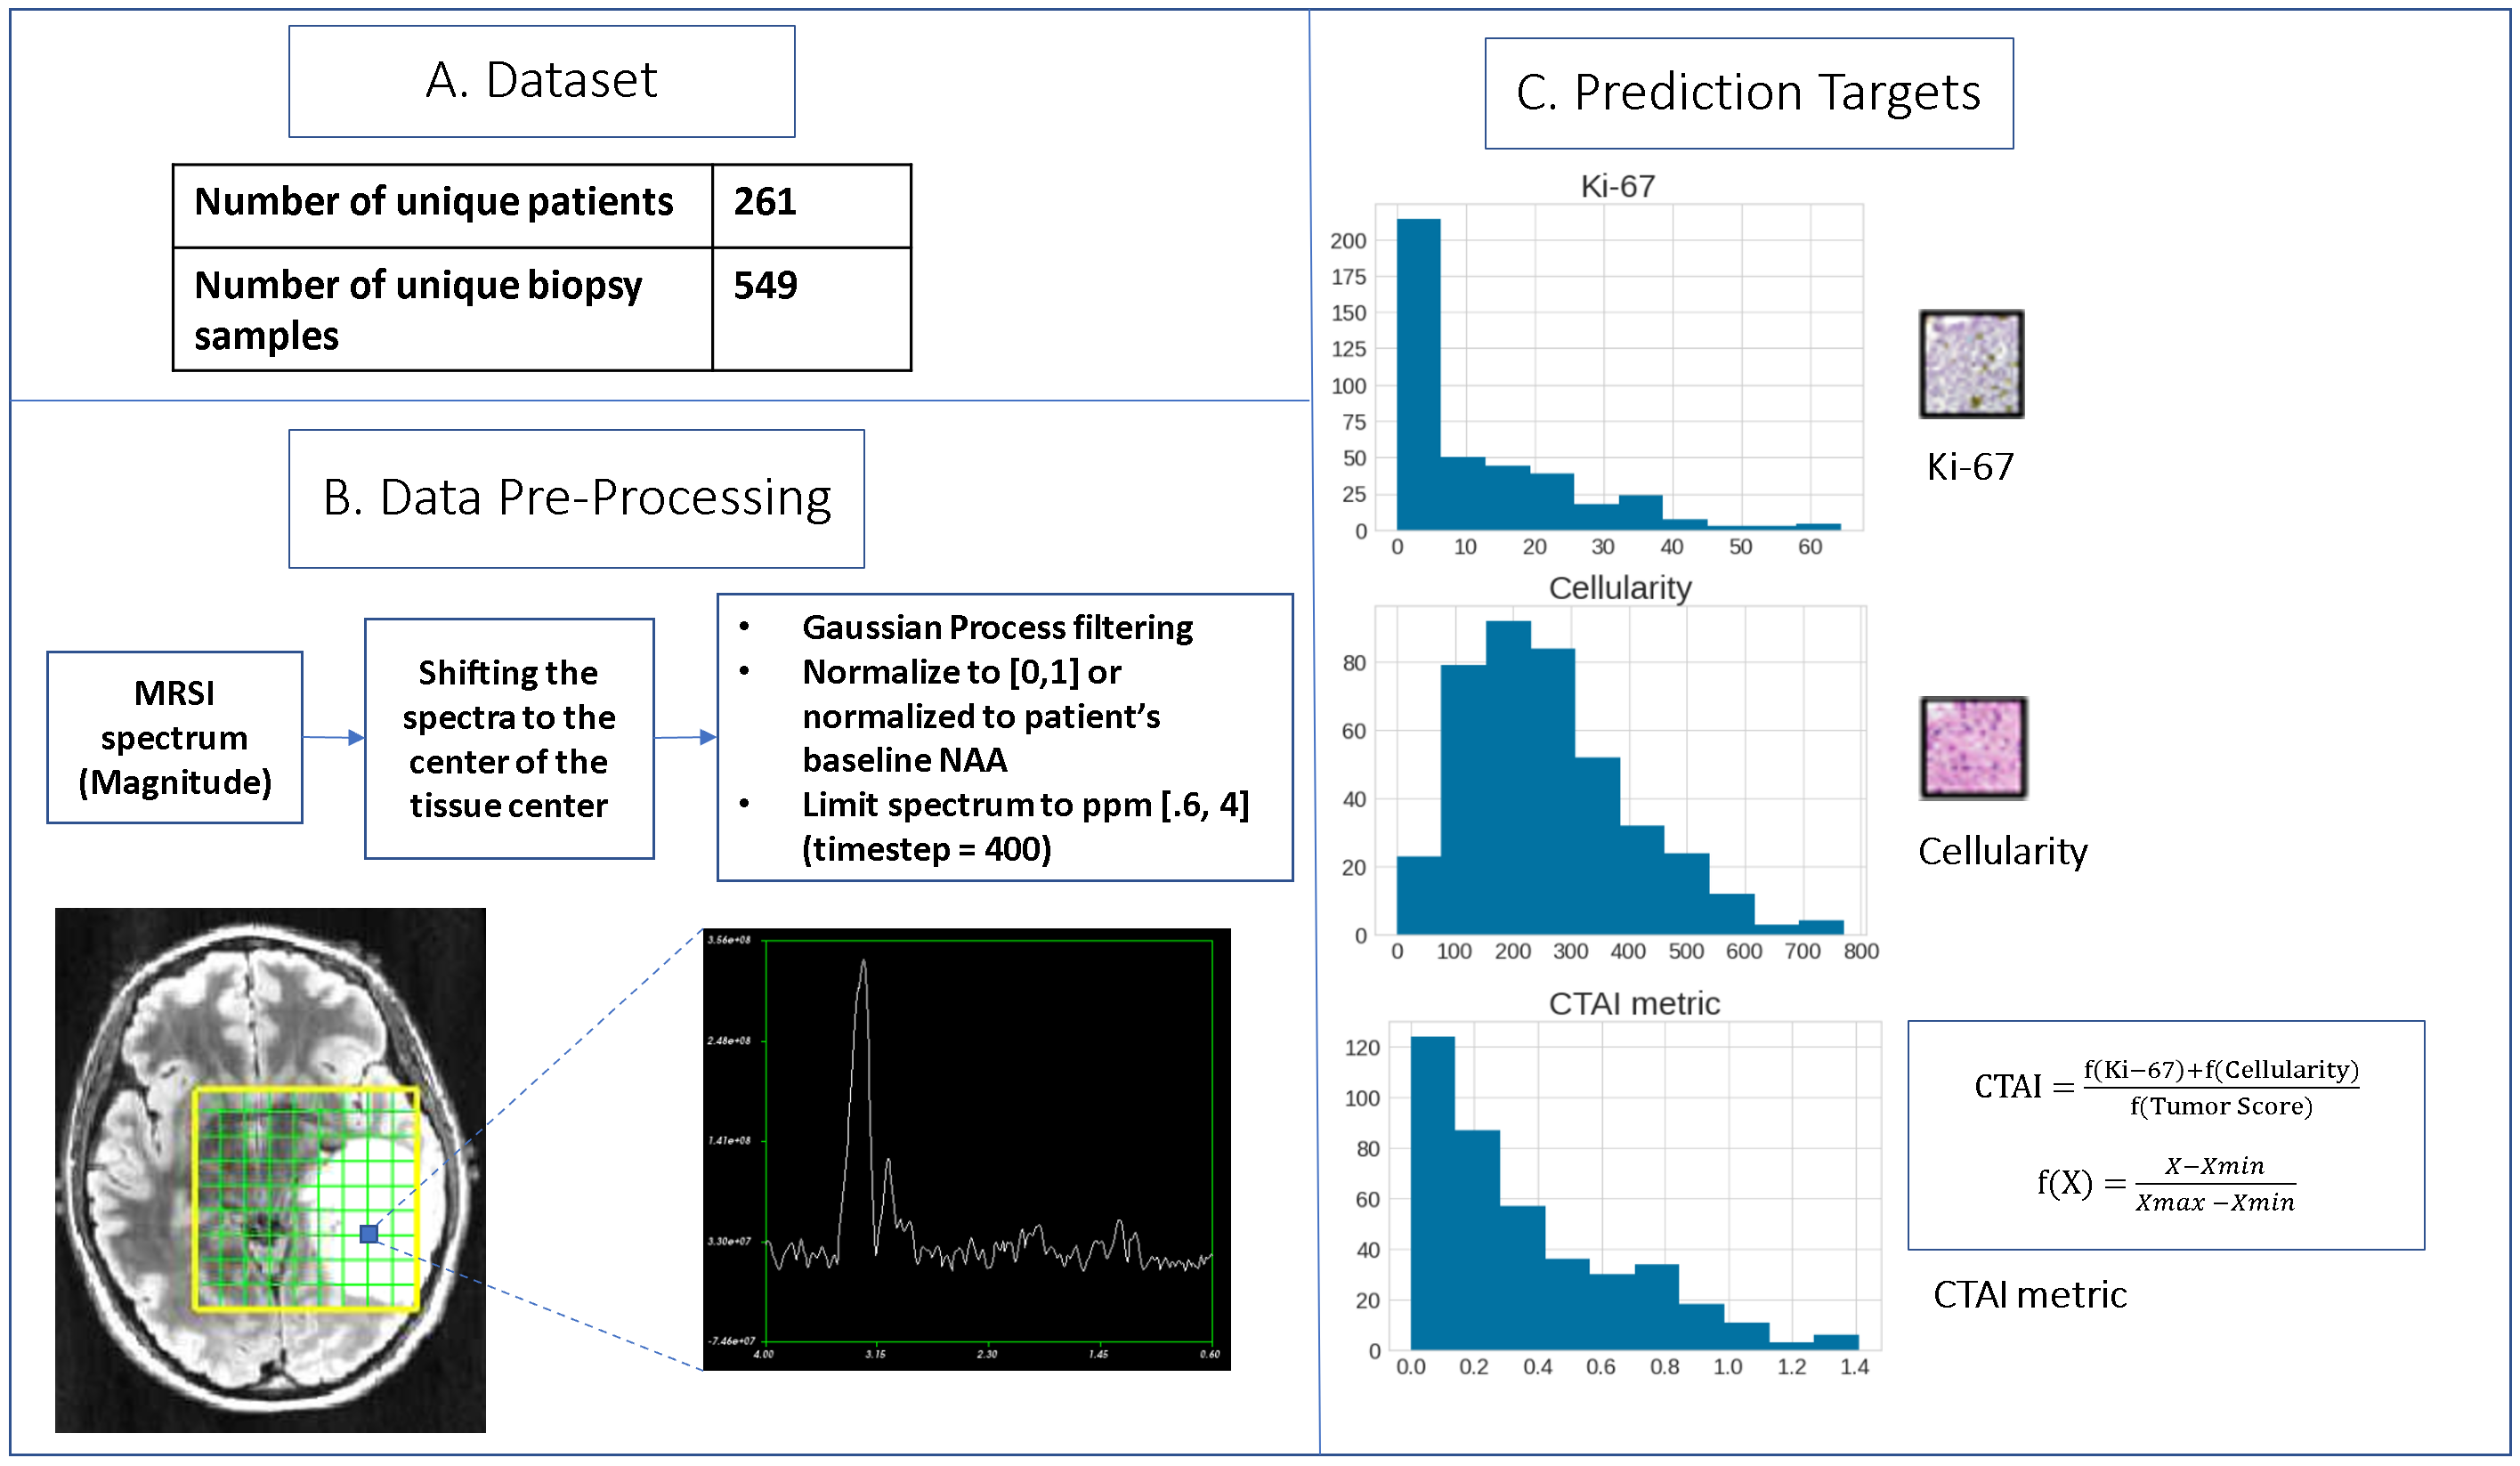
Patients & Samples: 549 unique biopsy samples from 261 newly diagnosed glioblastoma patients are included. For each tissue sample, a maximal labeling index for MIB-1-positive nuclei (that represents Ki-67) and total cellularity have been calculated from at least three fields and >1000 cells. These samples also have a tumor score (0-3) assigned based on the contribution of tumor to the total. CTAI is calculated as the sum of the normalized Ki-67 and cellularity multiplied by normalized tumor score. Distribution of these indices are summarized in Figure 1C.Image Acquisition: Lactate-edited 3D 1H-MRSI were acquired using PRESS for volume localization and VSS pulses for lipid-signal-suppression [excited volume=80×80×40mm, TR=1100-1250ms, TE=144ms, overpress-factor=1.5, nominal voxel size=1×1×1cm], flyback-echo-planar readout gradient in the SI direction, 988 Hz sweepwidth, and 712 dwell-points.
Processing: To generate a single spectrum centered at the location of each tissue sample, 3D spectral arrays were first shifted in k-space to reconstruct a spectral voxel on the center coordinates of each tissue sample location. Preprocessing of 1D spectrum centered at the tissue sample included smoothing following by min-max normalization (Figure 1). Normalized metabolite peak heights and CNI were also quantified for each tissue sample location.
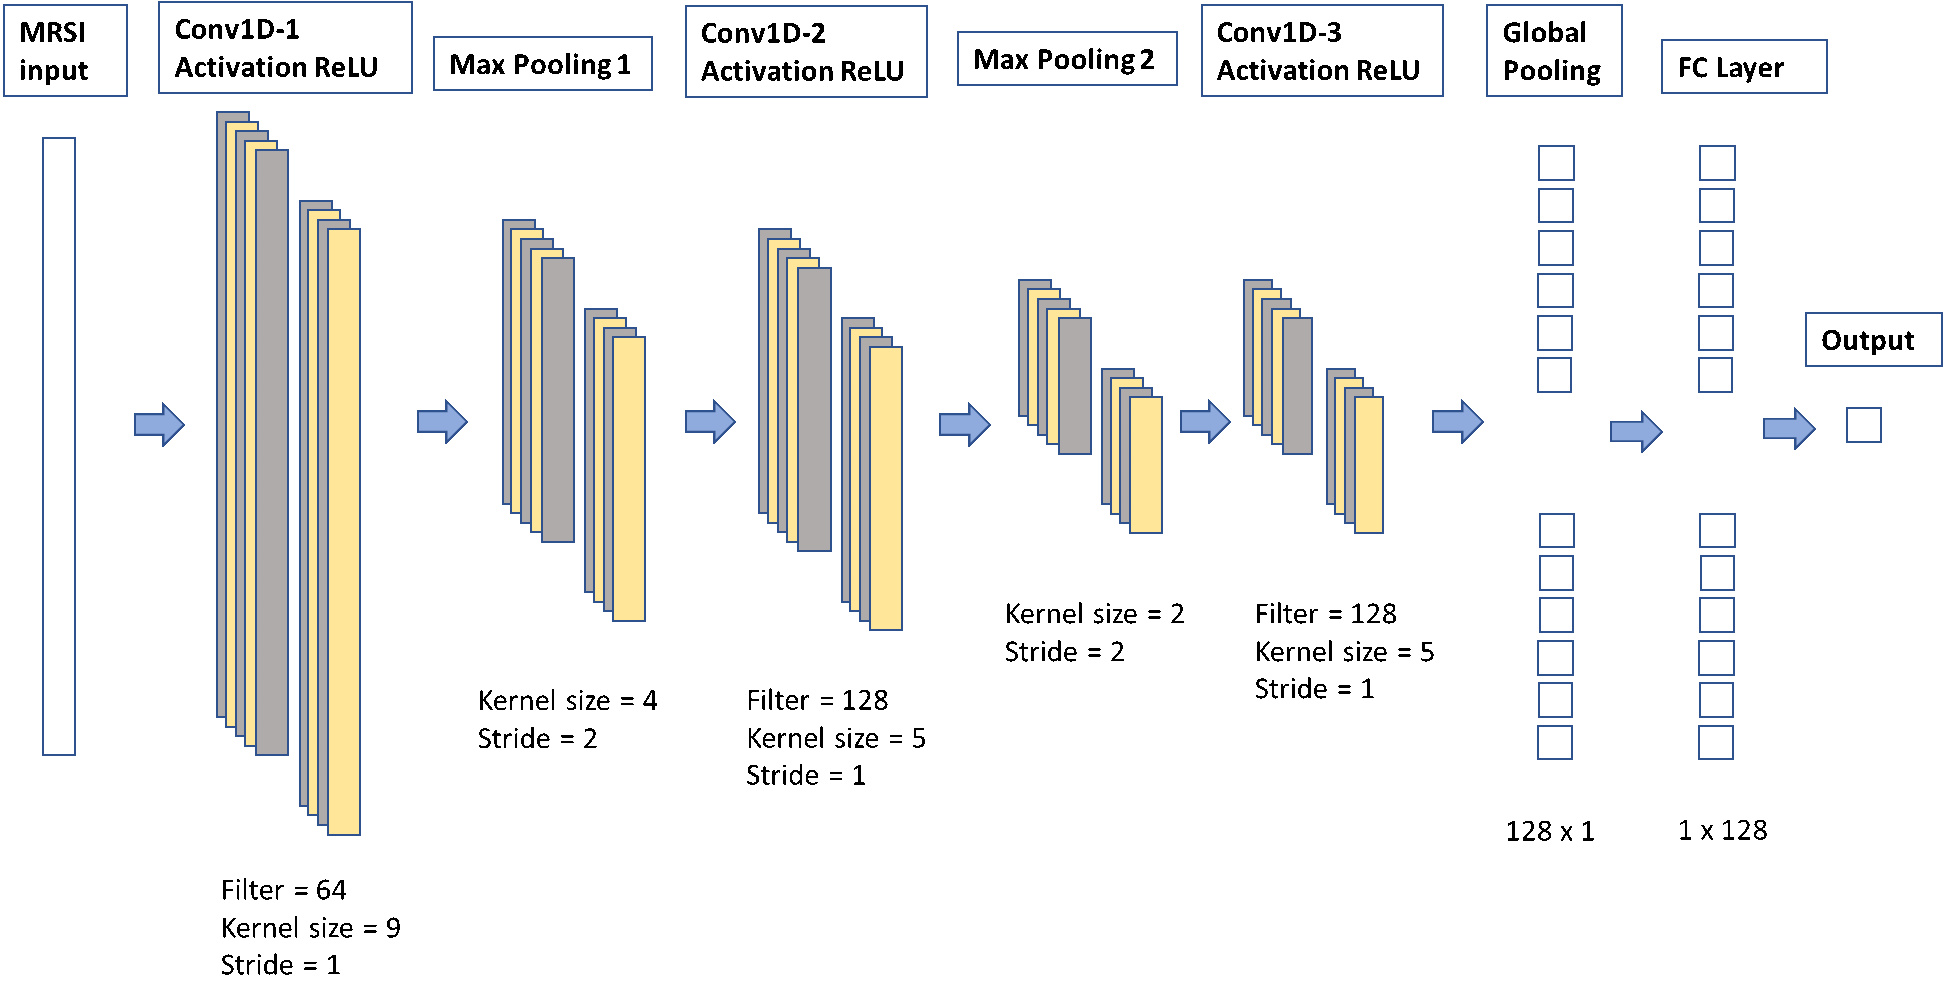
Statistical Analysis and Machine Learning: The dataset was split by patient into 370 training, 80 validation, and 99 test samples. Correlation between each 1H-MRS parameter and the prediction targets of the training set were calculated using the Spearman’s correlation coefficient. A Support Vector Regression (SVR) model using only individual normalized metabolite levels and CNI as inputs, followed by a 1D-CNN model (Figure 2) using the entire spectrum as input were trained to predict cellularity, Ki-67, and CTAI. Transfer learning by first training a 1D-CNN classification model to predict the ordinal target, created by binning Ki-67, cellularity, and CTAI into 6 groups, and then finetuning the regression task using each original target of interest, was also employed. Synthetic Minority Oversampling Technique (SMOTE) was used to deal with the imbalance dataset. MSE/MAE/R2 were calculated to compare the performance of all models.
RESULTS & DISCUSSION
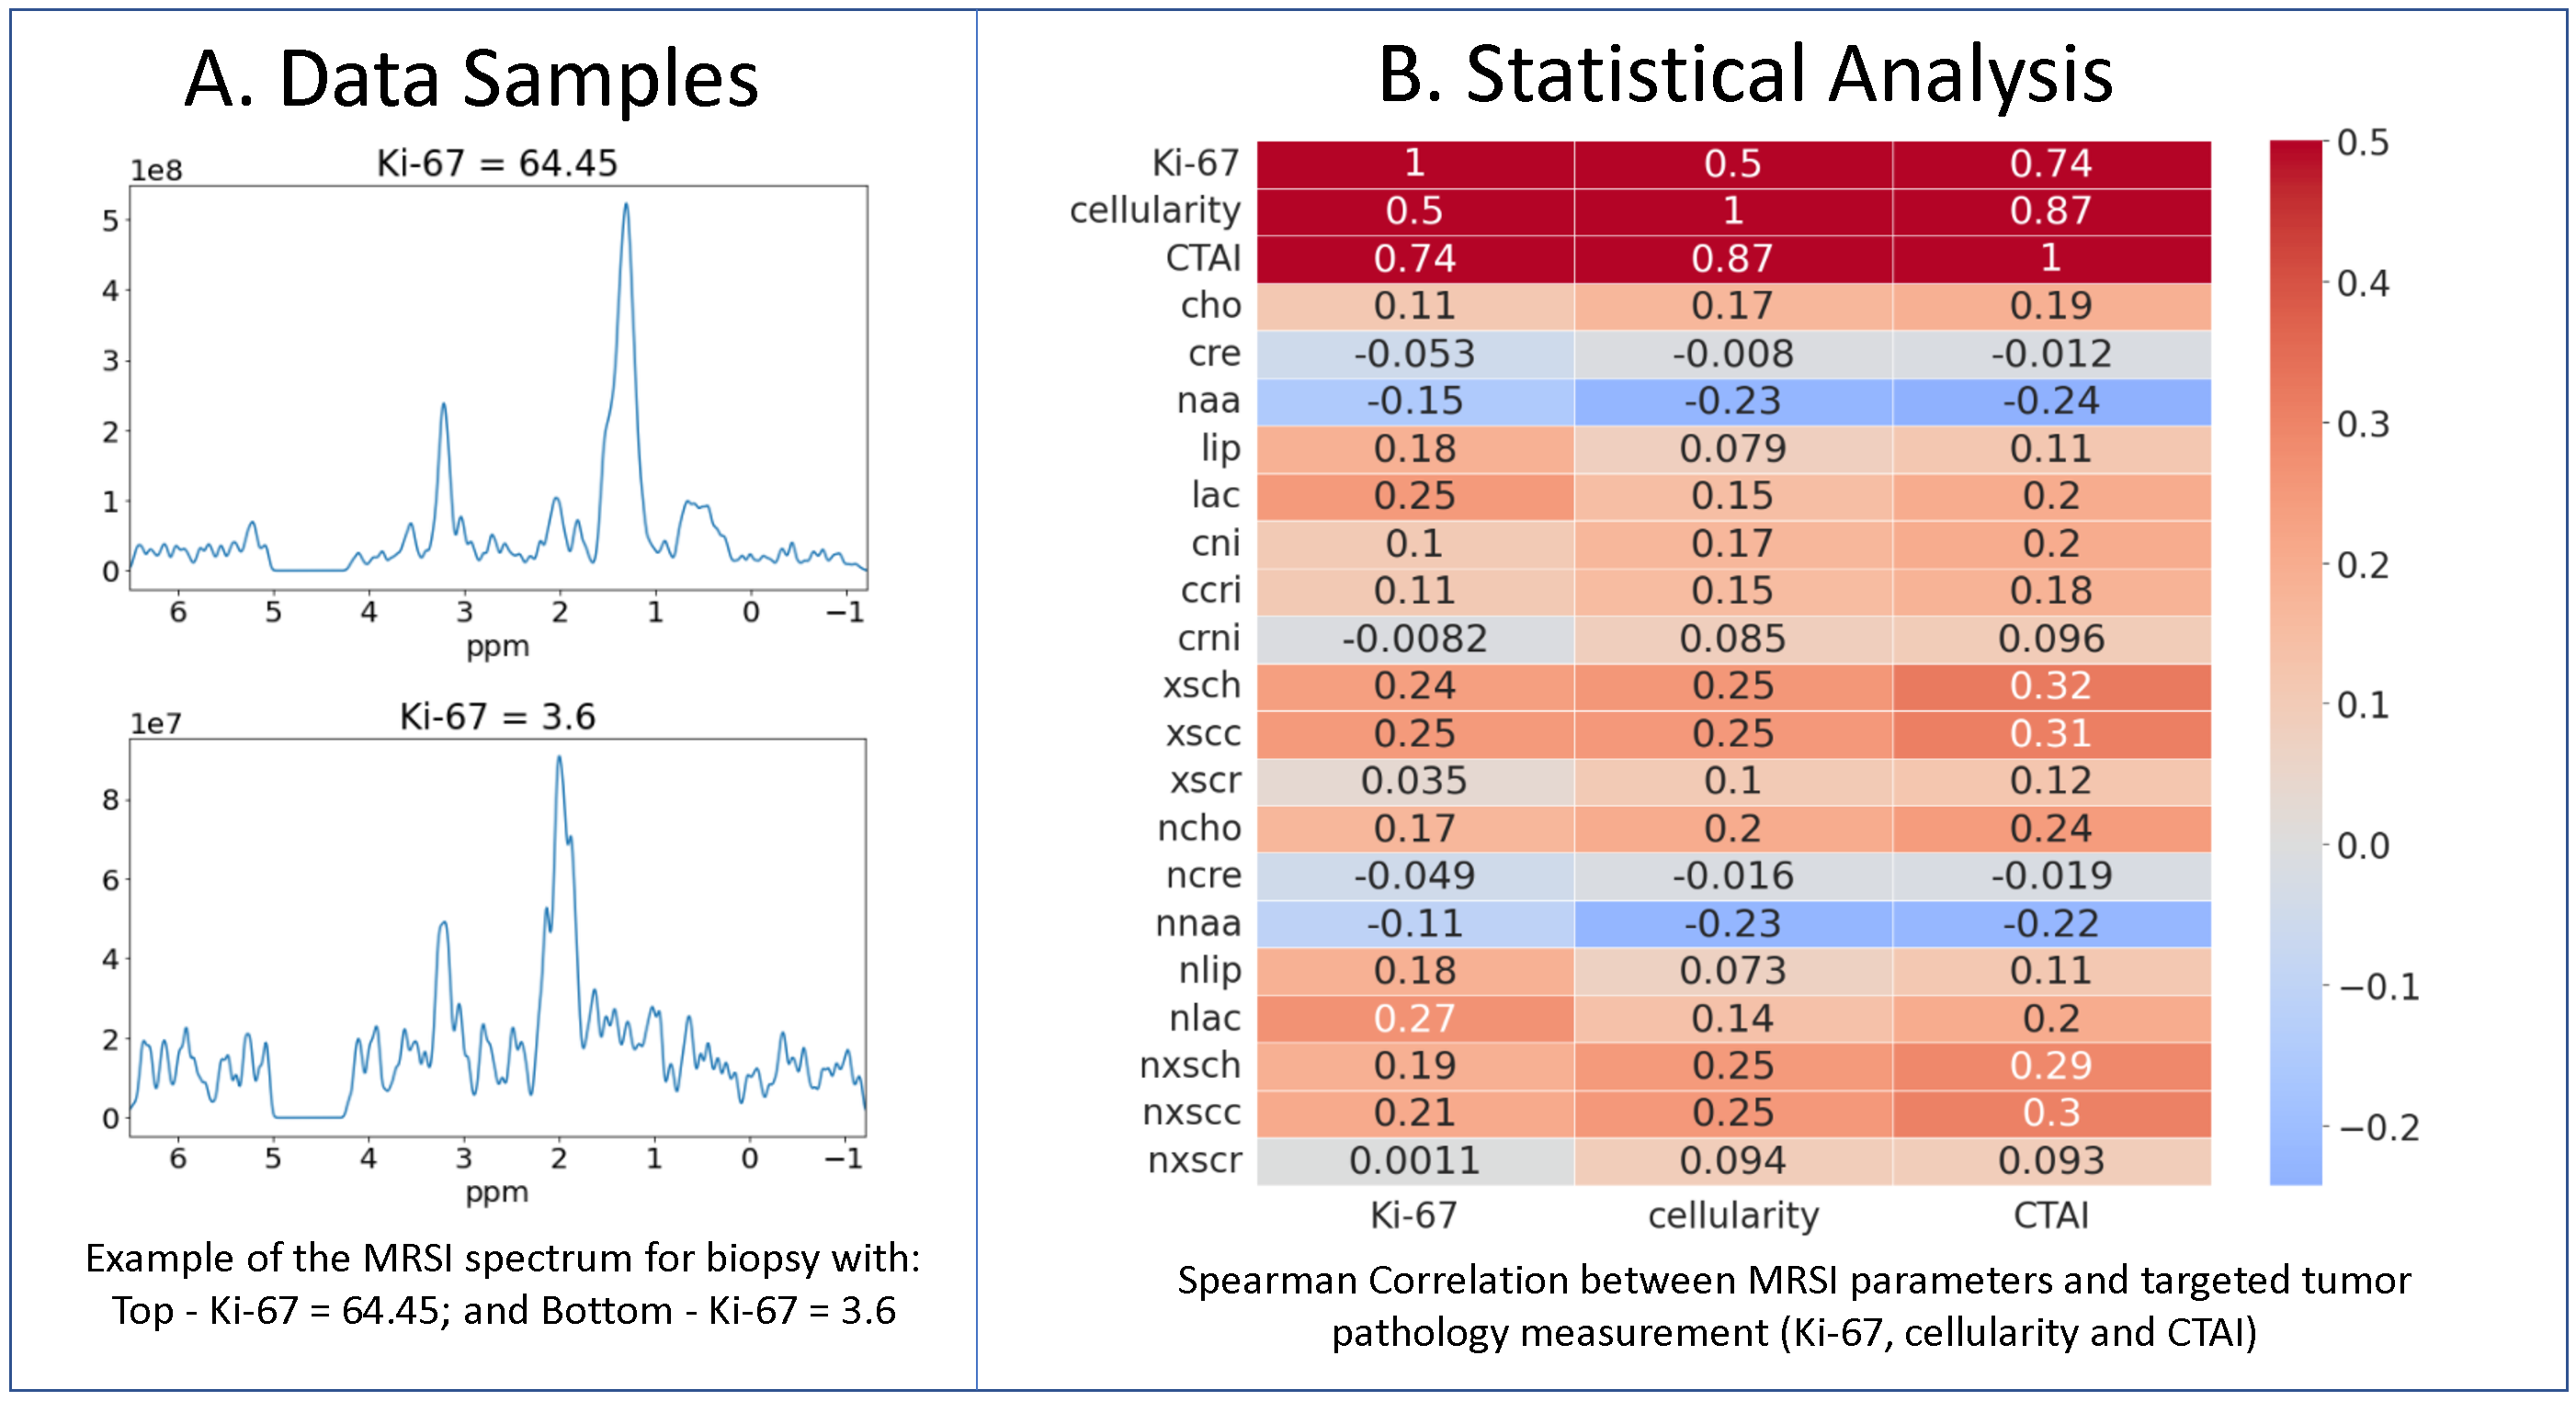
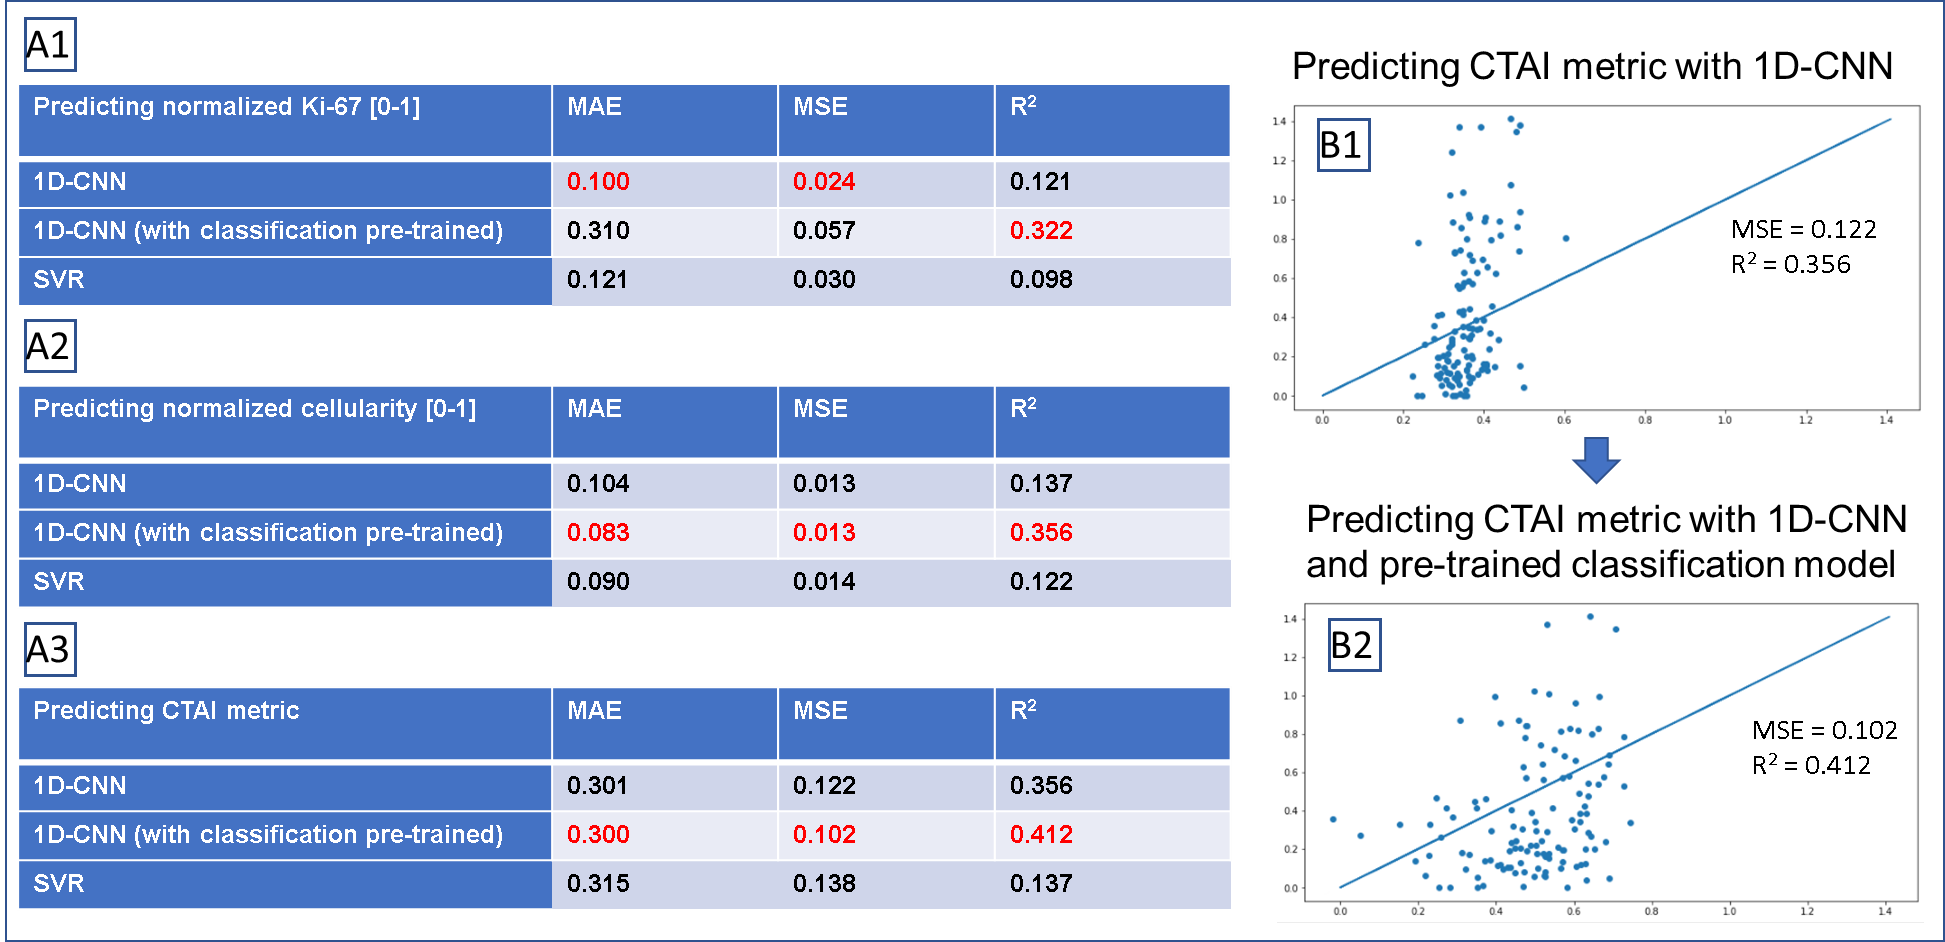
Figure 3A shows example spectra from a biopsy sample with high Ki-67 (64.45) and one with low Ki-67 (3.6). Sample with high Ki-67 tends to have elevated absolute choline and lactate, and lower NAA. The Spearman’s correlation between the 1H-MRS parameters and the pathological targets (Ki-67, cellularity, and CTAI) are shown in figure 2B. Lactate, lipid, excess choline, and excess creatine are most relevant in predicting both Ki-67, cellularity, and CTAI, while CNI is only relevant in predicting cellularity and CTAI.Figure 4A show the performance of both the SVR and the 1D-CNN model. Overall, none of our models perform particularly well in predicting the normalized Ki-67 (MIB) score. Our best model, a 1D-CNN, achieves an MAE within 10% of the range of the targets. The 1D-CNN model works better at predicting cellularity and CTAI than the SVR, likely because the input of the 1D-CNN retains information from the entire spectrum that the SVR peak height model does not have knowledge of. Training a 1D-CNN classification model to predict the ordinal target followed by finetuning with the real target drastically improved performance (Figure 4B), likely because the model focusing on the majority of Ki-67 values that were 0-10, with cellularity ranging from 100-300. By first training a classification model, the model weights could be initialized correctly, improving performance.
CONCLUSION
Our work highlights the potential of using machine learning with 1H-MRS data, both from quantified peak heights and the full 1D spectrum, for predicting tumor biology from tissue samples. Applying deep learning to the full spectrum can improve model performance, especially when first training a classification model and finetuning using a regression model. Current work is evaluating various types of data normalization and incorporating diffusion and perfusion weighted imaging into these models.Acknowledgements
NIH-NCI grant P01CA118816References
1. Ostrom QT, Bauchet L, Davis FG, et al. The epidemiology of glioma in adults: a “state of the science” review. Neuro Oncol. 2014;16(7):896-913
2. Elder JB, Huntoon K, Otero J, et al. Histologic findings associated with laser interstitial thermotherapy for glioblastoma multiforme. Diagn Pathol. 2019;14(1):19.
3. Bobholz SA, Lowman AK, Barrington A, et al. Radiomic Features of Multiparametric MRI Present Stable Associations With Analogous Histological Features in Patients With Brain Cancer. Tomography. 2020 Jun; 6(2): 160–169
4. Wen, Q.; Jalilian, L.; Lupo, J. M.; Li, Y.; Roy, R.; Molinaro, A. M.; Chang, S. M.; Prados, M.; Butowski, N.; Clarke, J.;Nelson, S. J.Translational Oncology2015,8, 446–455.
5. Essock-Burns, E.; Lupo, J. M.; Cha, S.; Polley, M.-y.; Butowski, N. a.; Chang, S. M.; Nelson, S. J.Neuro-oncology2011,13, 119–131
6. Eckel-Passow, J.E., et al., Glioma Groups Based on 1p/19q, IDH, and TERT Promoter Mutations in Tumors. N Engl J Med, 2015. 372(26): p. 2499-508.
7. Ogura, R., et al., Immunohistochemical proles of IDH1, MGMT and P53: practical signicance for prognostication of patients with diuse gliomas. Neuropathology, 2015. 35(4): p. 324-35.
Figures