3462
Deep CNNs with Physical Constraints for simultaneous Multi-tissue Segmentation and Multi-parameter Quantification (MSMQ-Net) of Knee1Department of Radiology, University of California, San Diego, San Diego, CA, United States, 2Department of Neurosciences, University of California, San Diego, San Diego, CA, United States, 3Radiology Service, Veterans Affairs San Diego Healthcare System, San Diego, CA, United States
Synopsis
In this study, we proposed end-to-end deep learning convolutional neural networks to perform simultaneous multi-tissue segmentation and multi-parameter quantification (MSMQ-Net) on the knee without and with physical constraints. The performance robustness of MSMQ-Net was also evaluated using reduced input magnetic resonance images. Results demonstrated the potential of MSMQ-Net for fast and accurate UTE-MRI analysis of the knee, a “whole-organ” approach which is impossible with conventional clinical MRI.
Synopsis
In this study, we proposed end-to-end deep learning convolutional neural networks to perform simultaneous multi-tissue segmentation and multi-parameter quantification (MSMQ-Net) on the knee without and with physical constraints. The performance robustness of MSMQ-Net was also evaluated using reduced input magnetic resonance images. Results demonstrated the potential of MSMQ-Net for fast and accurate UTE-MRI analysis of both short-T2 and long-T2 tissues in the knee, a “whole-organ” approach which is difficult with conventional clinical MRI.Introduction
Quantitative magnetic resonance imaging (MRI) is likely a more accurate approach than morphological MRI in evaluating underlying pathology and disease course. Osteoarthritis (OA) is now understood to be a “whole-organ” disease involving all the principal tissues of the joint1. It would be of great clinical value to simultaneously segment and quantify all major joint tissues accurately and effectively. While conventional clinical MRI sequences show little or no signal for many short-T2 tissues such as the deep cartilage, menisci and bone, ultrashort echo time (UTE) MRI techniques allow high resolution morphological and quantitative imaging of both short-T2 and long-T2 tissues in the joint2. The feasibility of deep convolutional neural networks (DCNNs) with physical constraints for simultaneous segmentation and T1 mapping of the whole knee joint based on UTE MRI has been shown3, and it would be highly desirable to develop these same techniques for automatic segmentation and mapping of panel of biomarkers (e.g., T1, T1rho, T2, T2*, magnetization transfer, etc.) of all major tissues in the whole joint using quantitative UTE MRI 4,5. Given that quantitative UTE MRI is quite time-consuming, it is critically important to generate robust multi-parameter mapping with reduced input images to accommodate a shorter scan time. In this study, we proposed end-to-end DCNNs for simultaneous multi-tissue segmentation and multi-parameters quantification (MSMQ-Net) of the knee (UTE T1 and T1rho) and evaluated the performance robustness of MSMQ-Net using reduced input MRI images.Methods
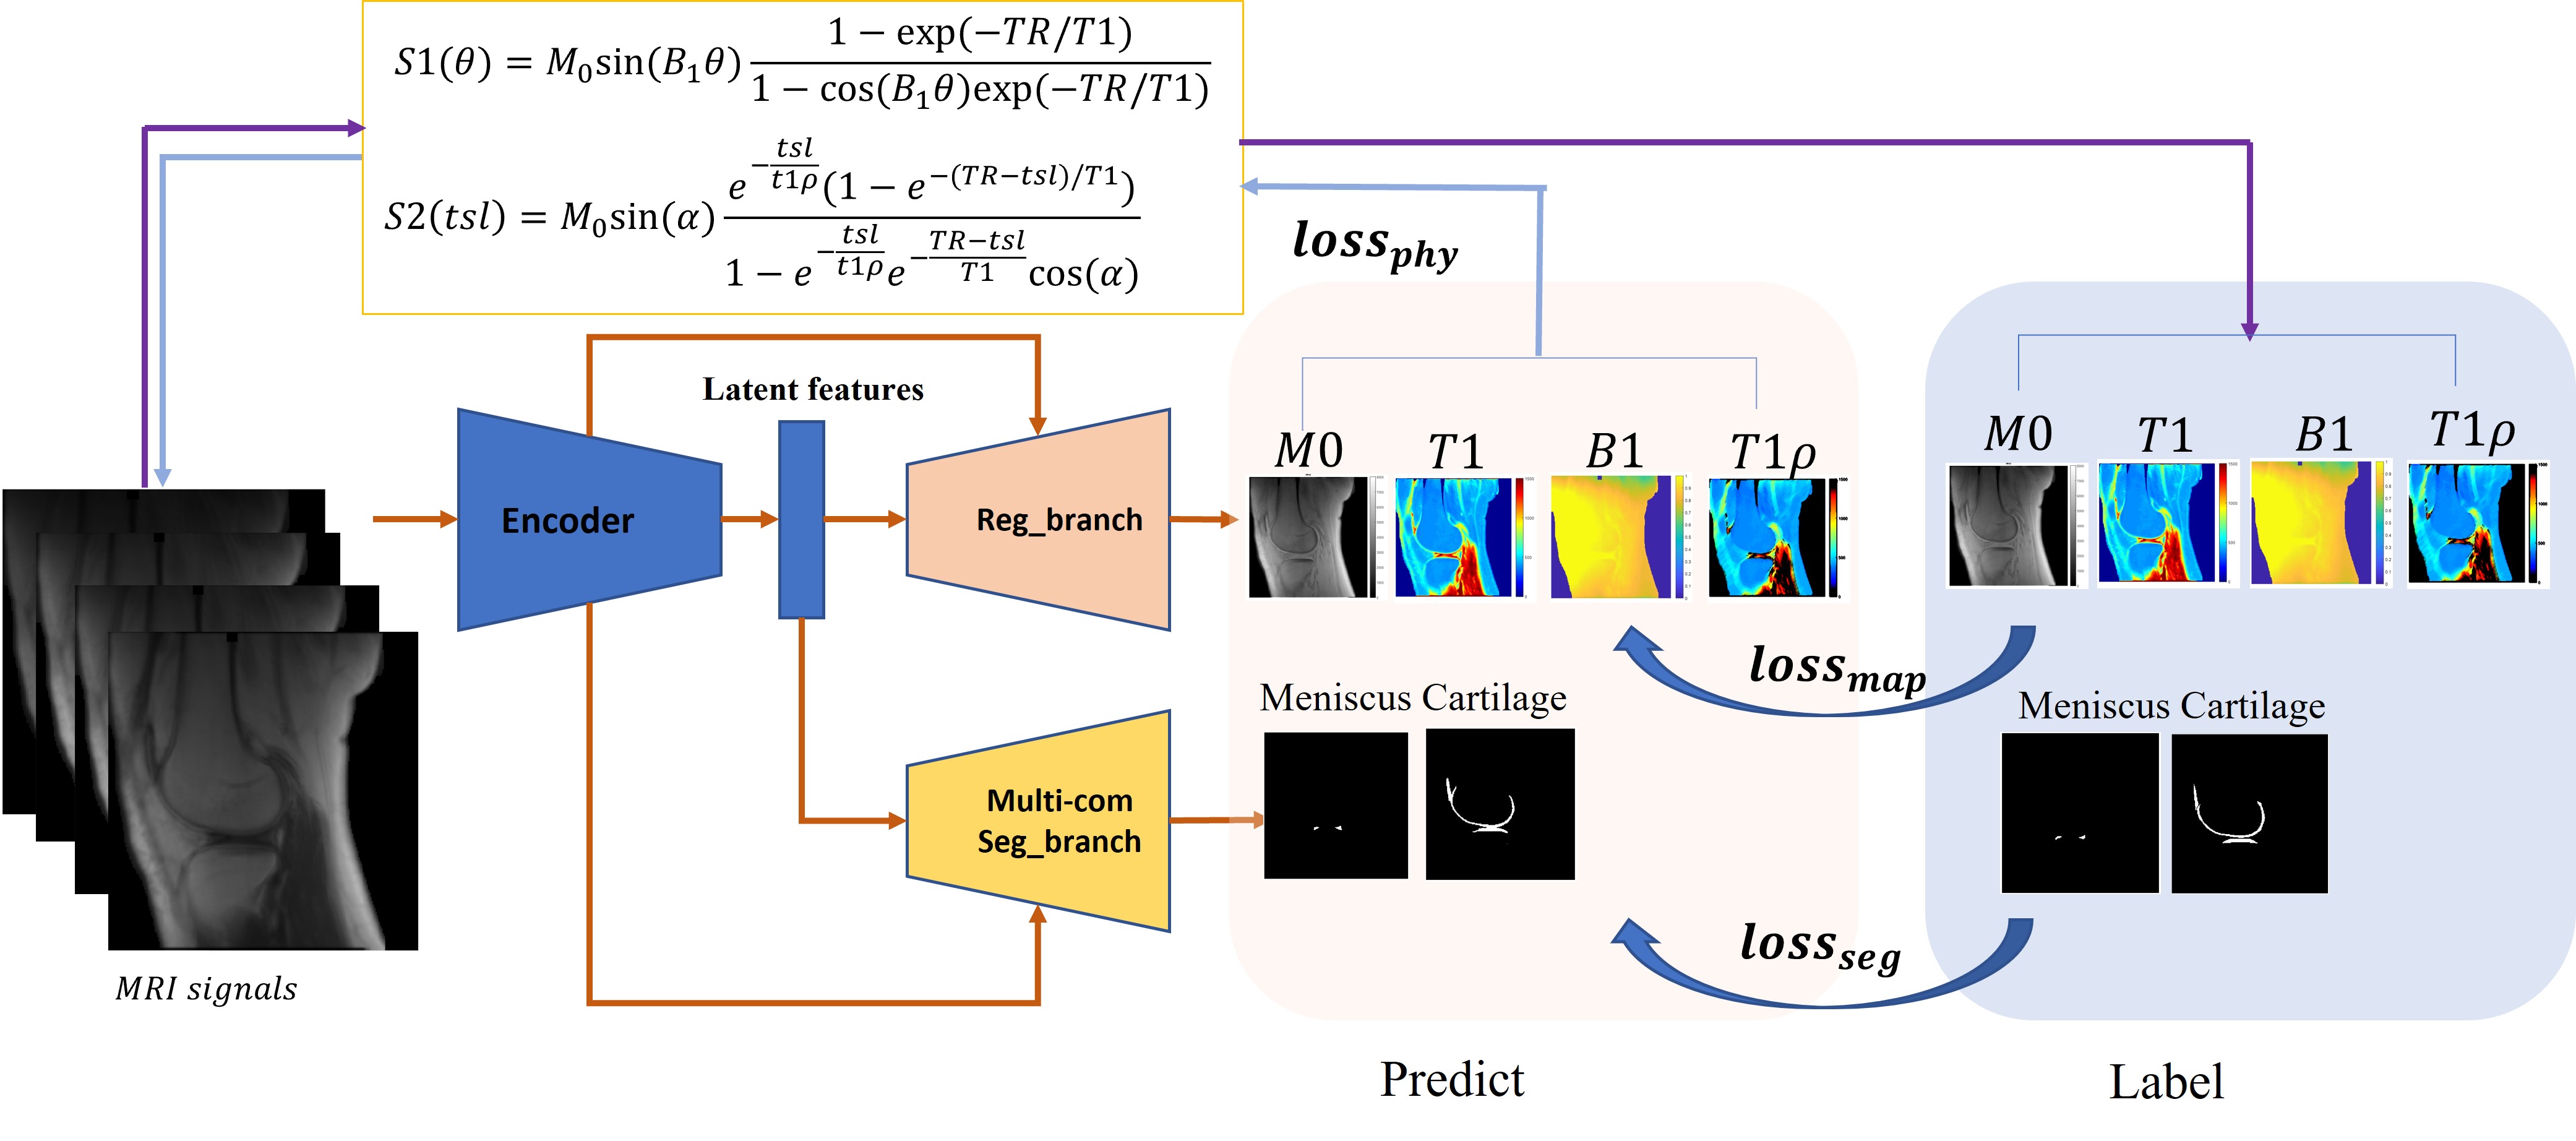
As shown in Figure 1, MSMQ-Net is like its predecessor in that it is also based on a U-Net style DCNN with two branches for outputs, namely Reg_branch and Seg_branch.The difference in this study is that we introduced T1rho parameter quantification to test the extendibility of the previous MSQ-net architecture. The loss function for the MSMQ-net is found in equations (1-4), S1 and S2 in equation (4) could be found in Figure 1.$$$loss_{MSMQ}=\gamma _{1}loss_{map}+\gamma _{2}loss_{seg}+\gamma _{3}loss_{phy}[1]\\ loss_{map}=l_{1}(Y,\hat{Y}),Y=\left [ M0,T1,B1,T1\rho \right ][2]\\ loss_{seg}=\lambda loss_{bce}+(1-\lambda)loss_{dice} [3] \\ loss_{phy}=l_{1}(S1,\hat{S1})+l_{1}(S2,\hat{S2}) [4]$$$
We validated the proposed method through T1 and T1rho mapping of both articular cartilage and menisci in the knee joint. Three-dimensional spiral sampling was performed with conical view ordering using a very short echo time (TE) of 32 μs, and flip anlges (FAs) of 5°, 10°, 20°, and 30°. For T1rho mapping, the scan parameters were flip angle=10°, and 7 spin-lock times (TSLs)=0, 12, 24, 36, 48, 72, 96ms. M0, T1, T1rho, and B1 maps were derived via non-linear fitting using the Levenberg‐Marquardt algorithm. ROIs for the cartilage and meniscus area were labeled with homemade Matlab code by three experienced radiologists.
A total of 1056 slice images from 44 subjects (including healthy volunteers and patients with different degrees of OA) was used for model training, and 144 images of six additional subjects were used for model validation. 144 extra images of six healthy subjects were used for model testing. The DCNNs were implemented with pytorch 1.1.0 on a workstation with a Nvidia GTX 1080 Ti (11 GB GPU memory).
In order to evaluate the effect of reduced input images, two MSMQ-Net models were trained: one with full data inputs (4 FAs and 7 TSLs) and the other with partial data inputs (2 FAs=5°, 10° and 3 TSLs=0, 12, 24ms) with the same datasets and hyper-parameters, including optimizer of Adam, learning rate from 0.001 with a cosine-annealing strategy, and epochs of 300.
Results and Discussion
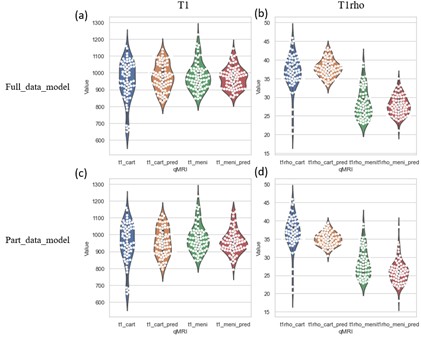
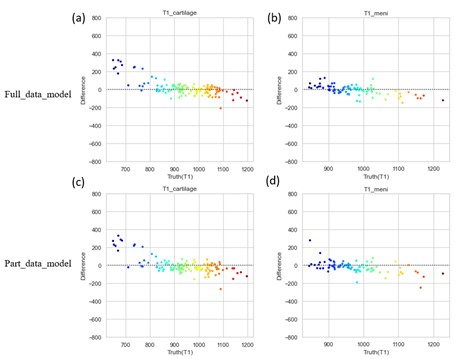
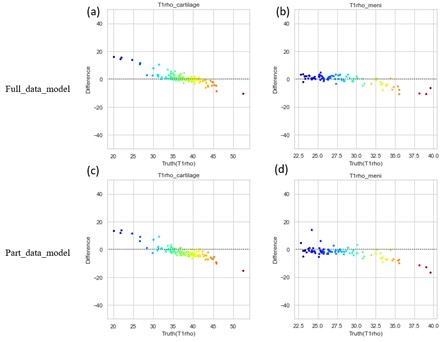
To compare the performance of the MSMQ-net with full_data or part_data for both T1 and T1rho mapping regression results, both violin distribution and Bland-Altman analysis were performed. Figure 2 shows the violin distributions of both T1 and T1rho values of the ROIs of both cartilage and meniscus for both the full data partial data models. It can be seen that both T1 and T1rho values of cartilage and meniscus distribution are similar for both full_data and part_data model outputs, compared to ground truth.Bland-Altman analysis was also performed for both full_data and part_data model prediction and the ground truth of both cartilage and meniscus regions. In Figure 3, All value distributions were similarly distributed around 0, with only a subtle difference between full_data and part_data models. Figure 4 demonstrates the Bland-Altman analysis for T1rho results, which were quite similar to the T1 values shown in Figure 3. Again, the T1rho results from both full_data and part_data model displayed similar patterns according to the Bland-Altman analysis.
Conclusion
In this study, MSMQ-net with both full_data training and part_data training were proposed for simultaneous multi-tissue segmentation and multi-parameter quantitative mapping (T1 and T1rho) of multiple knee joint tissues, including the cartilage and meniscus. Both models obtained reasonable ROI analysis results compared with results from experienced radiologists and similar Bland-Altman analyses were achieved.Acknowledgements
The authors acknowledge grant support from the NIH (R01AR062581, R01AR068987, R01AR075825, R01AR078877, and R21AR075851), Veterans Affairs (I01RX002604, I01CX002211 and I01CX001388), and GE Healthcare.References
1. Brandt KD, Radin EL, Dieppe PA, Putte L. Yet more evidence that osteoarthritis is not a cartilage disease (Editorial). Ann Rheum Dis 2006; 65:1261-1264.
2. Chang EY, Du J, Chung CB. UTE imaging in the musculoskeletal system. J Magn Reson Imaging 2015; 41(4):870-883.
3. Lu X, Ma YJ, Saeed J, Jang H, Xue YP, Zhang XD, Wu M, Gentili A, Hsu CN, Chang EY, Du J. Deep CNNs with Physical Constraints for simultaneous Multi-tissue Segmentation and Quantification (MSQ-Net) of Knee from UTE MRIs. ISMRM 2021.
4. Ma YJ, Lu X, Carl M, Zhu Y, Szeverenyi NM, Bydder GM, Chang EY, Du J. Accurate T1 mapping of short T2 tissues using a three-dimensional ultrashort echo time cones actual flip angle imaging-variable repetition time (3D UTE-Cones AFI-VTR) method. Magn Reson Med. 2018 Aug;80(2):598-608.
5. Ma YJ, Carl M, Searleman A, Lu X, Chang EY, Du J.3D adiabatic T1ρ prepared ultrashort echo time cones sequence for whole knee imaging. Magnetic resonance in medicine 80 (4), 1429-1439. 2018
Figures