3461
Mammography Lesion ROI Drawing Guided by Breast MRI MIP to Extract Features from Corresponding Lesions to Build Radiomics Diagnostic Models1Department of Radiological Sciences, University of California, Irvine, CA, United States, 2Department of Radiology, The First Affiliated Hospital of Wenzhou Medical University, Wenzhou, China, 3Department of Radiation Oncology, Rutgers-Cancer Institute of New Jersey, Robert Wood Johnson Medical School, New Brunswick, NJ, United States
Synopsis
268 patients with DCE-MRI and mammography were analyzed to evaluate the diagnostic performance of radiomics models. The dataset was split to 202 (146 malignant 56 benign) for training, and 66 (48 malignant 18 benign) for testing. The MIP of MR contrast enhancement maps was generated to simulate the CC and MLO view as guidance for manual ROI drawing on mammography. The models were built using features extracted by PyRadiomics. Combined MRI and mammography features can reach 89.6% accuracy in training and 83.3% in testing datasets, and the addition of mammography can improve specificity while maintaining high sensitivity of MRI.
Introduction
Mammography, ultrasound, and MRI are well-established diagnostic modalities for breast cancer, which are known to reveal different aspects of underlying abnormalities and provide complementary information for diagnosis [1,2]. DCE-MRI is essential for cancer development and progression, and it is included as a standard sequence in the clinical protocol. However, some benign diseases may show strong contrast enhancements and lead to a false positive diagnosis [3]. Mammography can detect breast cancer based on the presence of mass, microcalcifications, architectural distortion, or asymmetric density, and it may reveal different features in benign lesions to decrease false positives detected by MRI. Radiomics analysis allows for high-throughput extraction of quantitative features from radiographic images, and it has been shown as a feasible approach for diagnosis of breast cancer using mammography [4-7] and MRI [8-10]. However, the combined model using both imaging modalities was rarely reported. To ensure that the corresponding lesions from two modalities were analyzed, in this study we synthesized the CC and MLO view using maximum intensity projection (MIP) generated from contrast-enhanced MR images, and then used them as the reference for the lesion ROI drawing on mammogram. Features from MRI and mammography were extracted to build diagnostic models, and the performance of different models were compared to evaluate the added value of mammography to MRI.Methods
A total of 268 lesions were included, 202 (146 malignant and 56 benign) in the training set, and 66 (48 malignant and 18 benign) in the testing set. All patients had DCE-MRI (performed on a GE 3T scanner) and mammography (performed on a Fujifilm – AMULET Innovality system) within one month, and the diagnosis was confirmed by histopathology. DCE was acquired using the VIBRANT sequence with one pre-contrast (F1) and 5 post-contrast frames (F2-F6), and 90 seconds temporal resolution. Three parametric maps were generated: (F2-F1)/F1, (F3-F1)/F1, and (F6-F3)/F3. The tumor ROI on MRI was segmented using the fuzzy-C-means (FCM) clustering algorithm, and the features from the three maps were extracted using PyRadiomics. The subtraction images (F3-F1) were projected on the A-P direction and 45 degree to generate the equivalent CC and MLO views to guide the manual ROI drawing on mammogram. The features from the lesion ROI, and from a 2 cm band-shell by shrinking and expanding the boundary, were extracted. SVM was applied to select features and build the classification model with the Gaussian kernel. Five models were built based on: 1) DCE-MRI; 2) mammography – lesion ROI; 3) mammography – margin ROI, i.e., the bandshell; 4) mammography lesion+margin; and 5) all combined. The analysis flowchart is shown in Figure 1. In the training dataset, the evaluation was performed using 10-fold cross-validation, and then the developed model was applied to the testing dataset. The AUC obtained from the ROC curve and the final diagnostic prediction using the radiomics score (probability ≥ 0.5 as malignant) were reported and compared.Results
Figures 2 and 3 demonstrate the synthetic CC and MLO view of the lesion from the MIP generated using the contrast-enhanced MR maps. Figure 2 shows one benign case (fibroadenoma) which was not visible on mammogram, and one non-mass lesion without a clear boundary. The ROI drawing was performed twice, first without and then with the MRI as the guidance. The two drawings differ substantially with the Dice Similarity Coefficient (DSC) of 0.29 and 0.67. Figure 3 shows 2 mass cancer cases with a higher DSC of 0.73 and 0.86. The results support that using MRI MIP can guide the ROI drawing on mammogram to match the tumor correspondence on two modalities. Figure 4 shows the lesion on different frames of DCE-MRI and the three parametric maps, and the mammogram. The diagnostic results in the training and testing datasets are summarized in Table 1. In the training set, the accuracy was 83.2% for DCE-MRI, and 77.2% for mammography using both lesion and margin ROI. When all MRI and mammography features were combined, the accuracy was improved to 89.6%. By adding mammography features to MRI, the specificity was significantly improved from 69.6% (39/56) to 82.1% (46/56) (p<0.01), while sensitivity was also improved from 88.4% (129/146) to 92.5% (135/146). The results in the independent testing set were similar, slightly lower.Discussion
In this study, we developed the radiomics models for diagnosis of breast cancer using DCE-MRI alone, mammography alone, and the combined MRI and mammography. To better match the lesions, the MIP generated from contrast enhancement maps of MRI were used to simulate the CC and MLO view as guidance. We investigated the complementary role of MRI and mammography features in diagnostic sensitivity and specificity. In the training set, the combined model (89.6%) had a higher accuracy than individual ones (83.2% for mammography, 77.2% for mammography). When mammography features were added to MRI features, it could significantly improve specificity from 69.6% to 82.1%; and thus, have the potential to decrease unnecessary biopsy. Interestingly, the sensitivity was also improved, so the higher specificity was not at the expense of compromised sensitivity. The results demonstrated the feasibility and effectiveness of the AI analysis using multimodal imaging to improve the diagnostic accuracy for breast cancer.Acknowledgements
This work was supported in part by Foundation of Wenzhou Science & Technology Bureau (No. Y20180187 and Y20180144), Medical Health Science and Technology Project of Zhejiang Province Health Commission (No. 2019KY102), and NIH/NCI R01 CA127927, R21 CA208938, P30 CA062203.References
[1] Yang S-N, Li F-J, Liao Y-H, Chen Y-S, Shen W-C, Huang T-C. Identification of breast cancer using integrated information from MRI and mammography. PloS one (2015) 10(6):e0128404.
[2] Tang W, Hu FX, Zhu H, Wang QF, Gu YJ, Peng WJ. Digital breast tomosynthesis plus mammography, magnetic resonance imaging plus mammography and mammography alone: A comparison of diagnostic performance in symptomatic women. Clin Hemorheol Microcirc. (2017) 66(2):105-116.
[3] Parsian S, Rahbar H, Allison KH, Demartini WB, Olson ML, Lehman CD, et al. Nonmalignant breast lesions: ADCs of benign and high-risk subtypes assessed as false-positive at dynamic enhanced MR imaging. Radiology (2012) 265(3):696-706.
[4] Mao N, Yin P, Wang Q, Liu M, Dong J, Zhang X, et al. Added Value of Radiomics on Mammography for Breast Cancer Diagnosis: A Feasibility Study. J Am Coll Radiol. (2019) 16(4 Pt A):485-491.
[5] Lei C, Wei W, Liu Z, Xiong Q, Yang C, Yang M, et al. Mammography-based radiomic analysis for predicting benign BI-RADS category 4 calcifications. Eur J Radiol. (2019) 121:108711.
[6] Huang Y, Xiao Q, Sun Y, Wang Z, Li Q, Wang H, Gu Y. An Approach Based on Mammographic Imaging and Radiomics for Distinguishing Male Benign and Malignant Lesions: A Preliminary Study. Front Oncol. (2021) 10:607235.
[7] Niu S, Wang X, Zhao N, Liu G, Kan Y, Dong Y, et al. Radiomic Evaluations of the Diagnostic Performance of DM, DBT, DCE MRI, DWI, and Their Combination for the Diagnosis of Breast Cancer. Front Oncol. (2021) 11:725922.
[8] Ye DM, Wang HT, Yu T. The Application of Radiomics in Breast MRI: A Review. Technol Cancer Res Treat. (2020) 19:1533033820916191.
[9] Holli K, Lääperi AL, Harrison L, Luukkaala T, Toivonen T, Ryymin P, et al. Characterization of breast cancer types by texture analysis of magnetic resonance images. Acad Radiol. (2010) 17(2):135-41.
[10] Zhou J, Zhang Y, Chang KT, Lee KE, Wang O, Li J, et al. Diagnosis of benign and malignant breast lesions on DCE‐MRI by using radiomics and deep learning with consideration of peritumor tissue. J Magn Reson Imaging. (2020) 51(3):798-809.
Figures
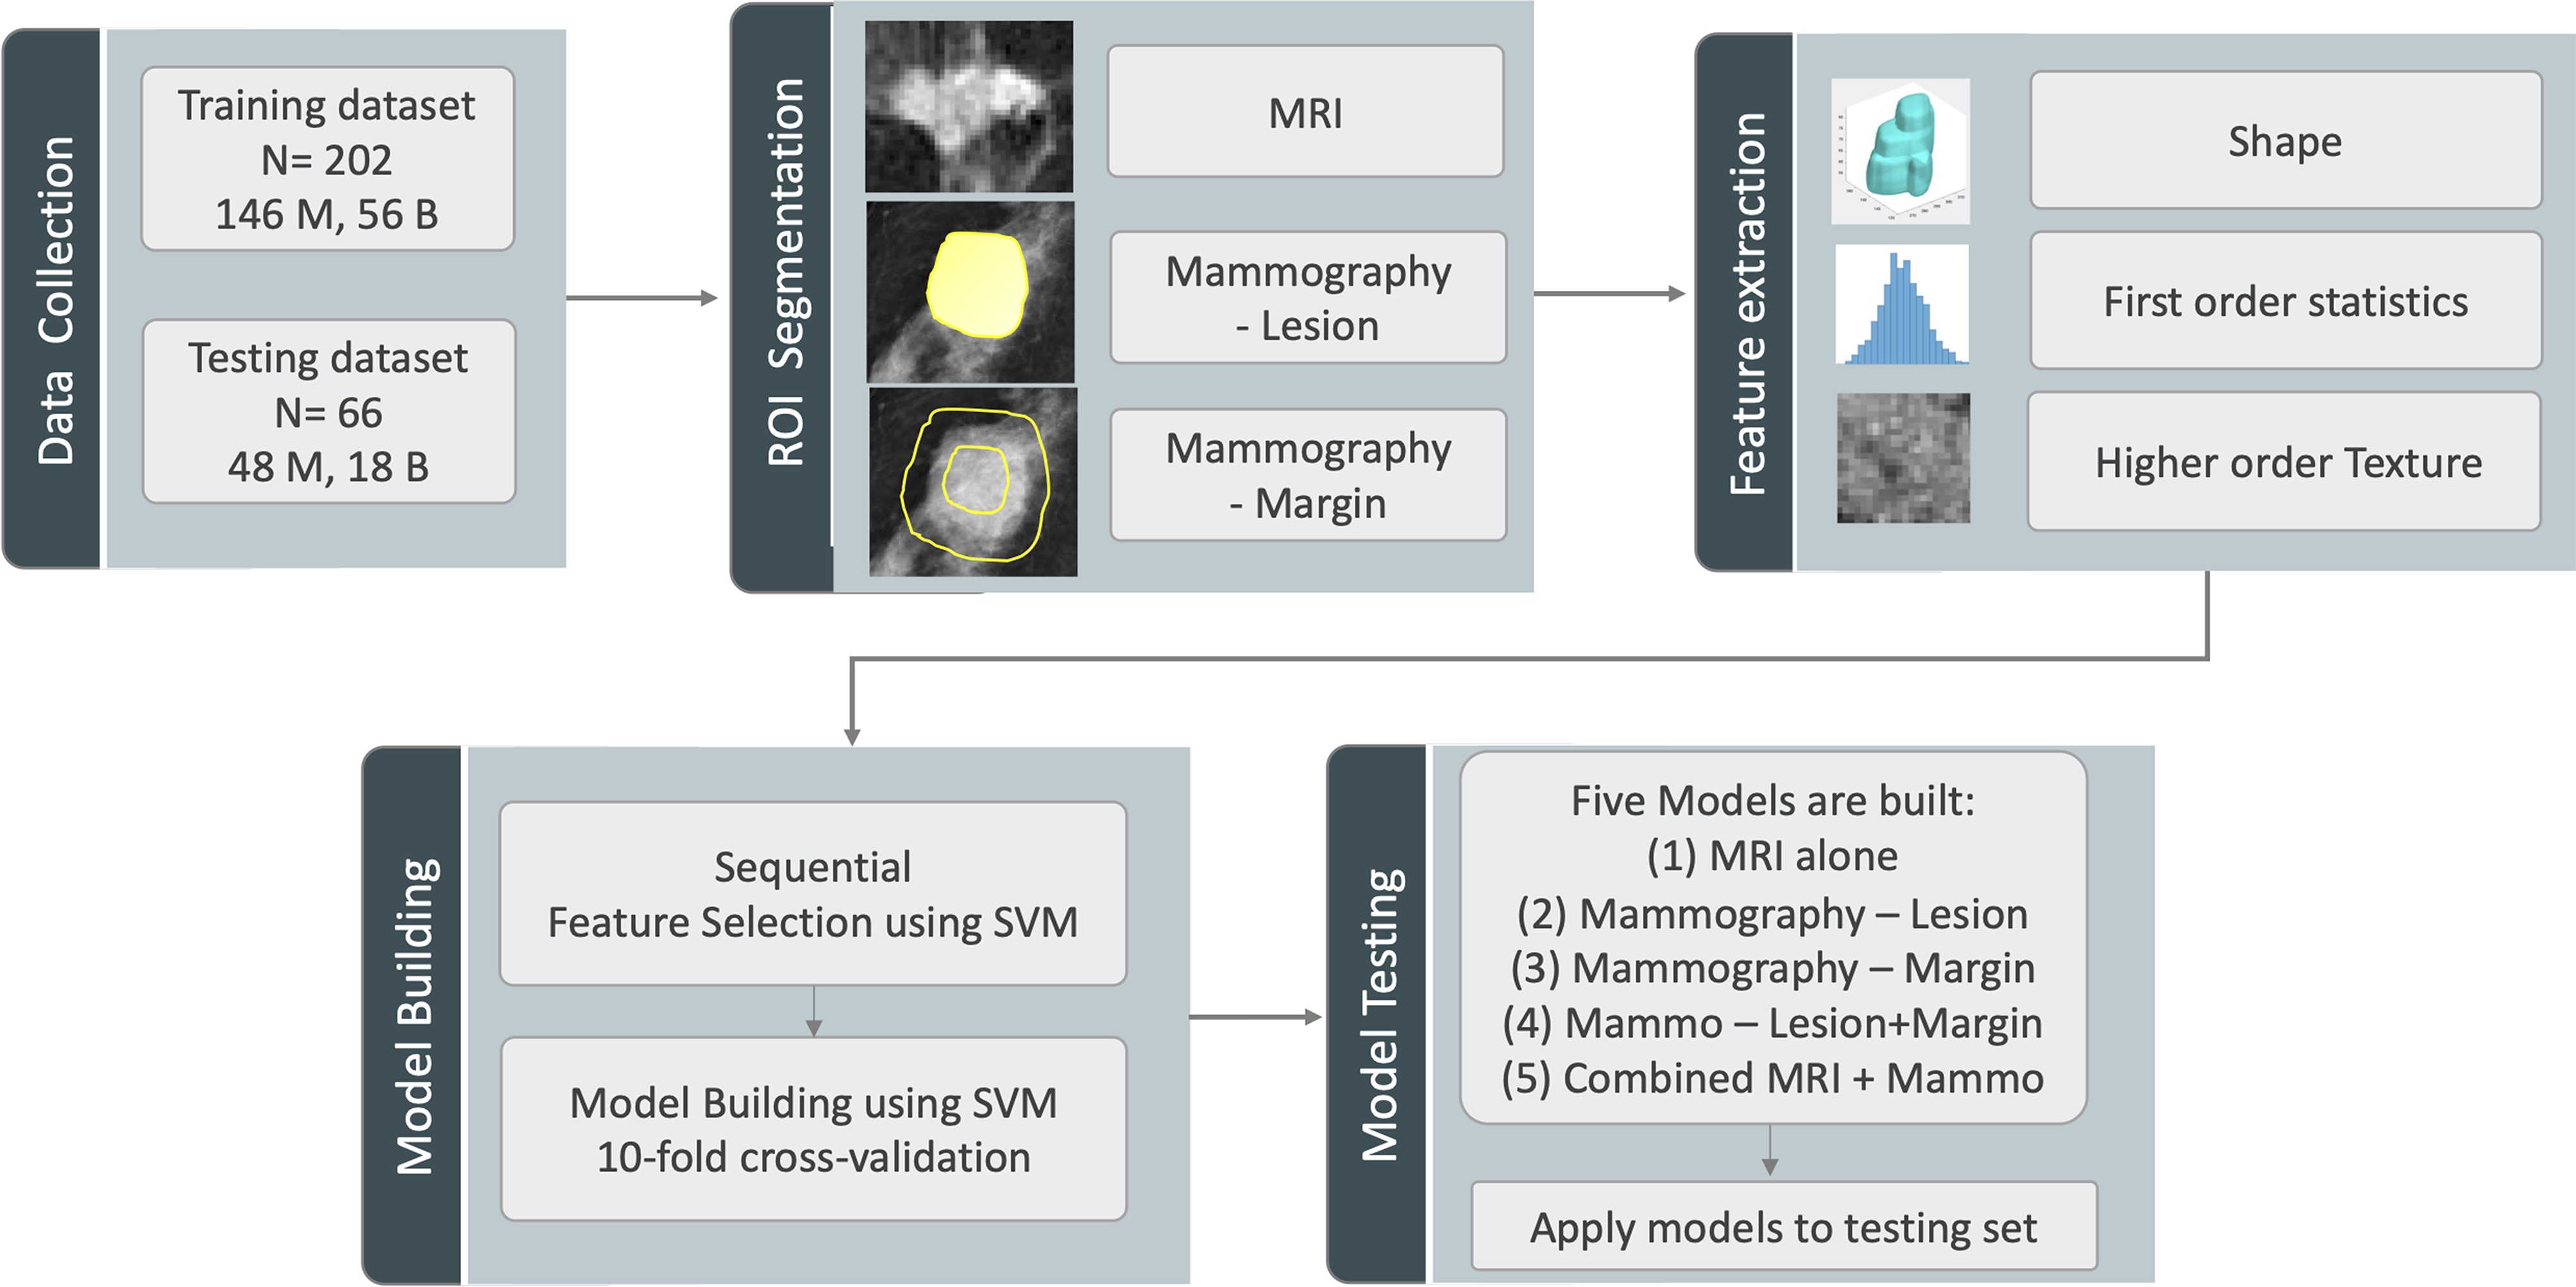
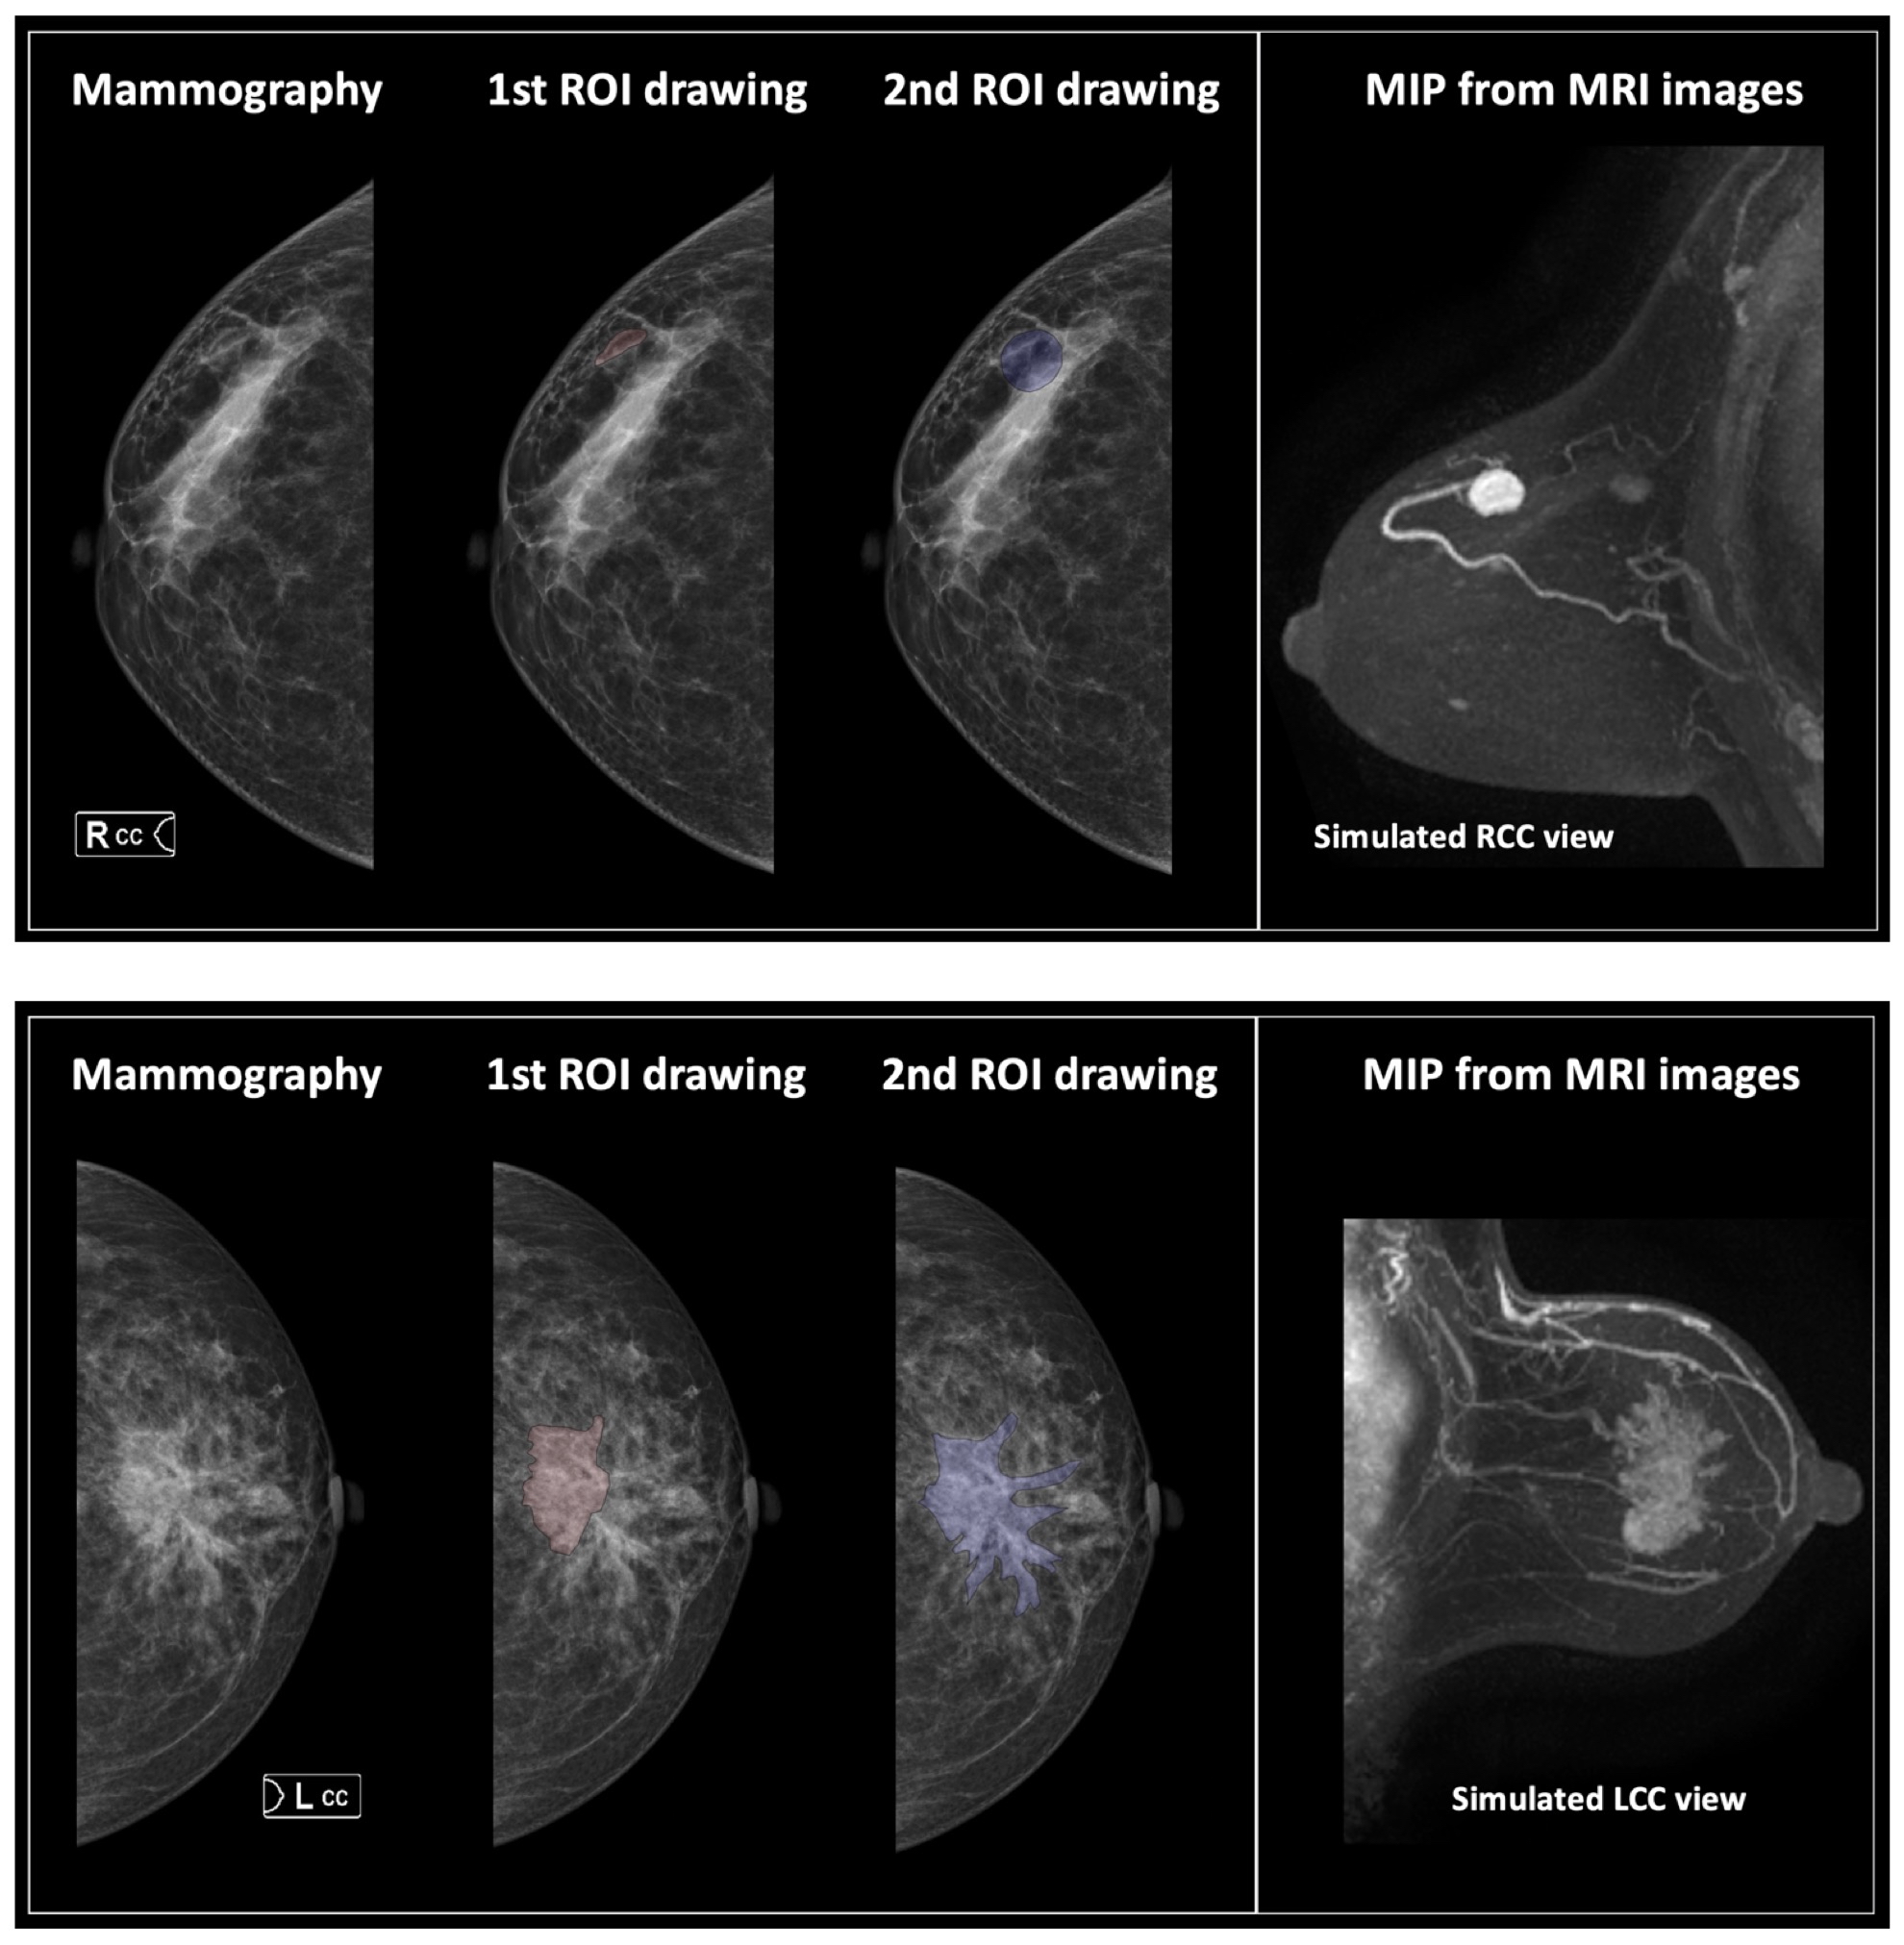
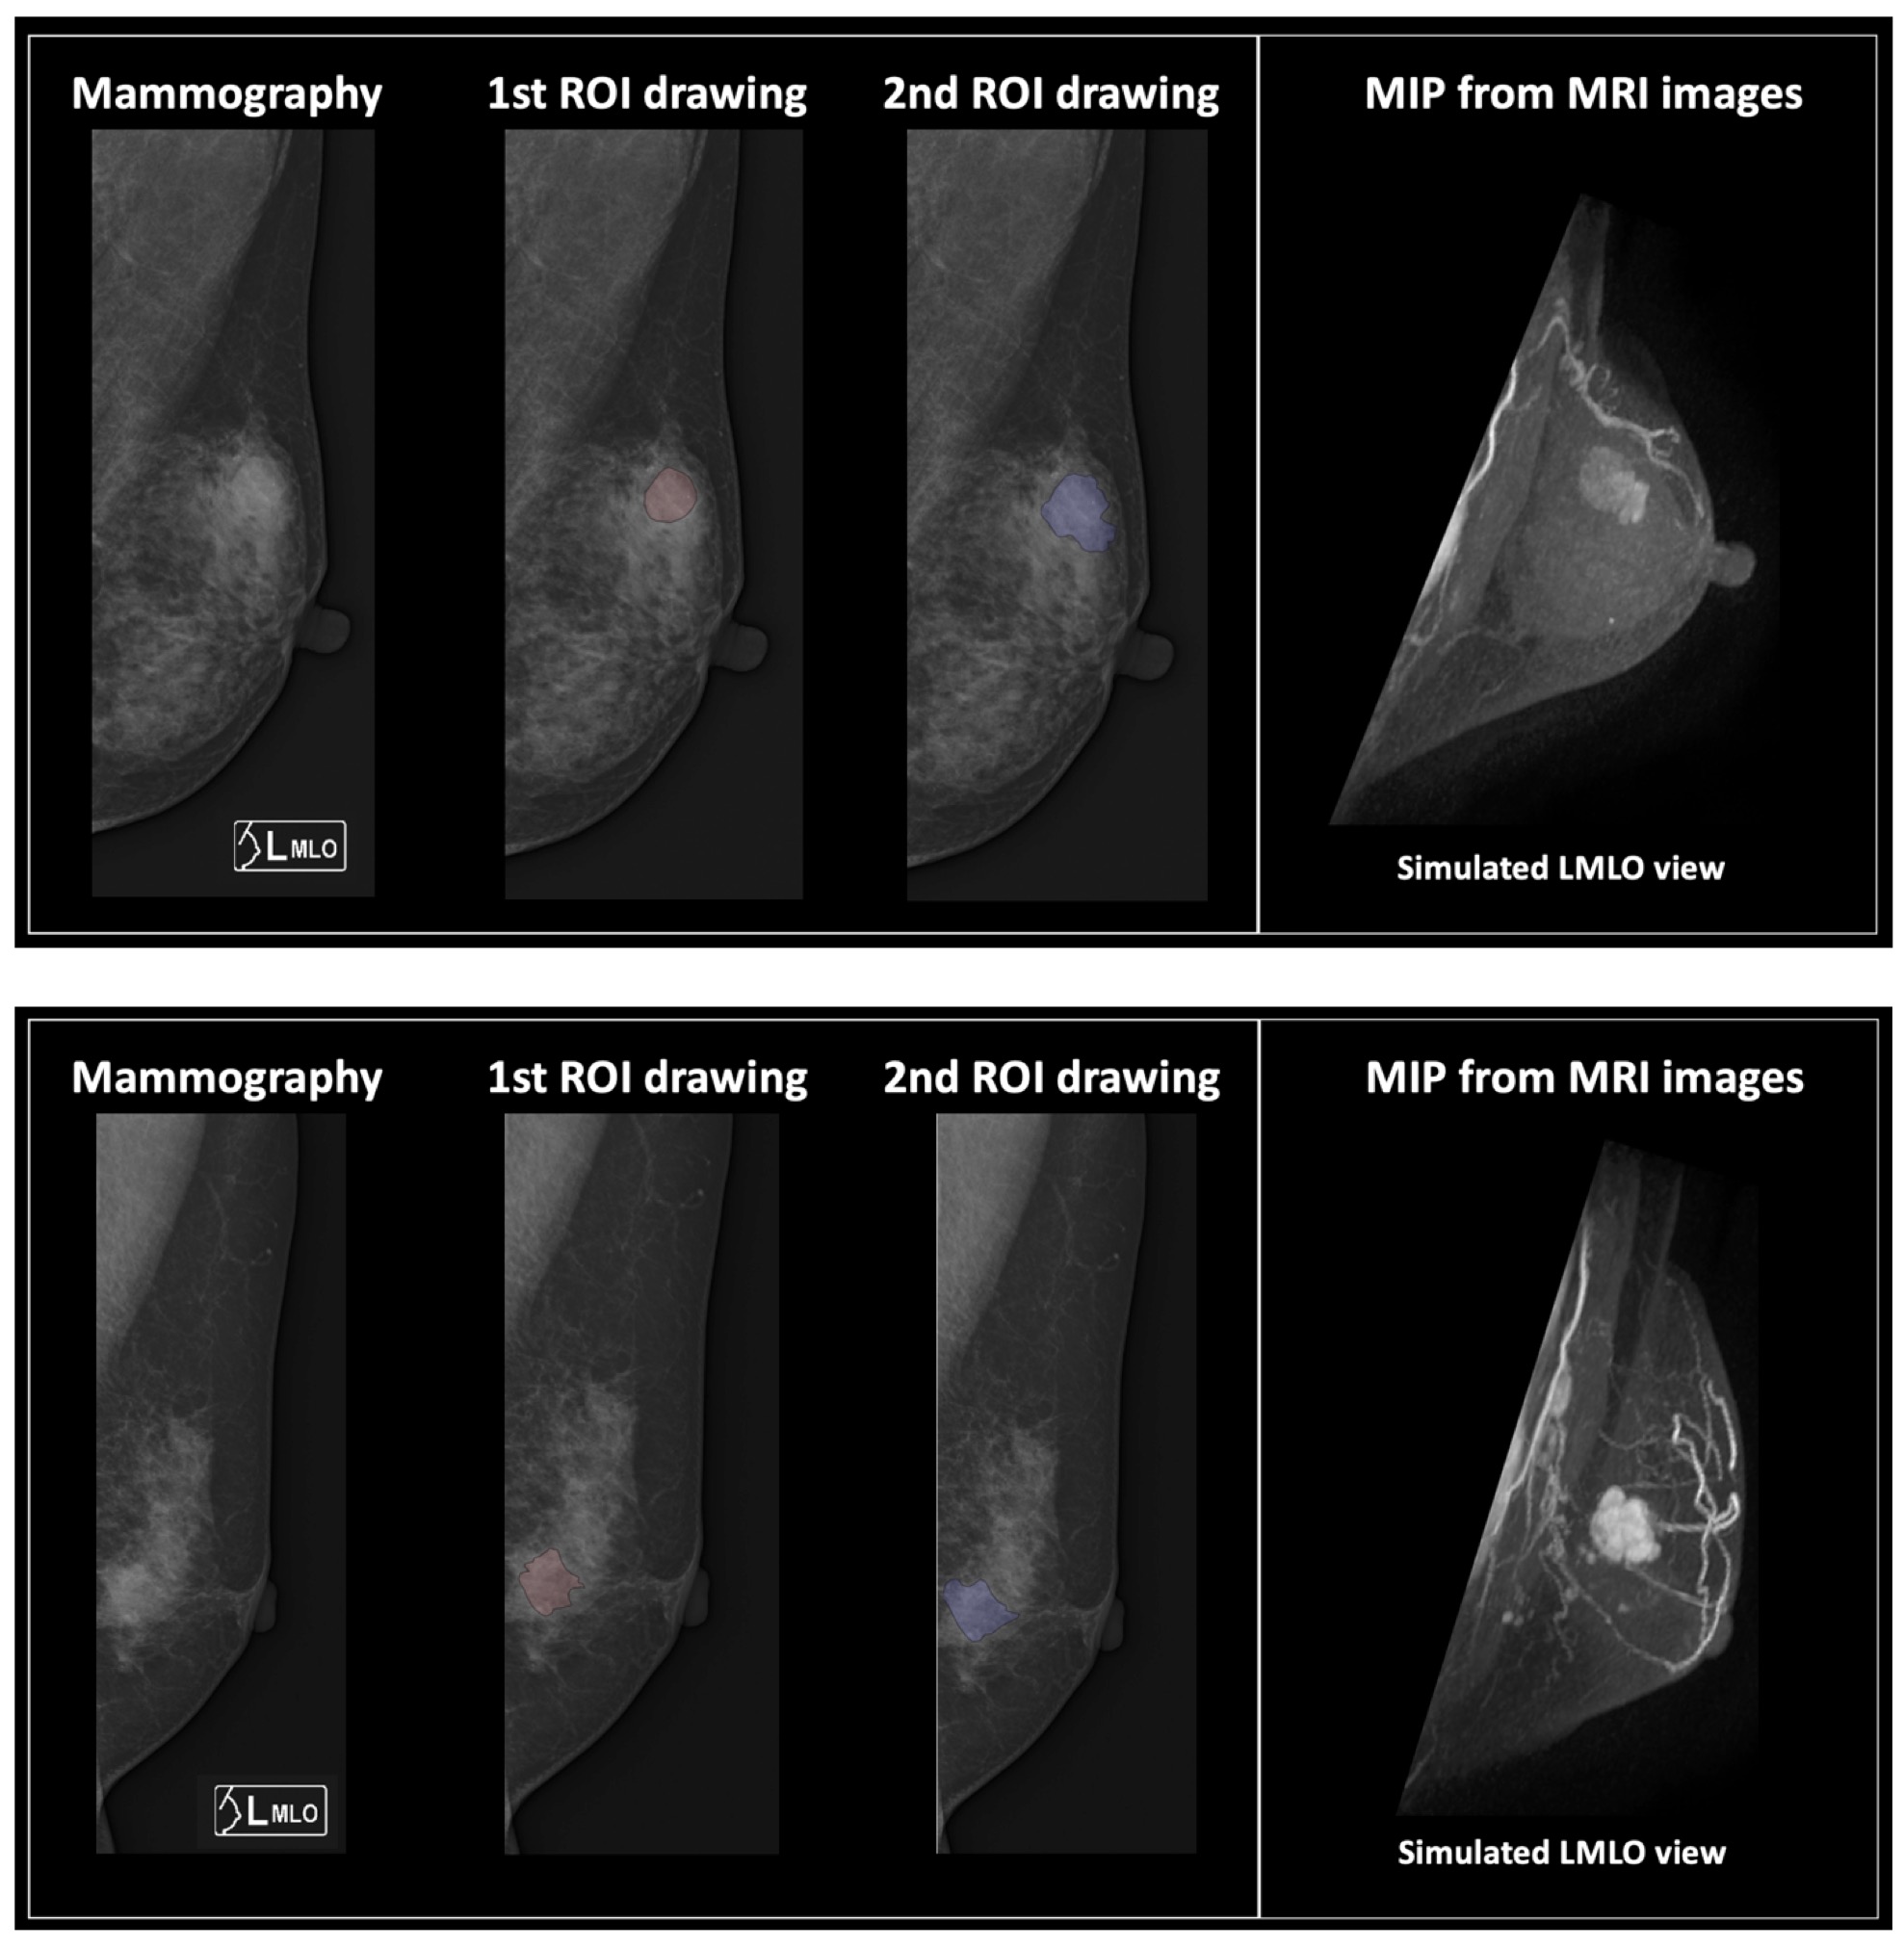
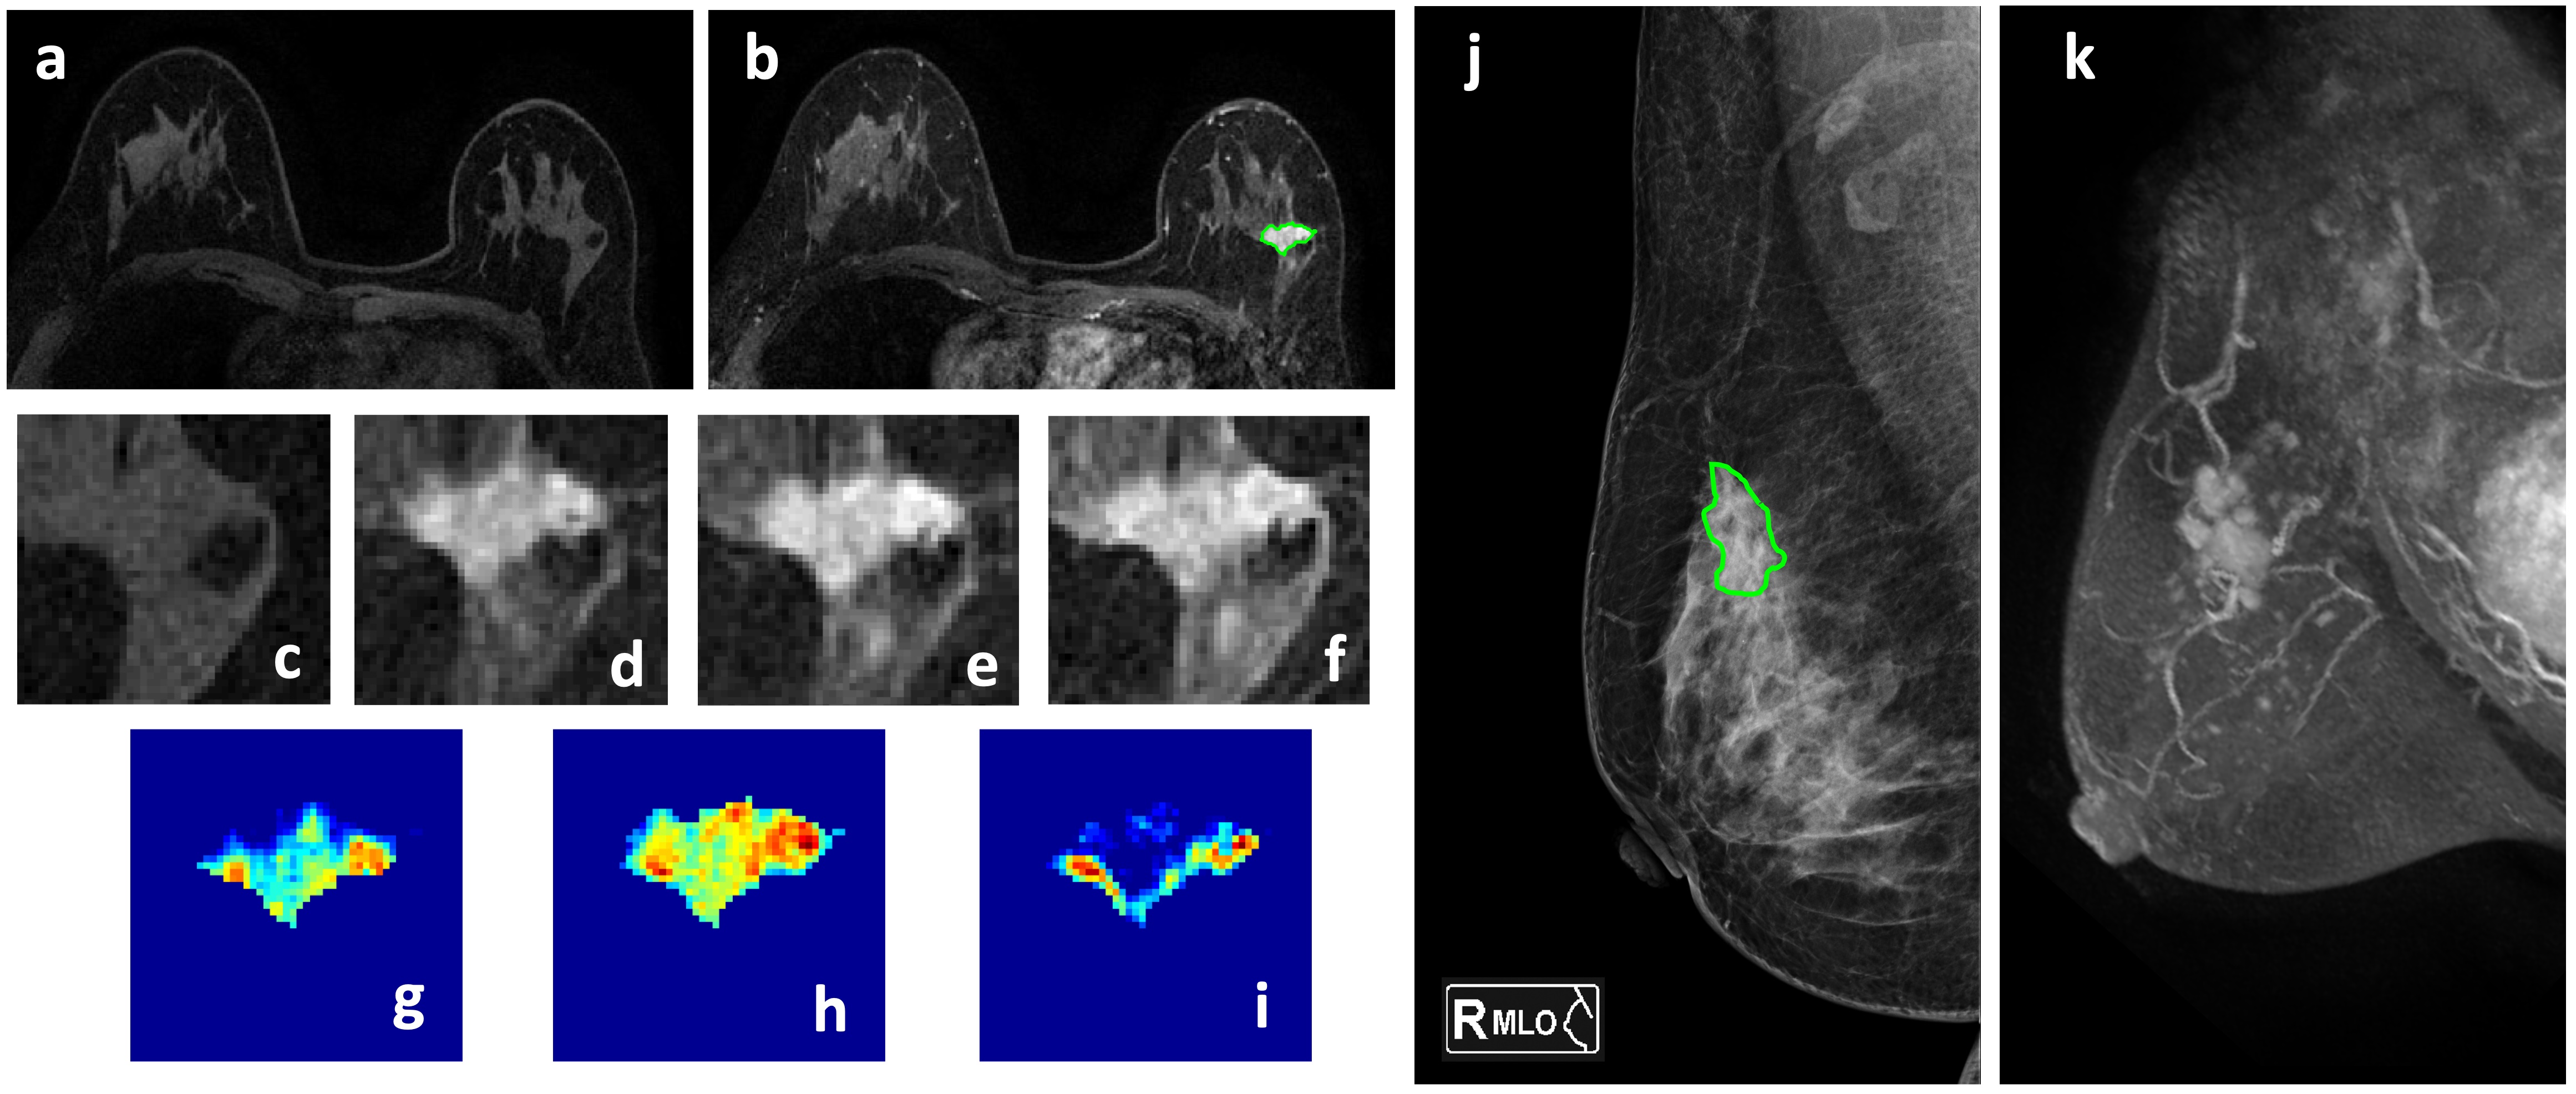
Figure 4: A 50-year-old patient with invasive ductal cancer, showing a strongly enhanced 1.8 x 1.0 cm lesion, with MRI BI-RADS score of 5. (a) F1 Pre-contrast image (b) F2 post-contrast image (c-i) Magnified images. (c) F1 (d) F2 (e) F3 (f) F6 (g) The wash-in signal enhancement map F2-F1, (h) The F3-F1 signal enhancement map (i) The wash-out F6-F3 map (j) A mass lesion with spiculation is clearly noted on mammography as BI-RADS 4C. (k) MIP of MRI maps. The radiomics malignancy probability predicted by MRI, mammography, and combined models were: 0.83, 0.77, 0.88, respectively, true positive.
