3457
Assessment of T1, T2, and T1ρ Values of Knee Cartilage and Menisci in Healthy Subjects using 3T MRI: A Preliminary Study1Division of Cardiology, Johns Hopkins University School of Medicine, Baltimore, MD, United States, 2Canon Medical Systems Corporation, Otawara, Japan
Synopsis
Efforts have been focused on early detection of osteoarthritis using MRI. Our study reports T1, T1ρ and T2 values for knee cartilage and menisci in normal subjects using 3T MRI, and evaluates associations with age, gender, and BMI. We found that WB-FC had higher T1 and lower T2 values than LWB-FC, and WB-FC had higher T1 values in females. T1 values of WB-FC and LM were associated with age, and T1ρ values of WB-FC were associated with BMI. Our study presents novel data on T1 mapping, reinforcing the utility of MRI as a potential tool for early detection of osteoarthritis.
Introduction
Osteoarthritis is a prevalent joint disease that commonly affects the knee and potentially causes significant morbidity with advancing age1. Several efforts have been made to improve the early detection of this disease, and most recently, MRI techniques such as T1ρ and T2 mapping, have been studied2. The goal of our study is to report the ranges of T1, T1ρ and T2 values for knee cartilage and menisci in normal subjects, and to evaluate differences in these values between different cartilage and meniscal subfractions and determine associations with gender, age, and BMI.Methods
Forty normal volunteers (60% males, mean age 43 years, mean BMI 27 kg/m2, 5% diagnosed with diabetes, 12.5% diagnosed with hypertension) without knee disease or complications were consented into a prospective study. Parametric T1 mapping was assessed using the modified Look‐Locker inversion recovery (MOLLI) method with a gradient-echo readout. T2 mapping was acquired using a T2-prepared gradient-echo sequence and T1ρ mapping with a spin-lock prepared 3D gradient echo sequence. All imaging was performed at a 3T system (Vantage Galan 3T, Canon Medical Systems, Japan). T1, T1ρ and T2 maps were analyzed by using the OsiriX software (Pixmeo SARL, Switzerland). Mapping indices were obtained for weight-bearing (WB) and less-weight-bearing (LWB) femoral cartilage (FC) as proposed by Goto et al3. The meniscal structures sampled were the anterior and posterior horns of the lateral meniscus (LM)4 (Figure 1). Wilcoxon matched-pairs signed-rank test was used for comparison between WB-FC and LWB-FC within each map. Mann-Whitney U test was used for comparison of age, BMI, and all mapping indices between males and females. Simple and multivariate linear regressions were used to evaluate the association of all mapping indices with age and BMI. Gender, diabetes status and hypertension status were used as covariates in the multivariate analysis. P<0.05 was set for statistical significance.Results
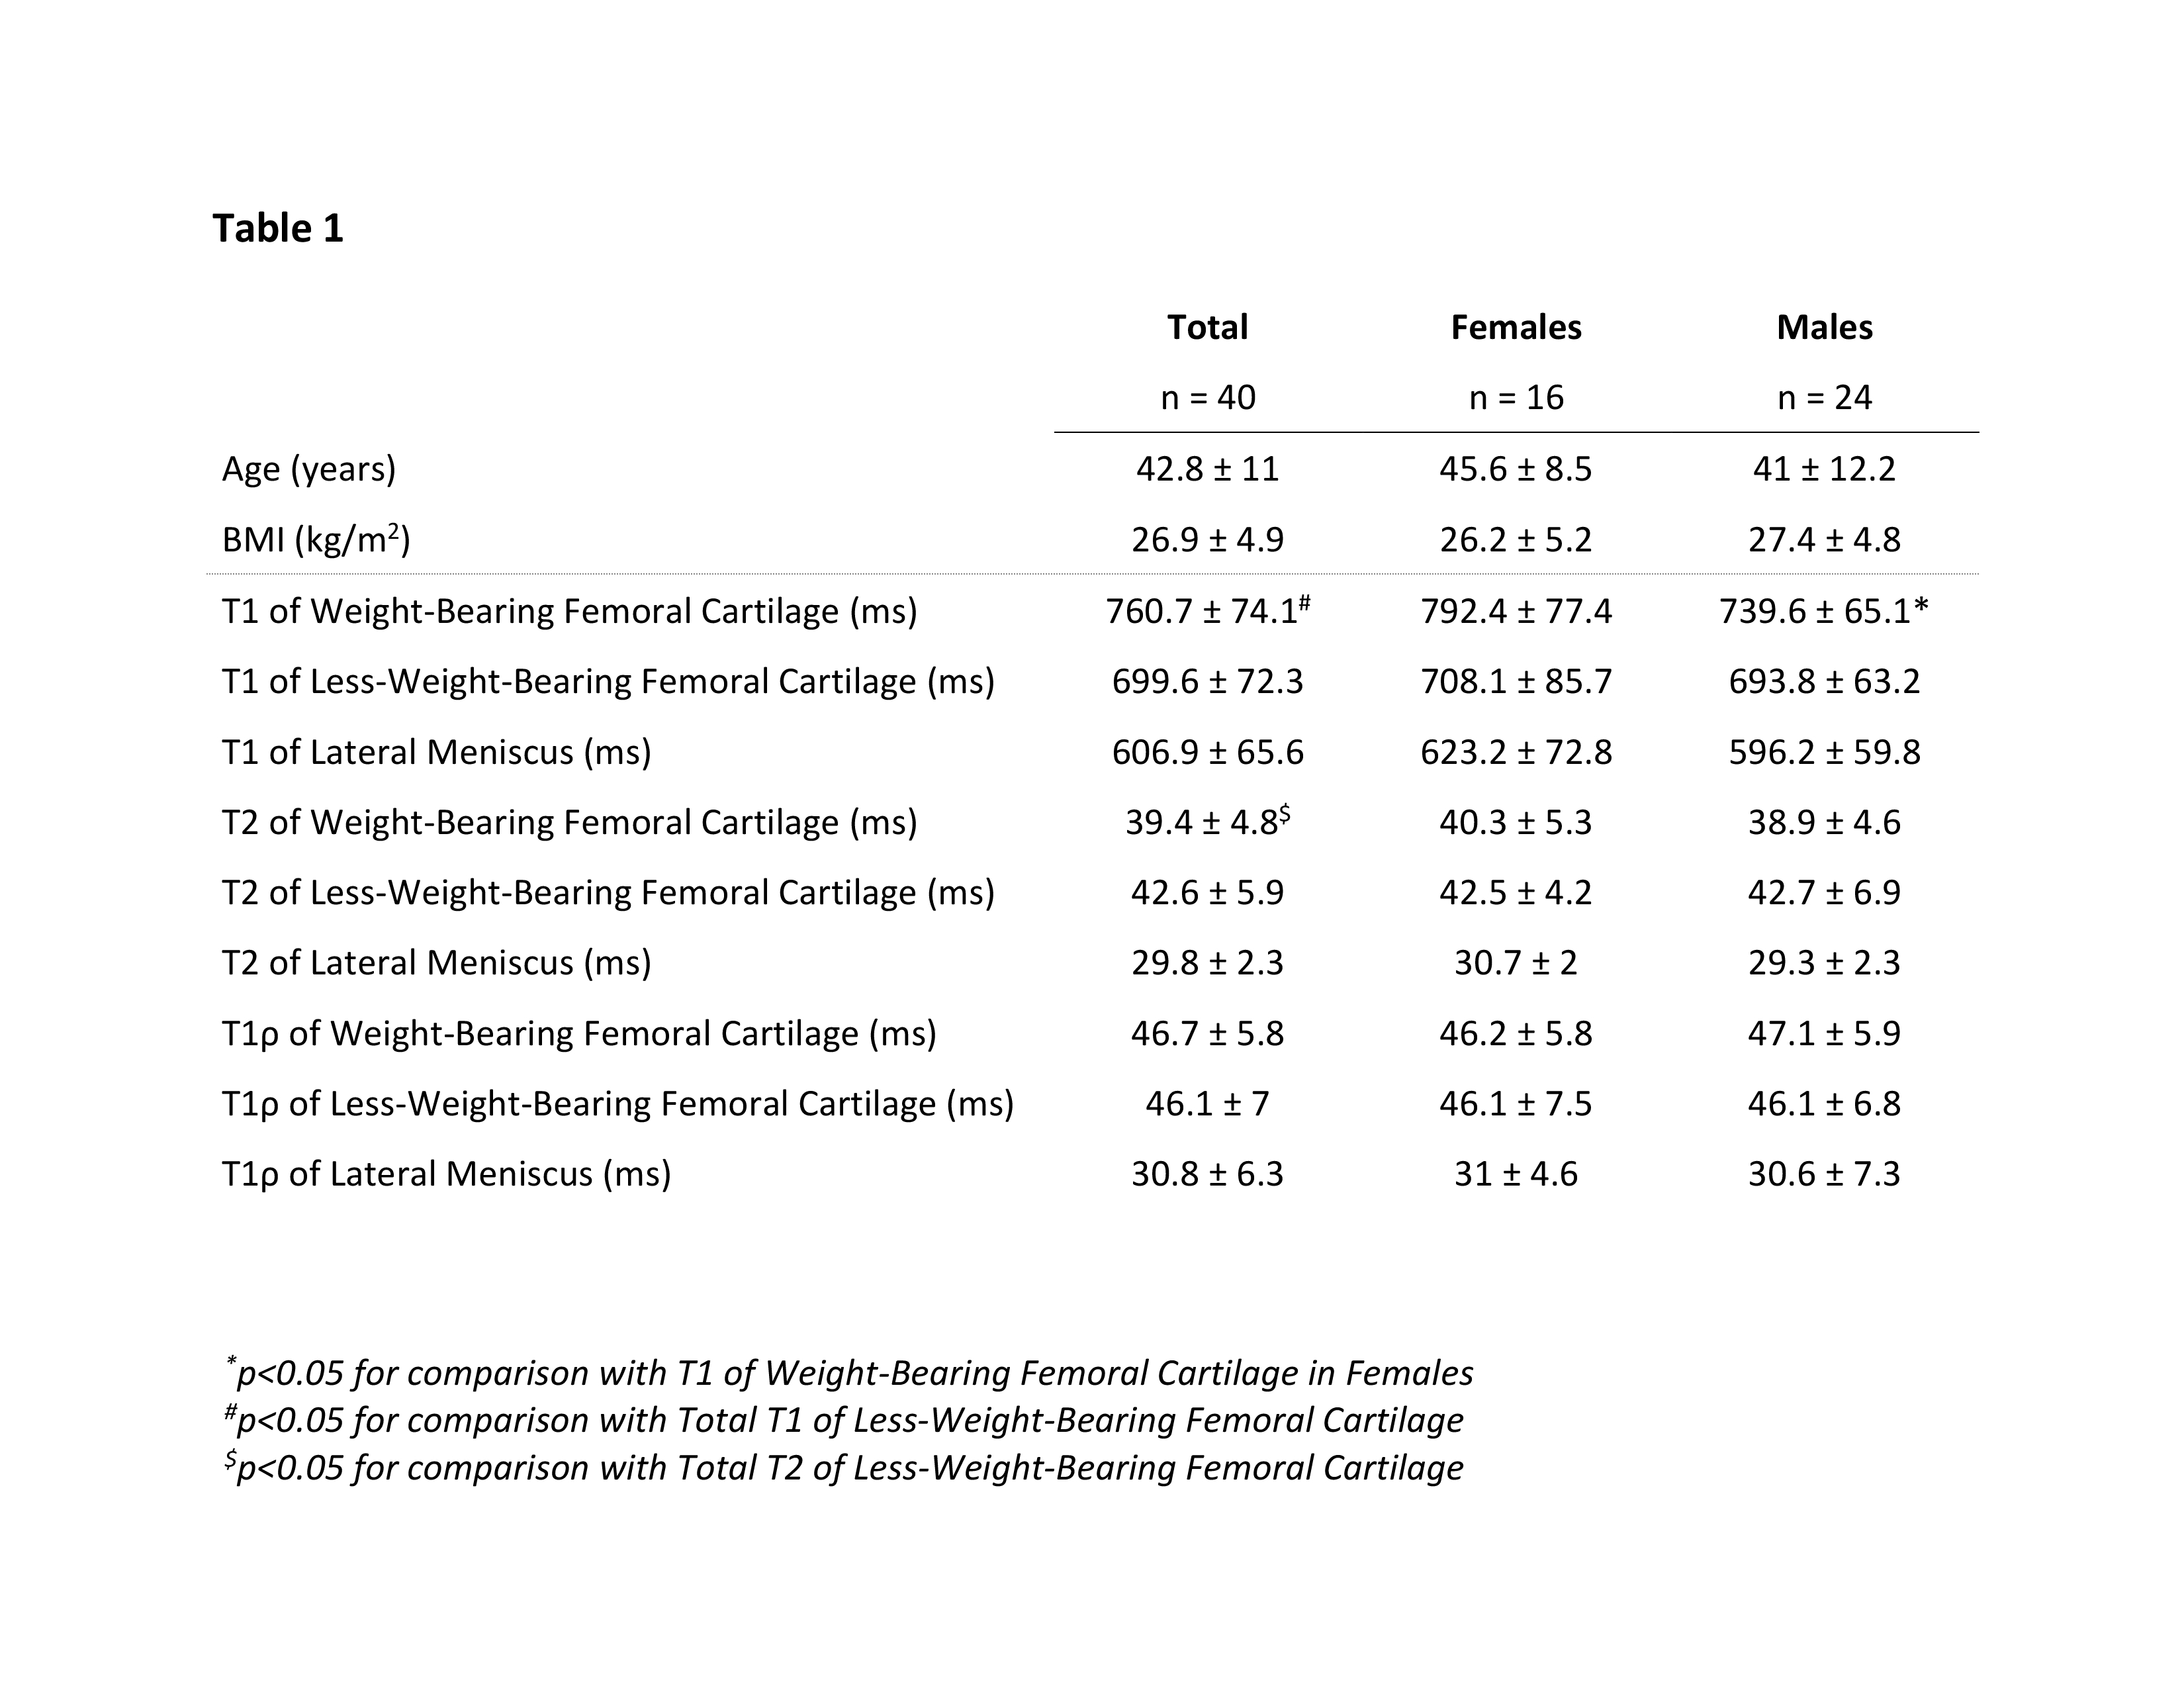
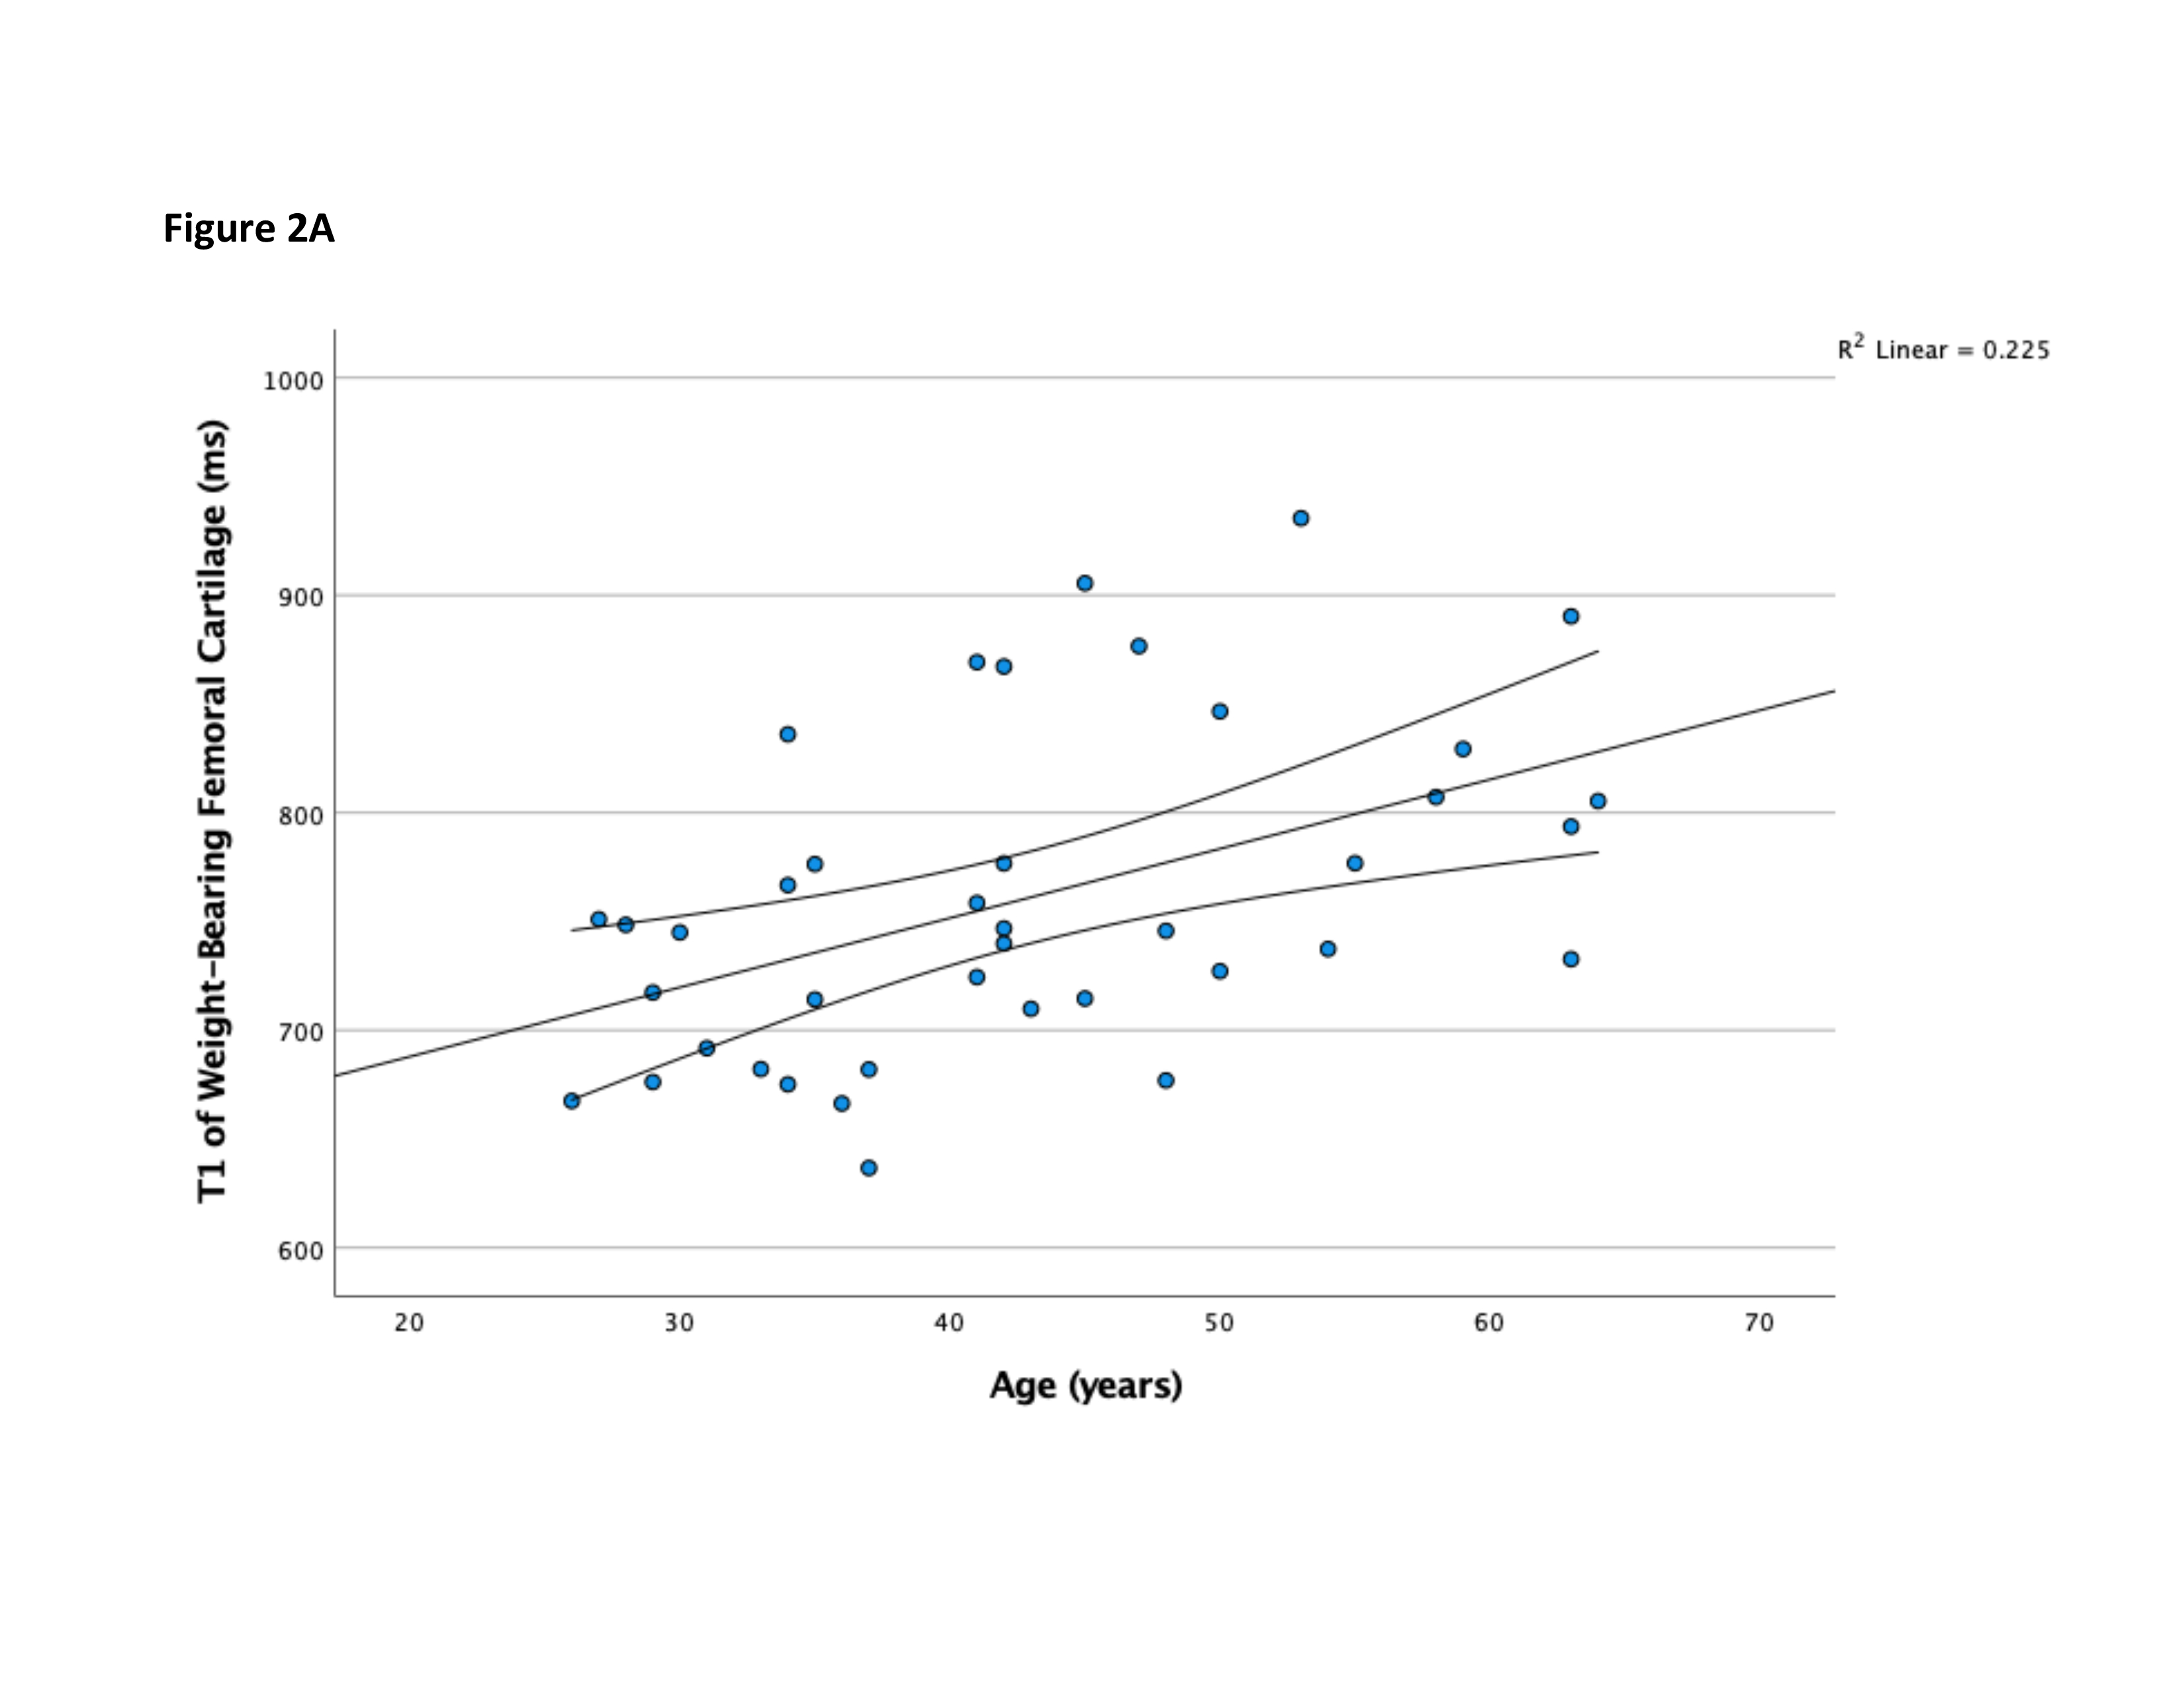
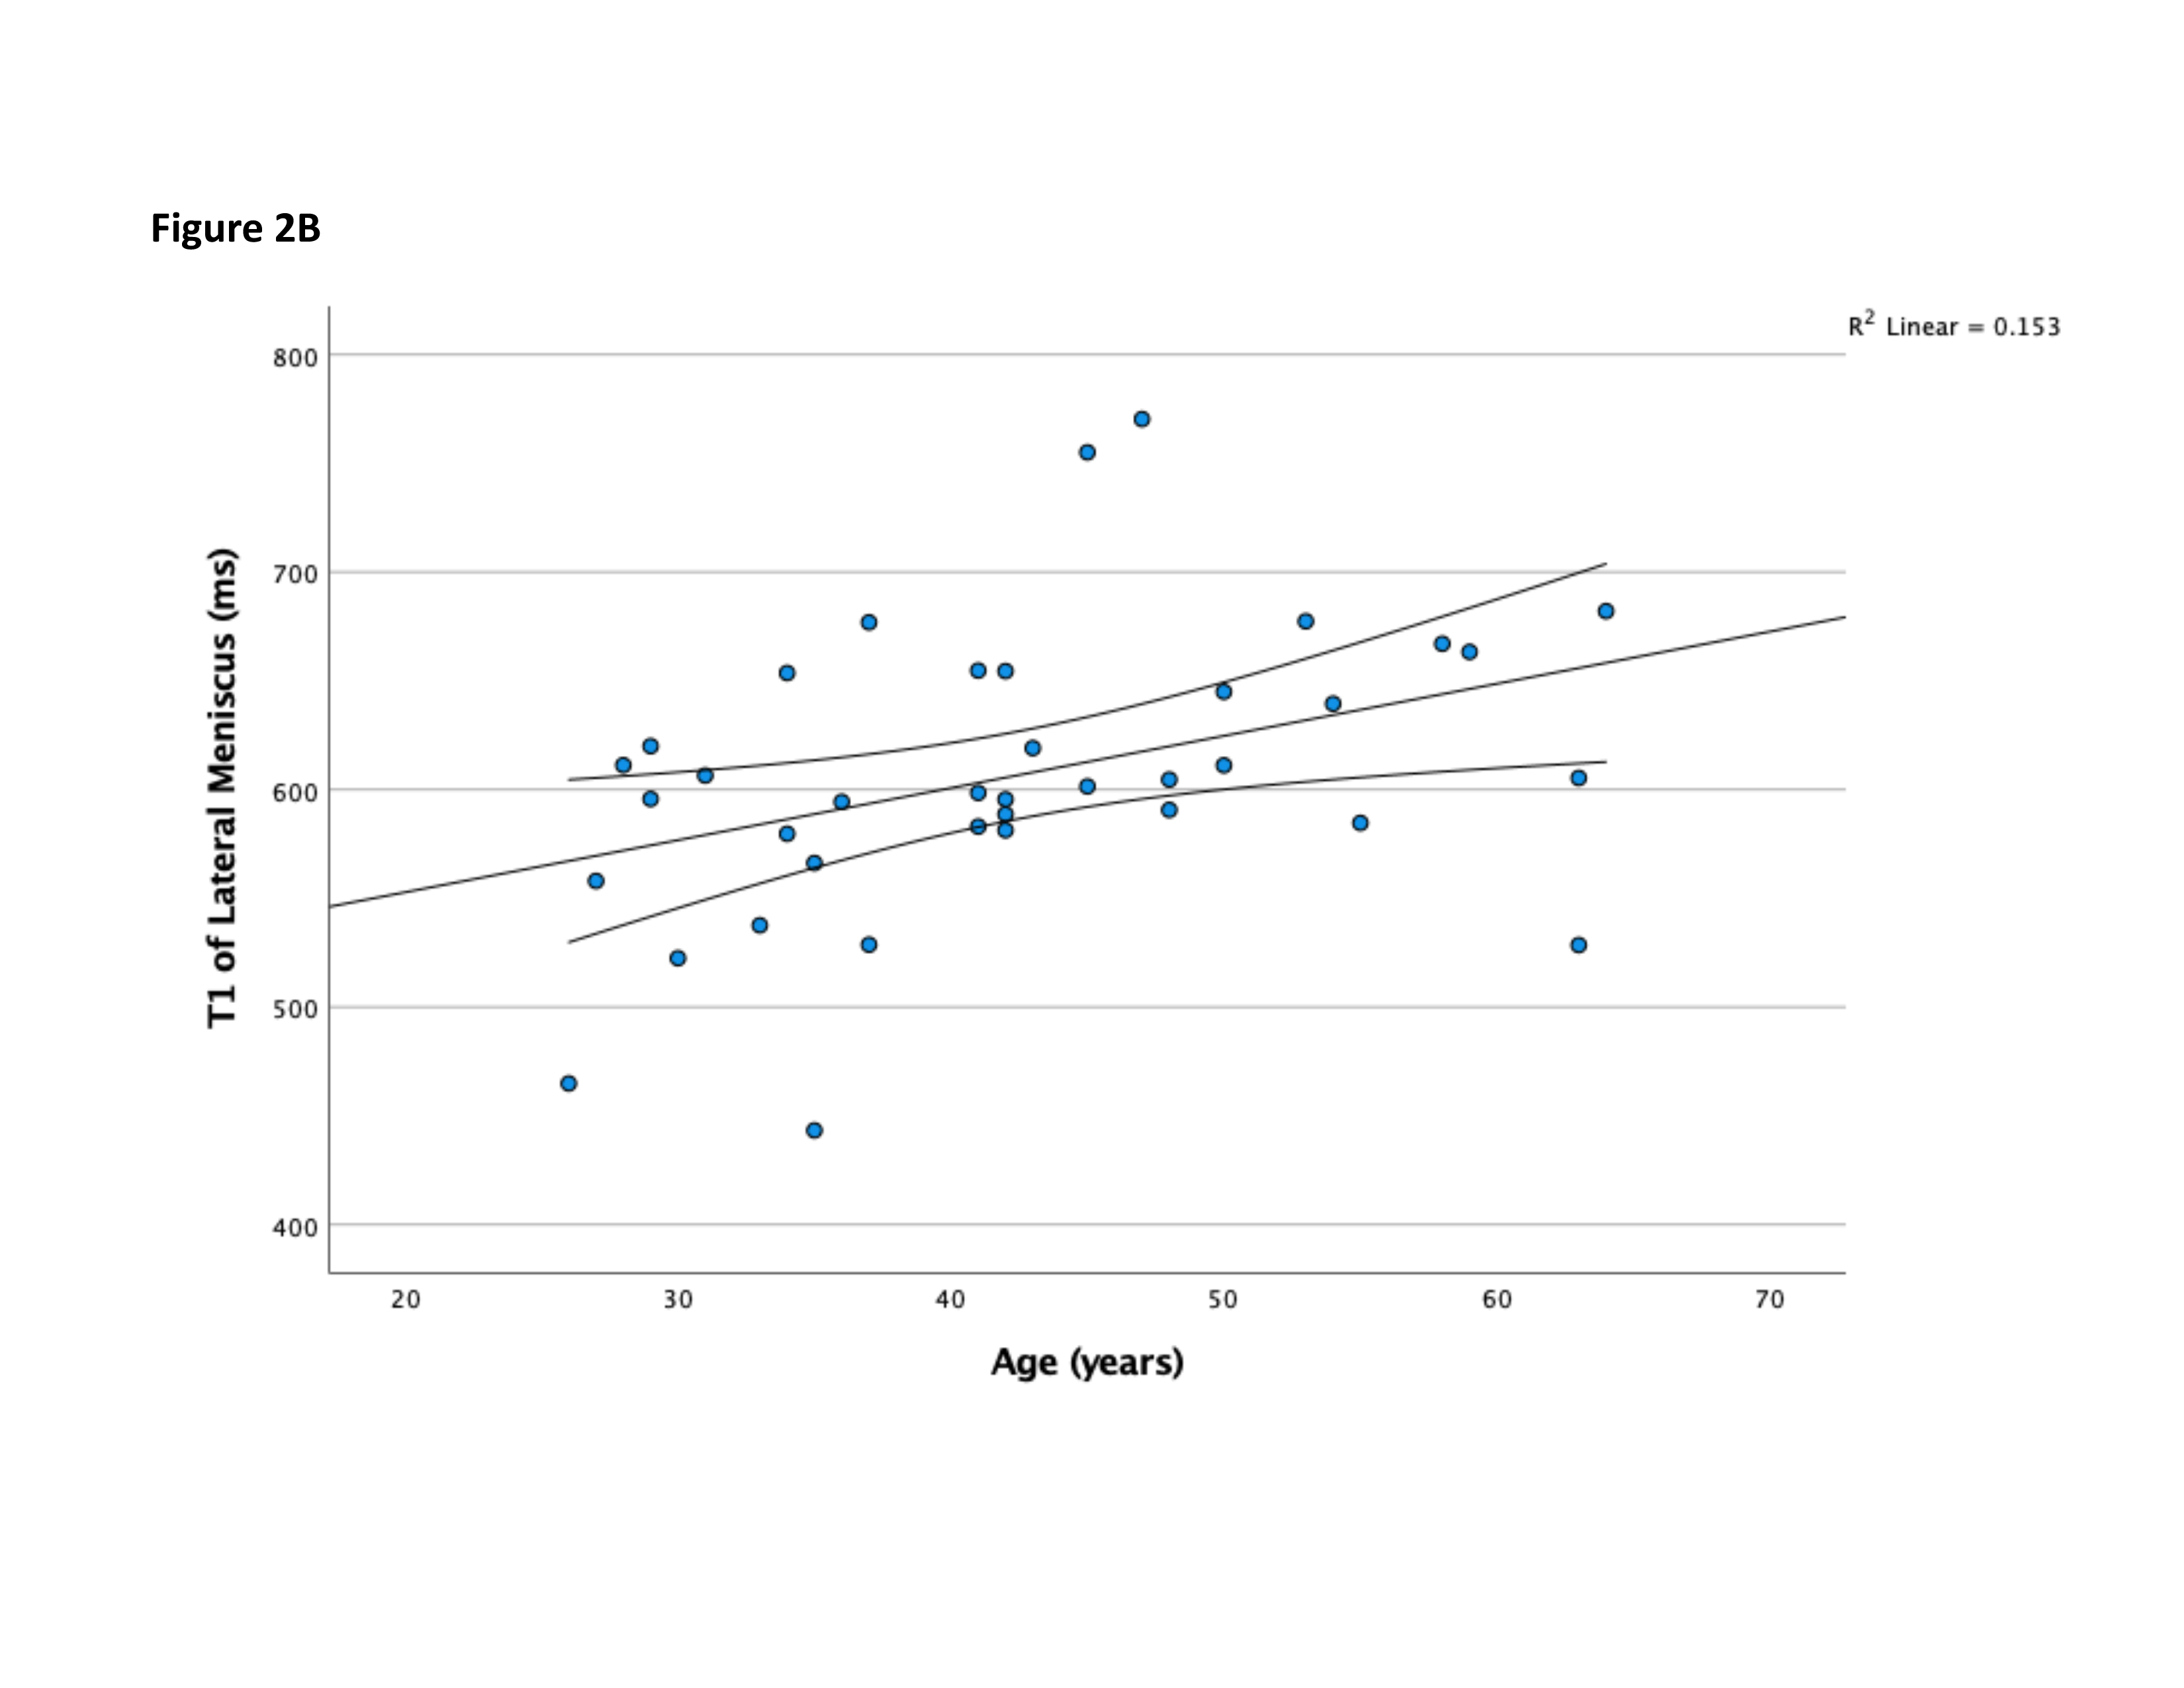
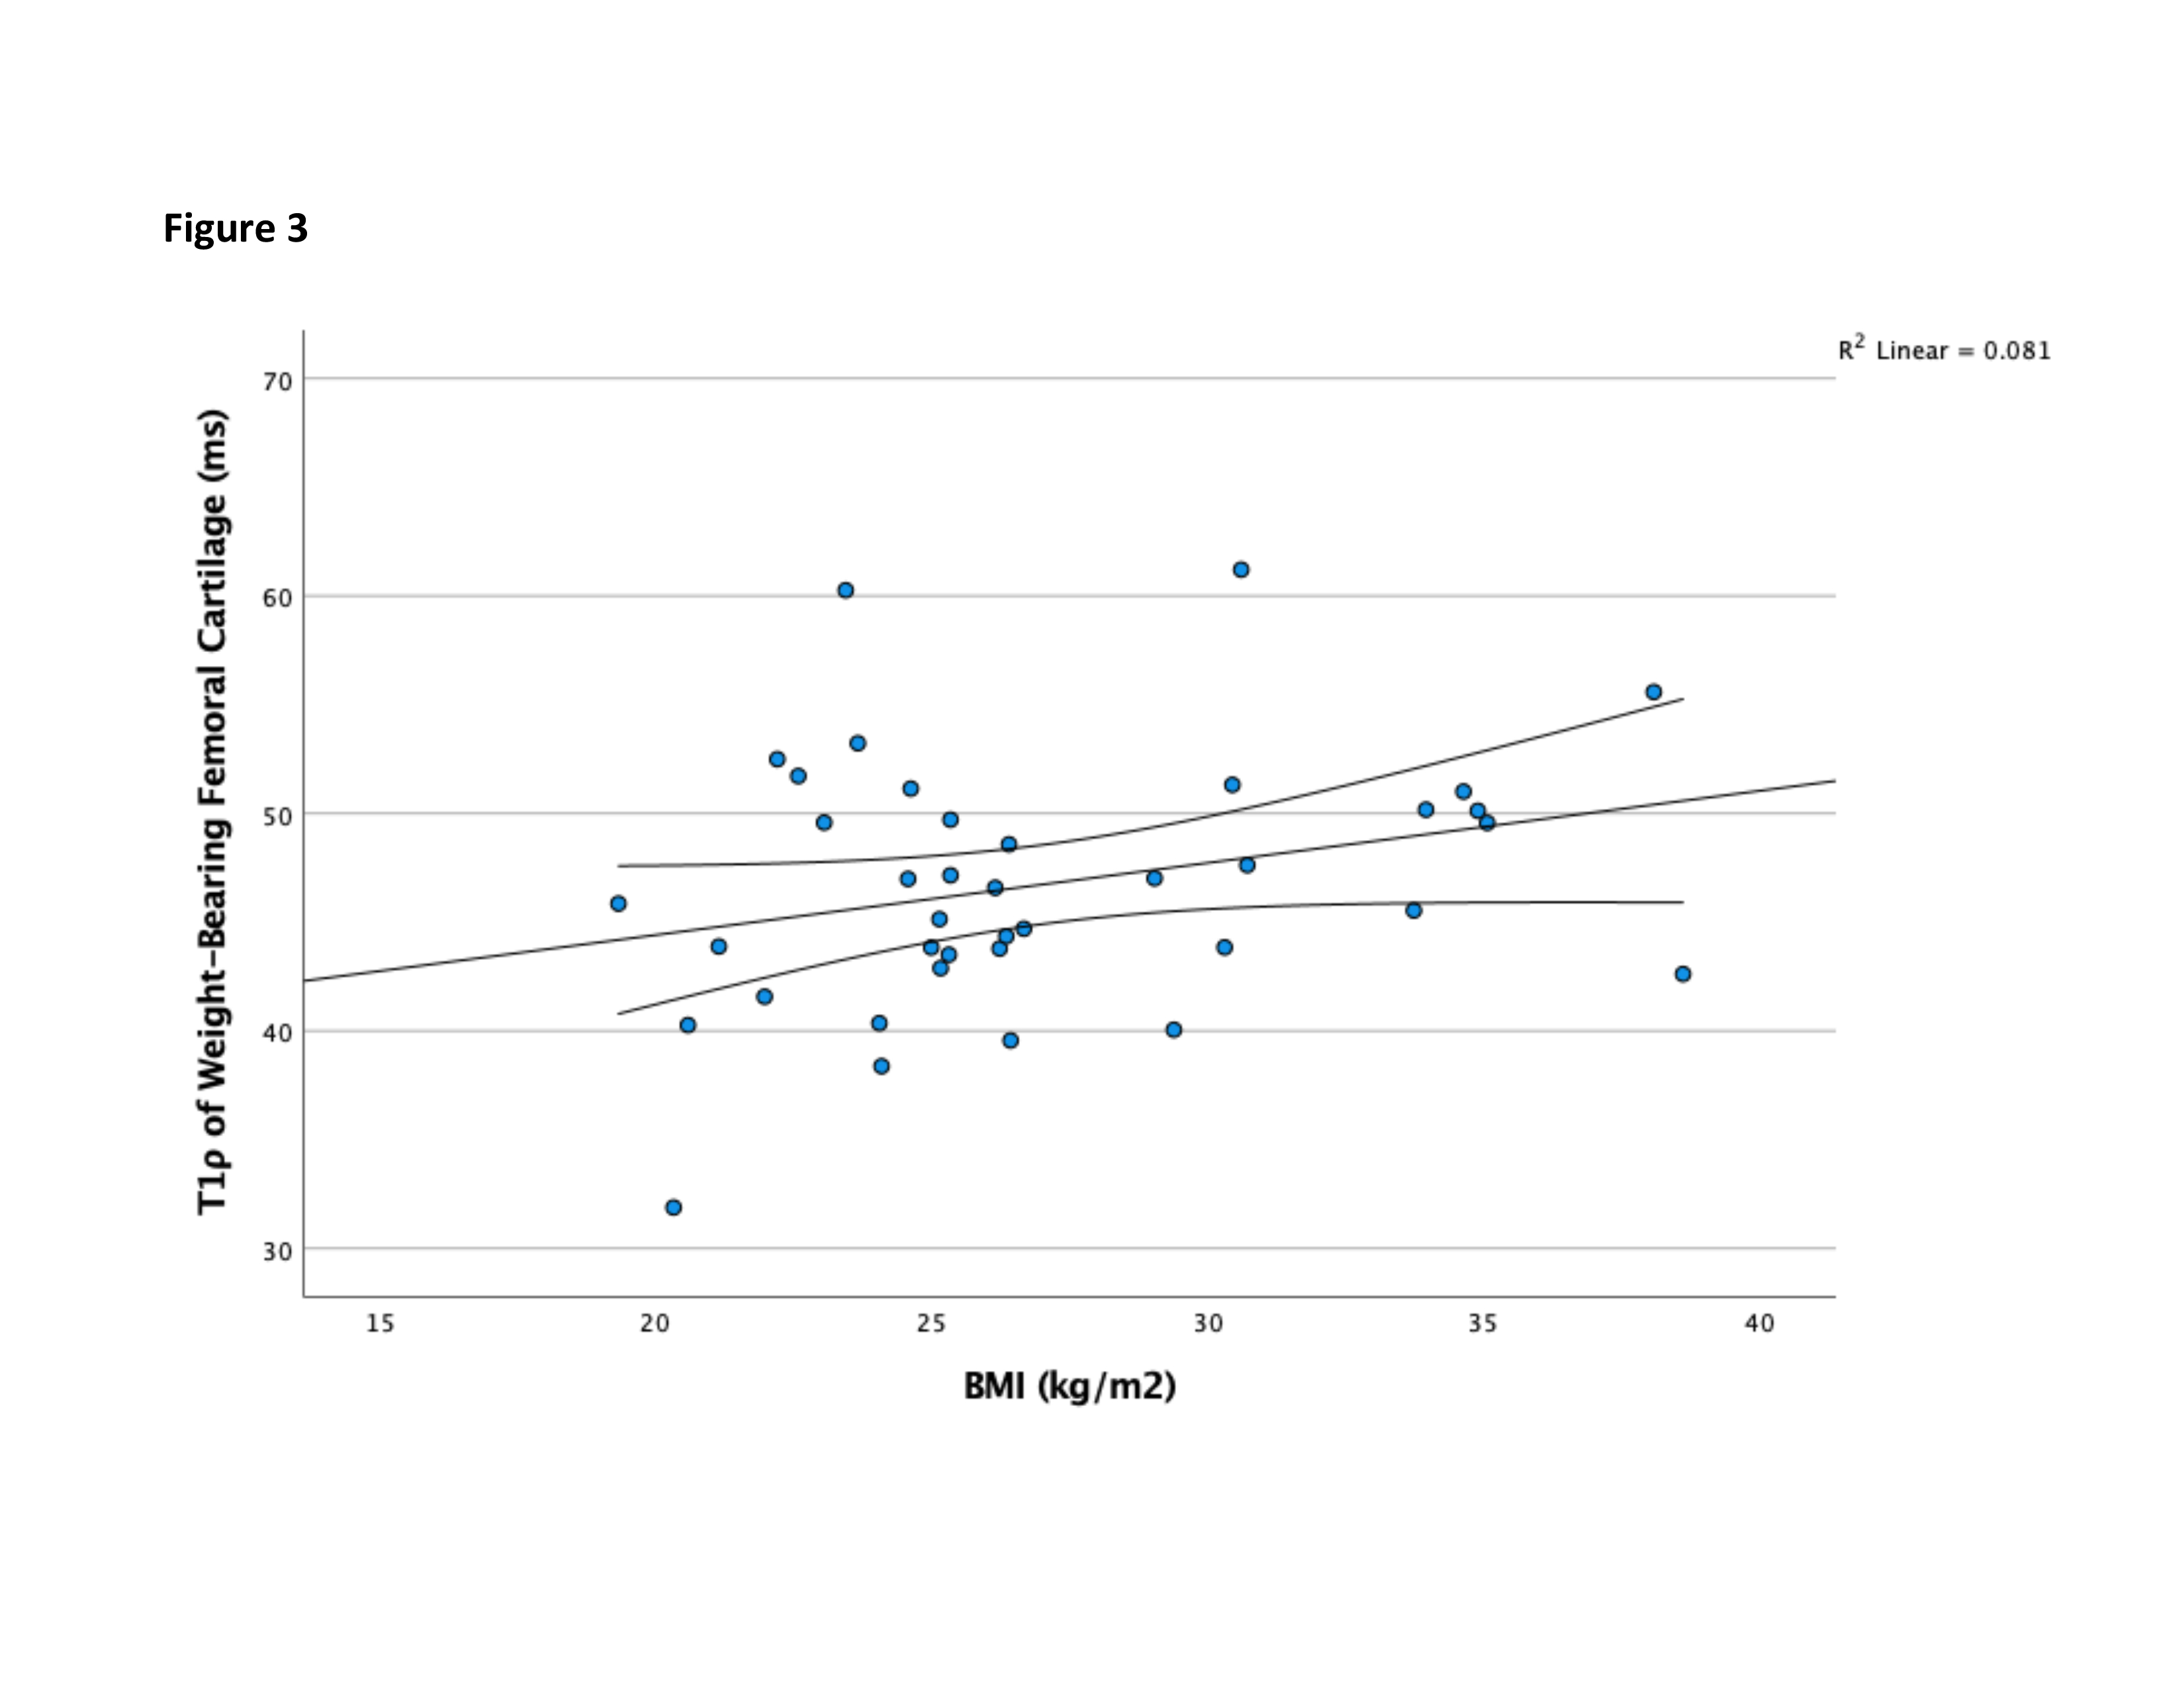
Total and gender-stratified mean age, BMI, and T1, T2 and T1ρ values for knee cartilage and menisci are summarized in Table 1. T1 values of total WB-FC were higher than T1 values of total LWB-FC (p<0.001), and T2 values of total WB-FC were lower than T2 values of total LWB-FC (p=0.002). T1 values of WB-FC were higher in females as compared to males (p=0.048). T1 values of total WB-FC (Figure 2A) and LM (Figure 2B) were found to positively correlate with age after adjusting for gender, BMI, diabetes, and hypertension (p=0.003 and p=0.02 respectively). T1ρ values of total WB-FC (Figure 3) were found to positively correlate with BMI after adjusting for age, gender, diabetes, and hypertension (p=0.031).Discussion
The novelty in this study is the simultaneous evaluation of femoral cartilage and menisci and the reporting of T1 values in addition to the T2 and T1ρ values previously described in the literature3, 4. Our study demonstrates the significant difference in T1 and T2 values between WB and LWB areas of femoral cartilage, which reinforces the role of weight-bearing in the change in cartilage composition that accompanies the development of osteoarthritis. We were also able to reproduce the BMI-dependence of T1ρ values5, and the age-independence of T2 values for WB-FC3 previously shown, and additionally show the age-dependence of T1 values for WB-FC and LM. Overall, this study elucidates an important role for T1 mapping in the evaluation of the knee cartilage and menisci, whereas most previous efforts were focused on T2 and T1ρ maps3-5.Conclusion
The results of this study provide insight into how dynamic changes of cartilage and meniscal composition with weight-bearing, advancing age and elevated BMI can be detected using 3T MRI. The age dependence of T1 values may indicate a promising role for T1 mapping in the evaluation of early knee articular degeneration, in addition to T2 and T1ρ maps. Further studies with a diseased comparison group are needed to elucidate the potential clinical role of 3T MRI in the early detection of preclinical knee osteoarthritis.Acknowledgements
No acknowledgement found.References
1. Nguyen US, Zhang Y, Zhu Y, Niu J, Zhang B and Felson DT. Increasing prevalence of knee pain and symptomatic knee osteoarthritis: survey and cohort data. Ann Intern Med. 2011;155:725-32.2. Mosher TJ, Dardzinski BJ and Smith MB. Human articular cartilage: influence of aging and early symptomatic degeneration on the spatial variation of T2--preliminary findings at 3 T. Radiology. 2000;214:259-66.
3. Goto H, Iwama Y, Fujii M, Aoyama N, Kubo S, Kuroda R, Ohno Y and Sugimura K. A preliminary study of the T1rho values of normal knee cartilage using 3T-MRI. Eur J Radiol. 2012;81:e796-803.
4. Knox J, Pedoia V, Wang A, Tanaka M, Joseph GB, Neumann J, Link TM, Li X and Ma CB. Longitudinal changes in MR T1rho/T2 signal of meniscus and its association with cartilage T1p/T2 in ACL-injured patients. Osteoarthritis Cartilage. 2018;26:689-696.
5. Ikuta F, Takahashi K, Kiuchi S, Watanabe A, Okuaki T, Oshima Y, Watanabe H and Hashimoto S. Effects of repeated intra-articular hyaluronic acid on cartilage degeneration evaluated by T1rho mapping in knee osteoarthritis. Mod Rheumatol. 2021;31:912-918.
Figures
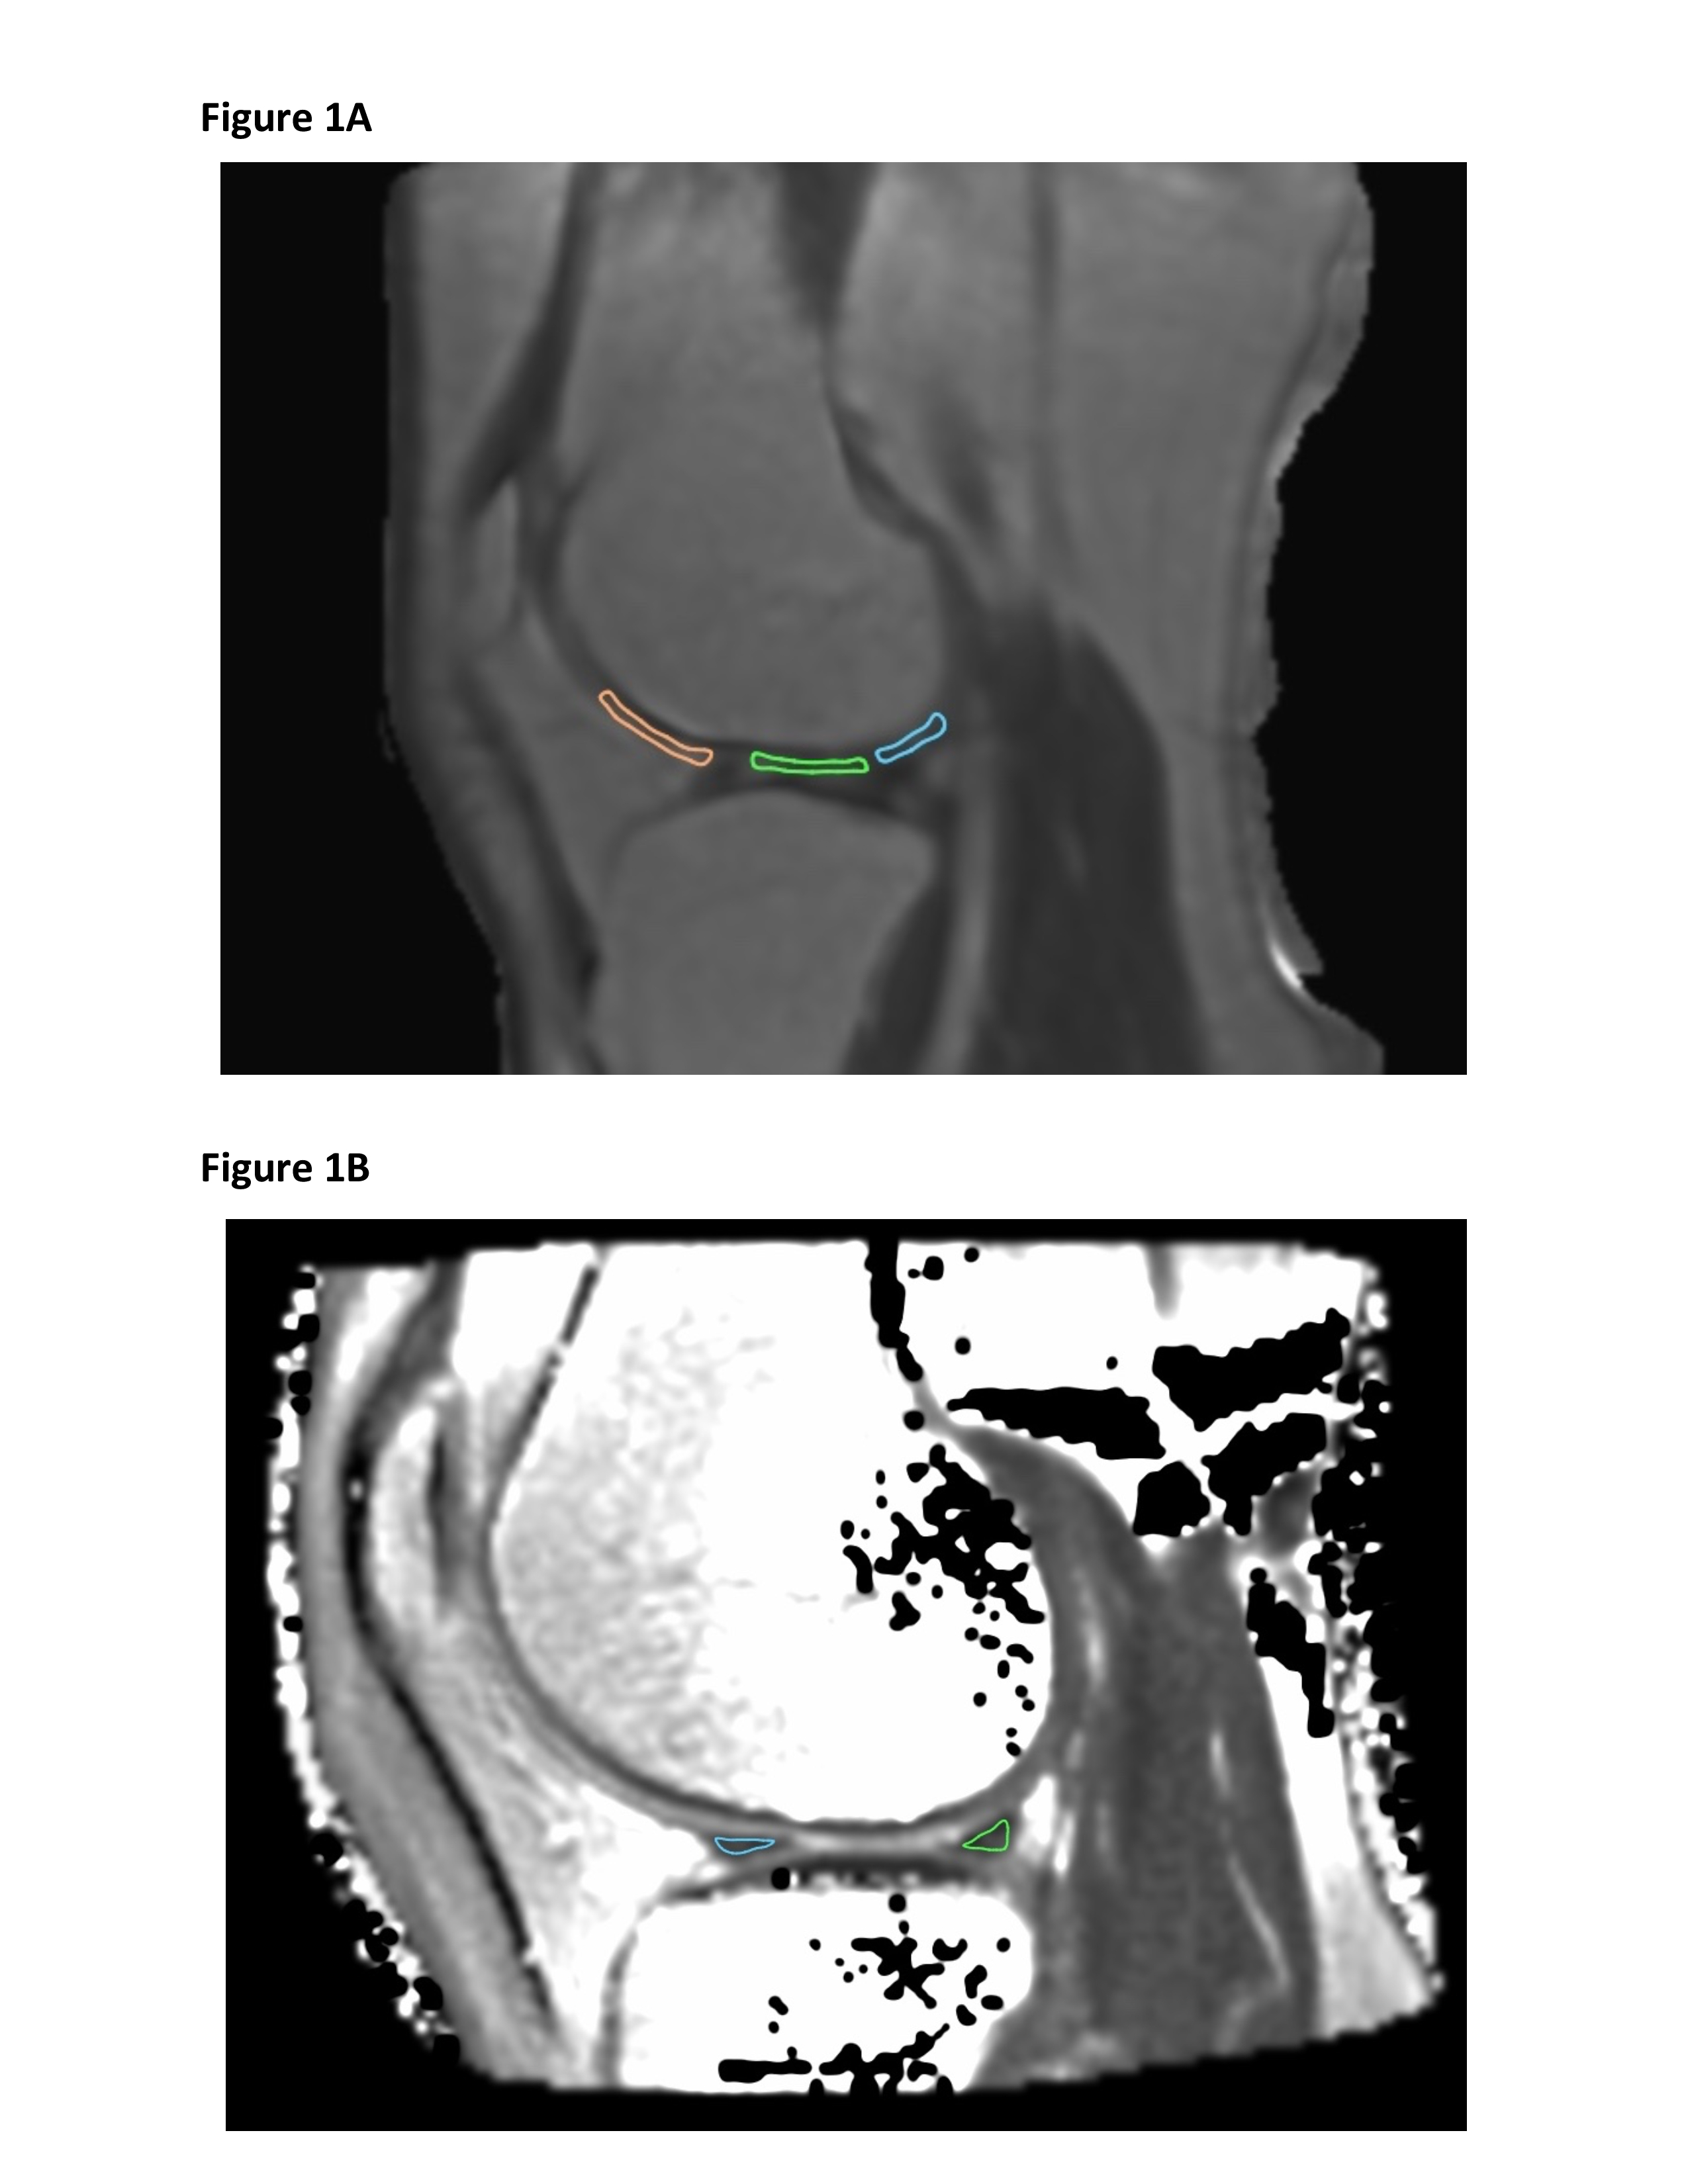
Figure 1A – T2 Map of the Knee with Regions of Interest (ROI’s) delineating Weight-Bearing (green), and Anterior (orange) and Posterior (blue) Less-Weight-Bearing Femoral Cartilage
Figure 1B – T1ρ Map of the Knee with ROIs delineating Anterior (blue) and Posterior (green) Horns of the Lateral Meniscus