3456
Cross-correlation between metabolites due to spectral overlap1National Institute of Mental Health, National Institutes of Health, Bethesda, MD, United States
Synopsis
It is shown that spectral overlap can cause an apparent correlation between metabolites regardless of underlying biological correlations or the lack thereof. Because MRS signals are often used to correlate with other MRS signals or clinical measures a theoretical framework is developed to estimate correlations originating from spectral overlap at long echo time. Monte Carlos simulations were also performed to quantify the correlations. Our results showed that significant correlations may occur even at long TE, when the contribution from macromolecule background becomes negligible. The proposed theoretical framework was proven to be useful for predicting cross-correlation coefficients originating from spectral overlap.
Introduction
Because of its intrinsically narrow spectral dispersion spectral overlap in proton MRS is often unavoidable, especially at medium and low magnetic field strengths. In clinical MRS correlations between MRS signals or between MRS signals and clinical measures have usually been considered to be of biological origins. In this work we show that spectral overlap can cause an apparent correlation between metabolites even at long echo times (TEs) with minimal additional overlap from the macromolecule baseline. Since cross-correlation due to spectral overlap confounds biological correlations a theoretical framework is developed to estimate correlations originating from spectral overlap. Subsequently, Monte Carlos simulations were performed to validate the proposed framework.Methods
Data generation A schematic flowchart of the Monte Carlo simulation pipeline is illustrated in Figure 1. Density matrix simulations incorporating 3D localization were used to generate metabolite spectra. The following metabolites resonating between 1.8 and 3.3 ppm were simulated using a PRESS sequence: aspartate, creatine (Cr), gamma aminobutyric acid (GABA), glutamate, glutamine, glutathione (GSH), glycerophosphocholine (GPC), phosphocholine (PCho), phosphocreatine (PCr), N-acetylaspartate (NAA), and N-acetylaspartylglutamate (NAAG). Relevant simulation parameters were as follows: magnetic field strength = 3 Tesla; spectral bandwidth = 2500 Hz; Shinnar-Le Roux (SLR) optimized excitation pulse (duration = 4 ms and bandwidth = 3000 Hz);1 amplitude-modulated refocusing pulse (duration = 8 ms and bandwidth = 2000 Hz);2 number of data points = 8192; and TE = 80 to 130 ms incremented by increasing TE2 while fixing TE1 to 20 ms. This long TE range was selected to minimize potential influence from macromolecule baseline. Reported metabolite concentrations3-5 and T2 relaxation times6-8 were incorporated. Subsequently progressive spectral degradation was performed by applying a line-broadening factor ranging from 4 to 10 Hz with an increment of 2 Hz and adding random white noise. The noise addition was repeated 2000 times for each group in the Monte-Carlo simulations to guarantee high statistical power.Data analysis Spectral quantification was performed using a linear combination model fitting algorithm. For pairs of severely overlapping metabolites including Cr-PCr, GPC-PCho, and NAA- NAAG, the summed values, total creatine (tCr), total choline (tCho), and total NAA (tNAA), were reported. The spectral fitting process was mathematically modeled using matrix equation $$$s=Bc$$$ where $$$s$$$ is the column vector representing the observed spectrum, $$$B$$$ is a matrix with each column comprised of the spectrum of a basis metabolite, and $$$c$$$ is a column vector comprised of metabolite concentrations. The theoretical cross-correlation between metabolites $$$i$$$ and $$$j$$$, is given by $$$r_{ij}=F_{ij}/\sqrt{F_{ii}F_{jj}}$$$ where $$$F=(B^{T}B)^{-1}$$$.
Results
Figure 2 compares cross-correlation coefficients predicted by matrix algebra and by Monte Carlo simulation. The values obtained by Monte Carlo simulation and theoretical calculation agree well. As shown in Figure 3, the CVs of three prominent peaks, tCho, tCr, and tNAA show gradual increases as TE becoming longer due to T2 relaxation decays. However, the CVs of J-coupled metabolites show a non-monotonic relationship with TE and approach a minimum at around 105-115 ms TEs due to J-evolution. Figure 4 plots cross-correlation coefficients between pairs of metabolites vs. TE. While the cross-correlation coefficients of tCho-tCr, tCho-NAA, and tCr-NAA show minimal variations, strong dependence on TE is observed in the cross-correlation coefficients for the glutamate-glutamine pair with zero-crossings at ca. 100-110 ms TE. Numerically calculated spectra of glutamate and glutamine at three TEs with four different linebroadening factors are shown in Figure 5. At 106 ms TE, the methylene resonances of glutamate and glutamine at around 2.42 ppm overlap with the opposite polarity contributing to positive correlations, whereas those at round 2.20 ppm overlap with the same polarity contributing to negative correlations, leading to an overall cross-correlation close to zero.Discussion
The present study showed that in the absence of any biological correlations (e.g., correlation between glutamate and glutamine due to their roles in the glutamate-glutamine cycle) significant apparent correlations may occur even at long TE with largely reduced spectral overlap. The presence of such spectral correlations confounds in vivo studies of biological correlations. The proposed theoretical framework and Monte Carlo simulations can be used to quantify cross-correlation coefficients originating from spectral overlap at long TE. It is expected that at shorter TE cross-correlation because of spectral overlap becomes more significant due to increased spectral overlap and the presence of overlapping macromolecule background. Future studies will address cross-correlations at shorter TEs.Acknowledgements
No acknowledgement found.References
1. Pauly J, Le Roux P, Nishimura D, Macovski A. Parameter relations for the Shinnar-Le Roux selective excitation pulse design algorithm [NMR imaging]. IEEE Trans Med Imaging 1991;10(1):53-65.
2. Murdoch JB, Lent AH, Kritzer MR. Computer-Optimized Narrow-Band Pulses for Multislice Imaging. J Magn Reson 1987;74(2):226-263.
3. Knight-Scott J, Brennan P, Palasis S, Zhong X. Effect of repetition time on metabolite quantification in the human brain in (1) H MR spectroscopy at 3 tesla. J Magn Reson Imaging 2017;45(3):710-721.
4. Rothman DL, Petroff OA, Behar KL, Mattson RH. Localized 1H NMR measurements of gamma-aminobutyric acid in human brain in vivo. Proc Natl Acad Sci U S A 1993;90(12):5662-5666.
5. Kreis R. Quantitative localized H-1 MR spectroscopy for clinical use. Prog Nucl Mag Res Sp 1997;31:155-195.
6. Wyss PO, Bianchini C, Scheidegger M, Giapitzakis IA, Hock A, Fuchs A, Henning A. In vivo estimation of transverse relaxation time constant (T2) of 17 human brain metabolites at 3T. Magn Reson Med 2018;80(2):452-461.
7. Zhang Y, Shen J. Simultaneous quantification of glutamate and glutamine by J-modulated spectroscopy at 3 Tesla. Magn Reson Med 2016;76(3):725-732.
8. Ganji SK, Banerjee A, Patel AM, Zhao YD, Dimitrov IE, Browning JD, Brown ES, Maher EA, Choi C. T2 measurement of J-coupled metabolites in the human brain at 3T. NMR Biomed 2012;25(4):523-529.
Figures
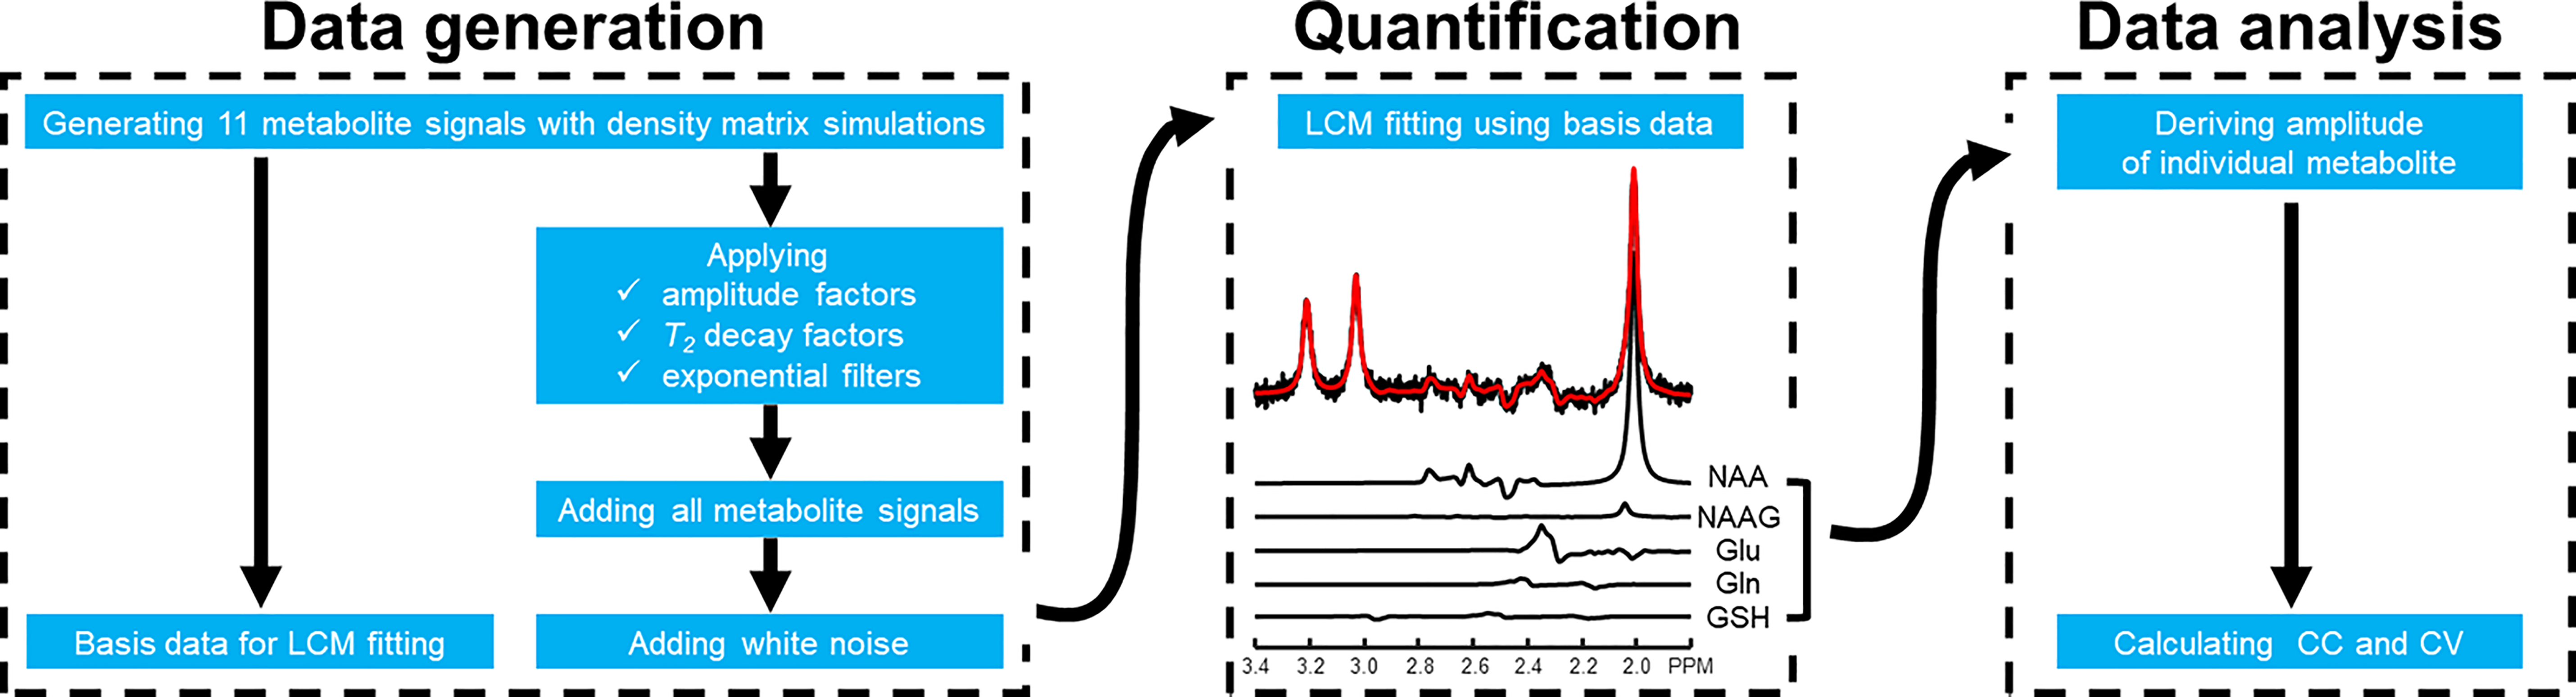
Figure 1. Schematic overview illustrating the Monte Carlo simulation pipeline composed of data generation, quantification, and analysis. First, density matrix simulations were performed to generate 11 metabolites. The same data were progressively degraded by line broadening and white noise addition. Subsequently, quantification was performed to calculate the concentration of individual metabolite. A representative spectrum and fitting result are shown. Finally, fitting metrices including cross-correlation coefficient and coefficient of variation were calculated.
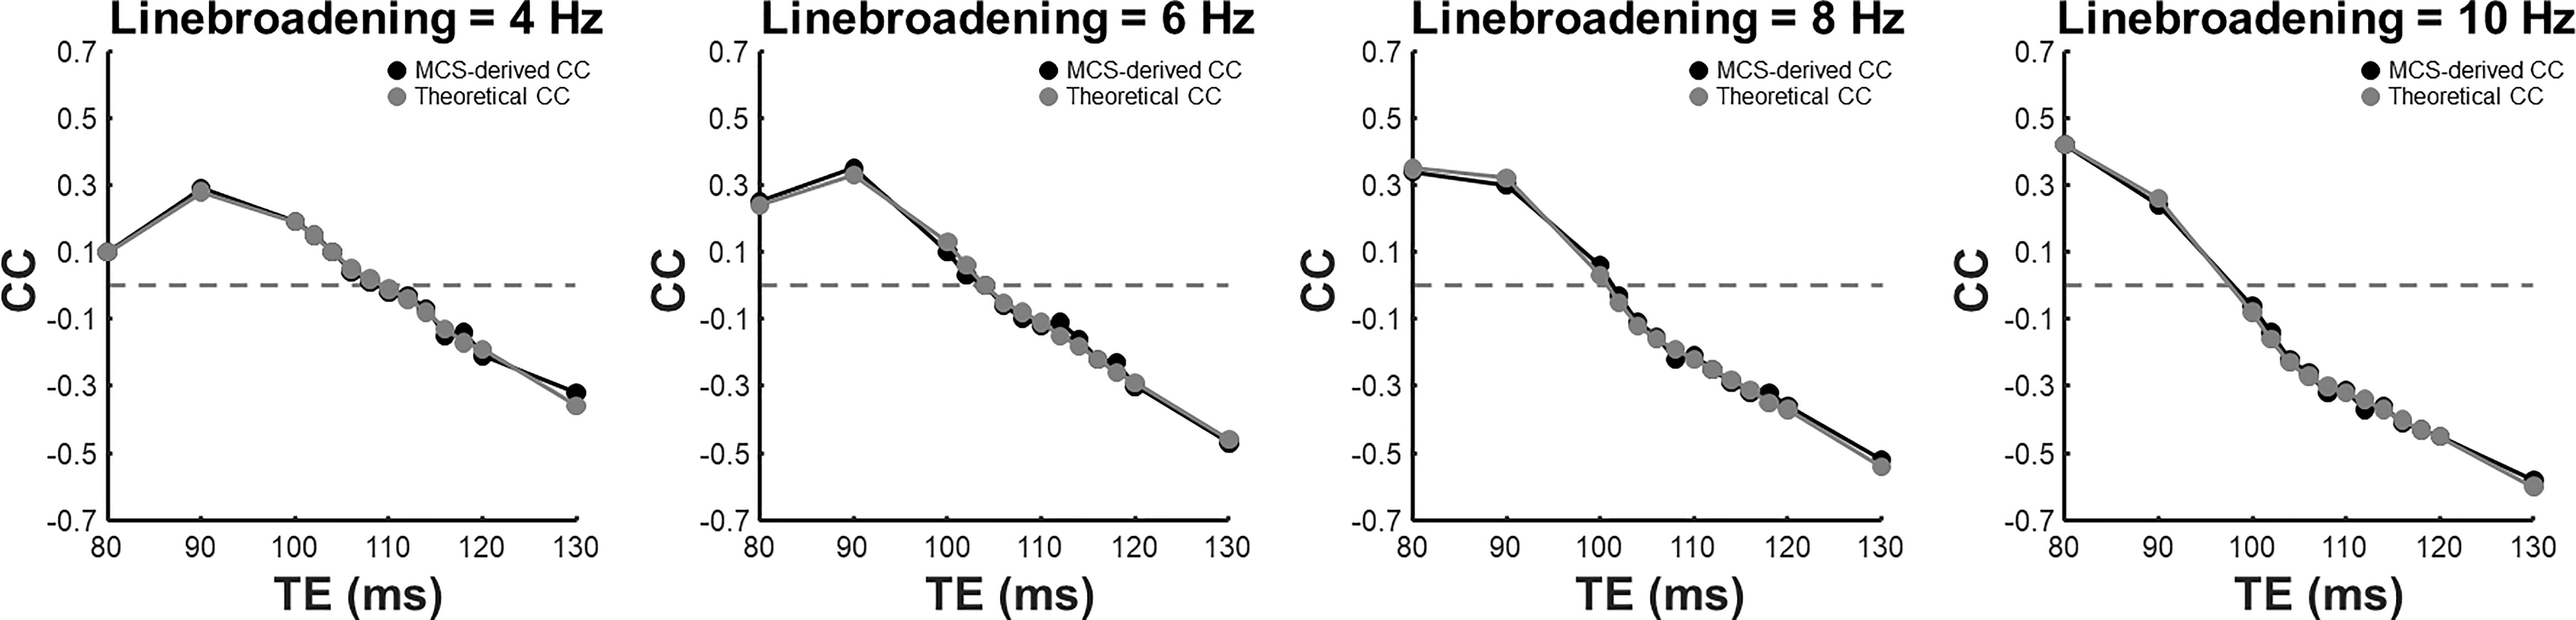
Figure 2. Cross-correlation coefficient (CC) of glutamate-glutamine derived with Monte-Carlo simulations (MCS) (black) and theoretical calculation (gray) with four different linebroadening factors ranging from 4 to 10 Hz. Horizontal dashed lines indicate zero CC.
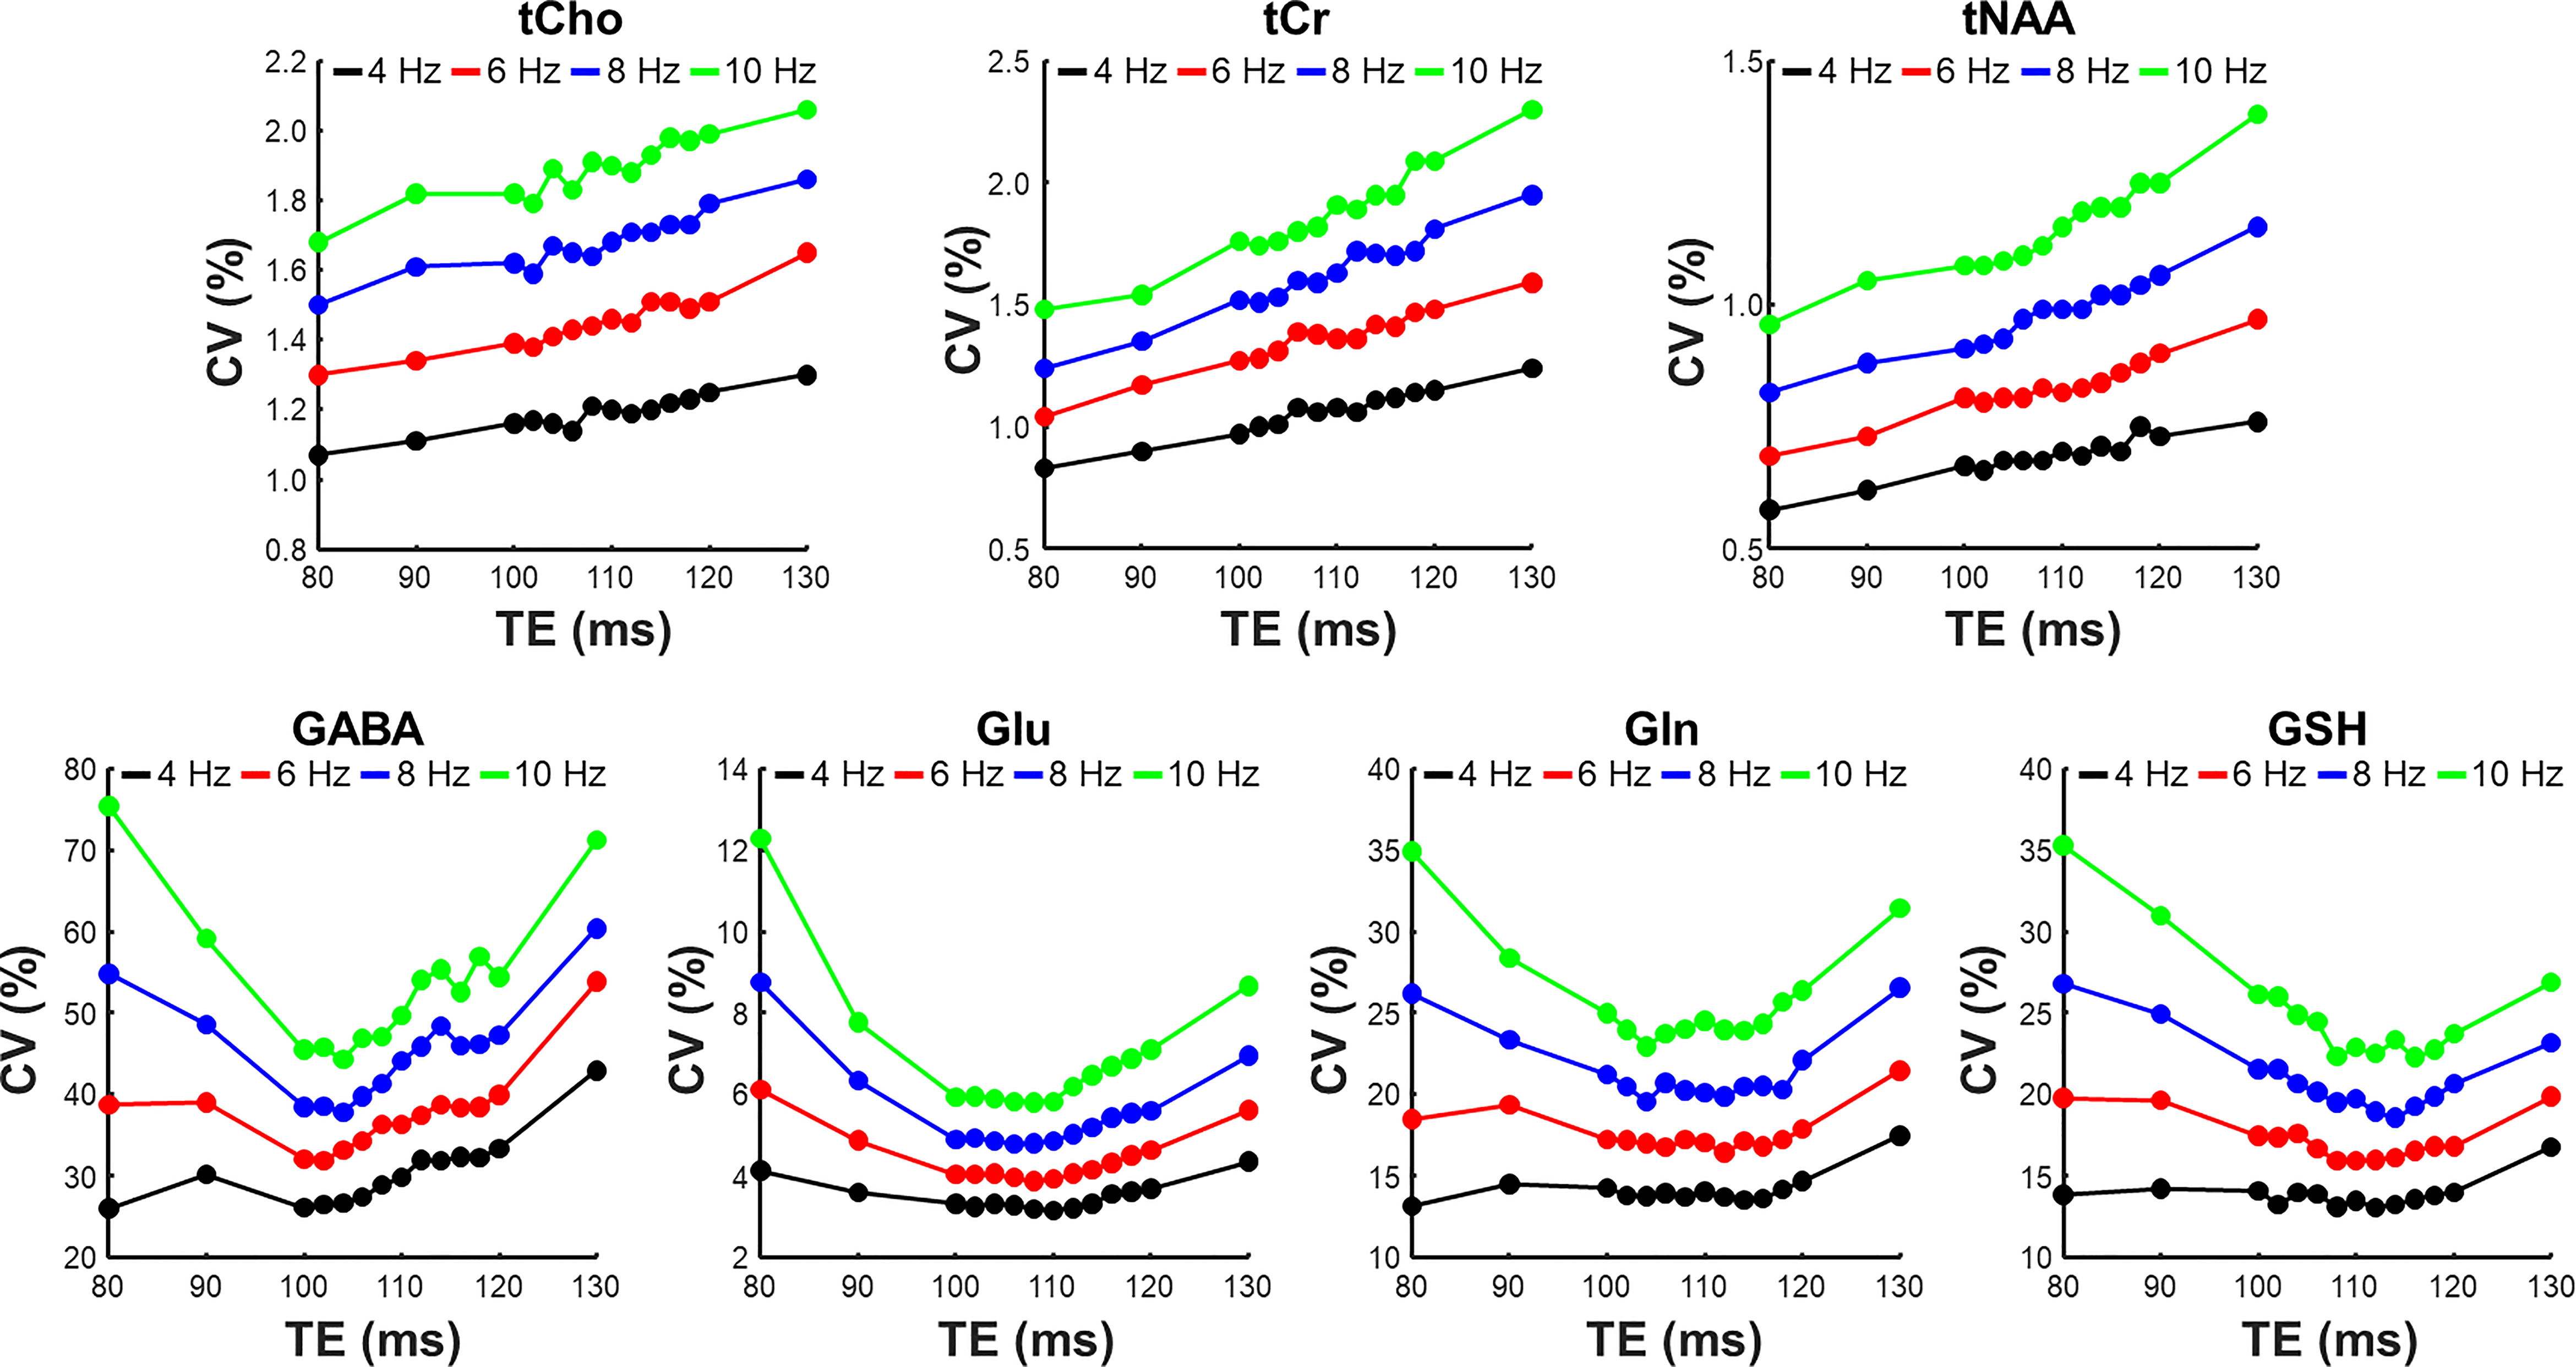
Figure 3. Plots of coefficient of variation (CV) versus echo time (TE) for tCho, tCr, tNAA, GABA, Glu, Gln, and GSH with four different linebroadening factors ranging from 4 to 10 Hz.
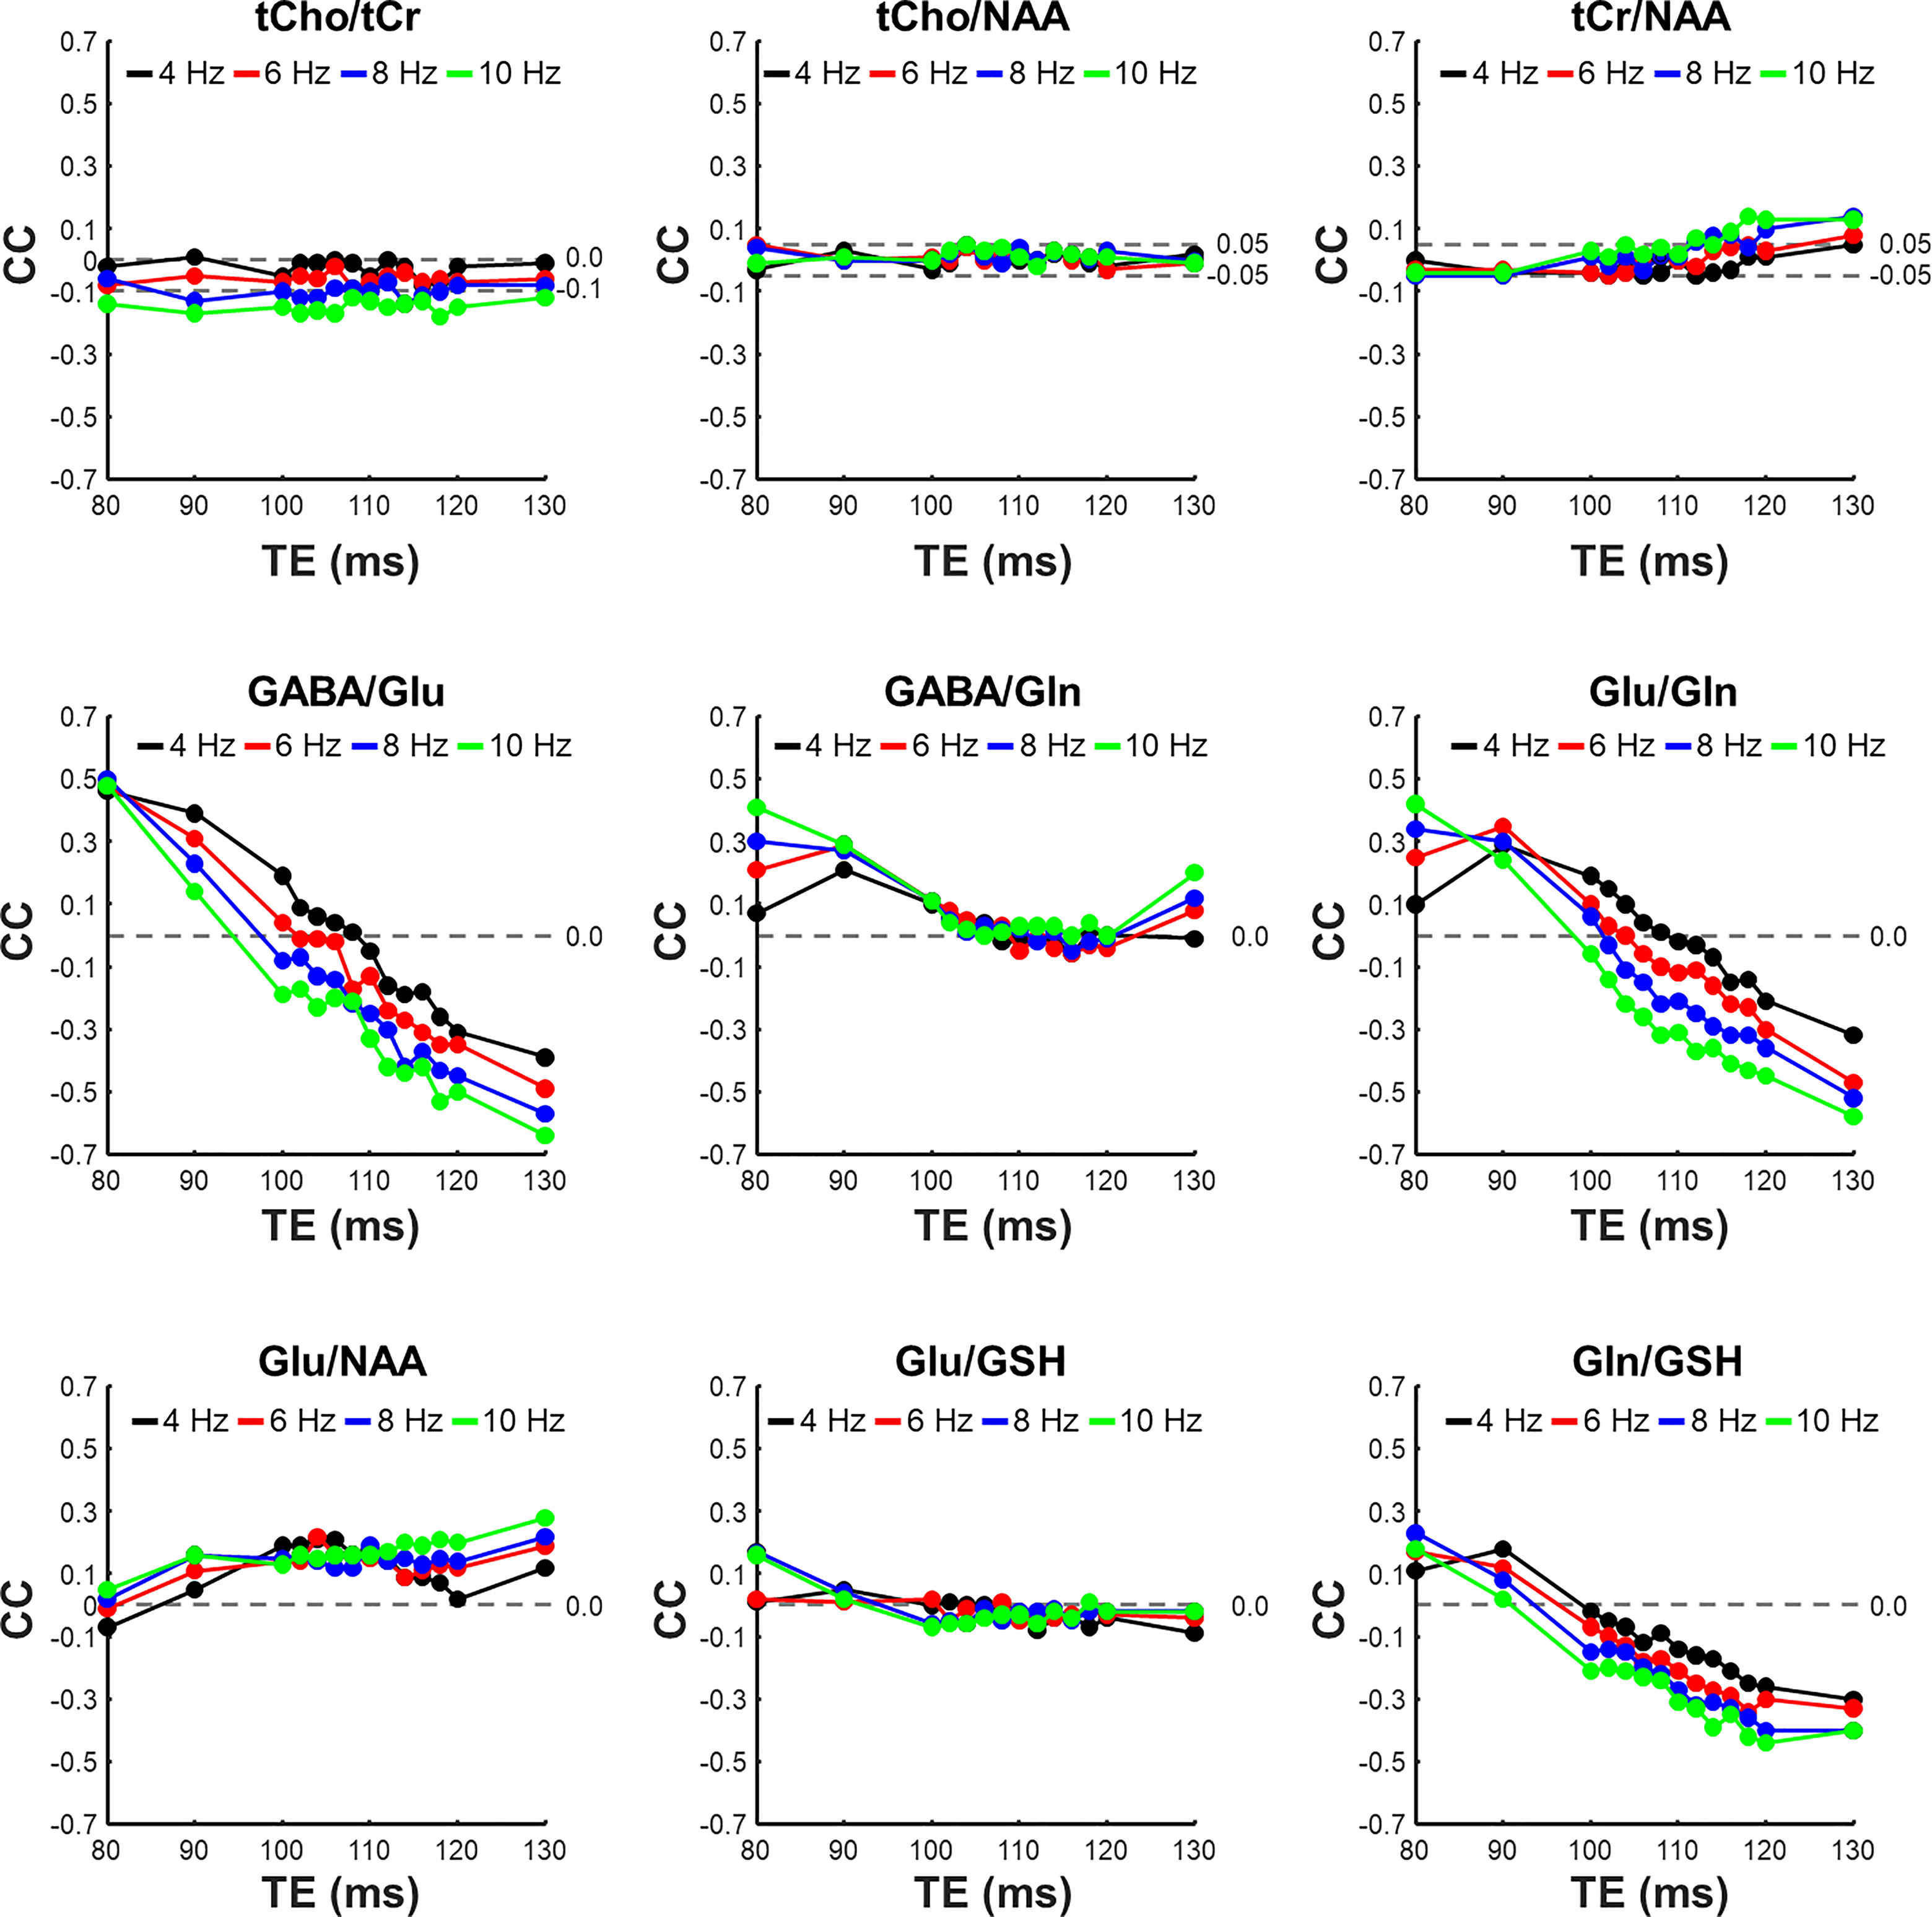
Figure 4. Plots of cross-correlation coefficient (CC) versus echo time (TE) for tCho-tCr, tCho-NAA, tCr-NAA, GABA-Glu, GABA-Gln, Glu-Gln, Glu-NAA, Glu-GSH, and Gln-GSH with four different linebroadening factors ranging from 4 to 10 Hz.
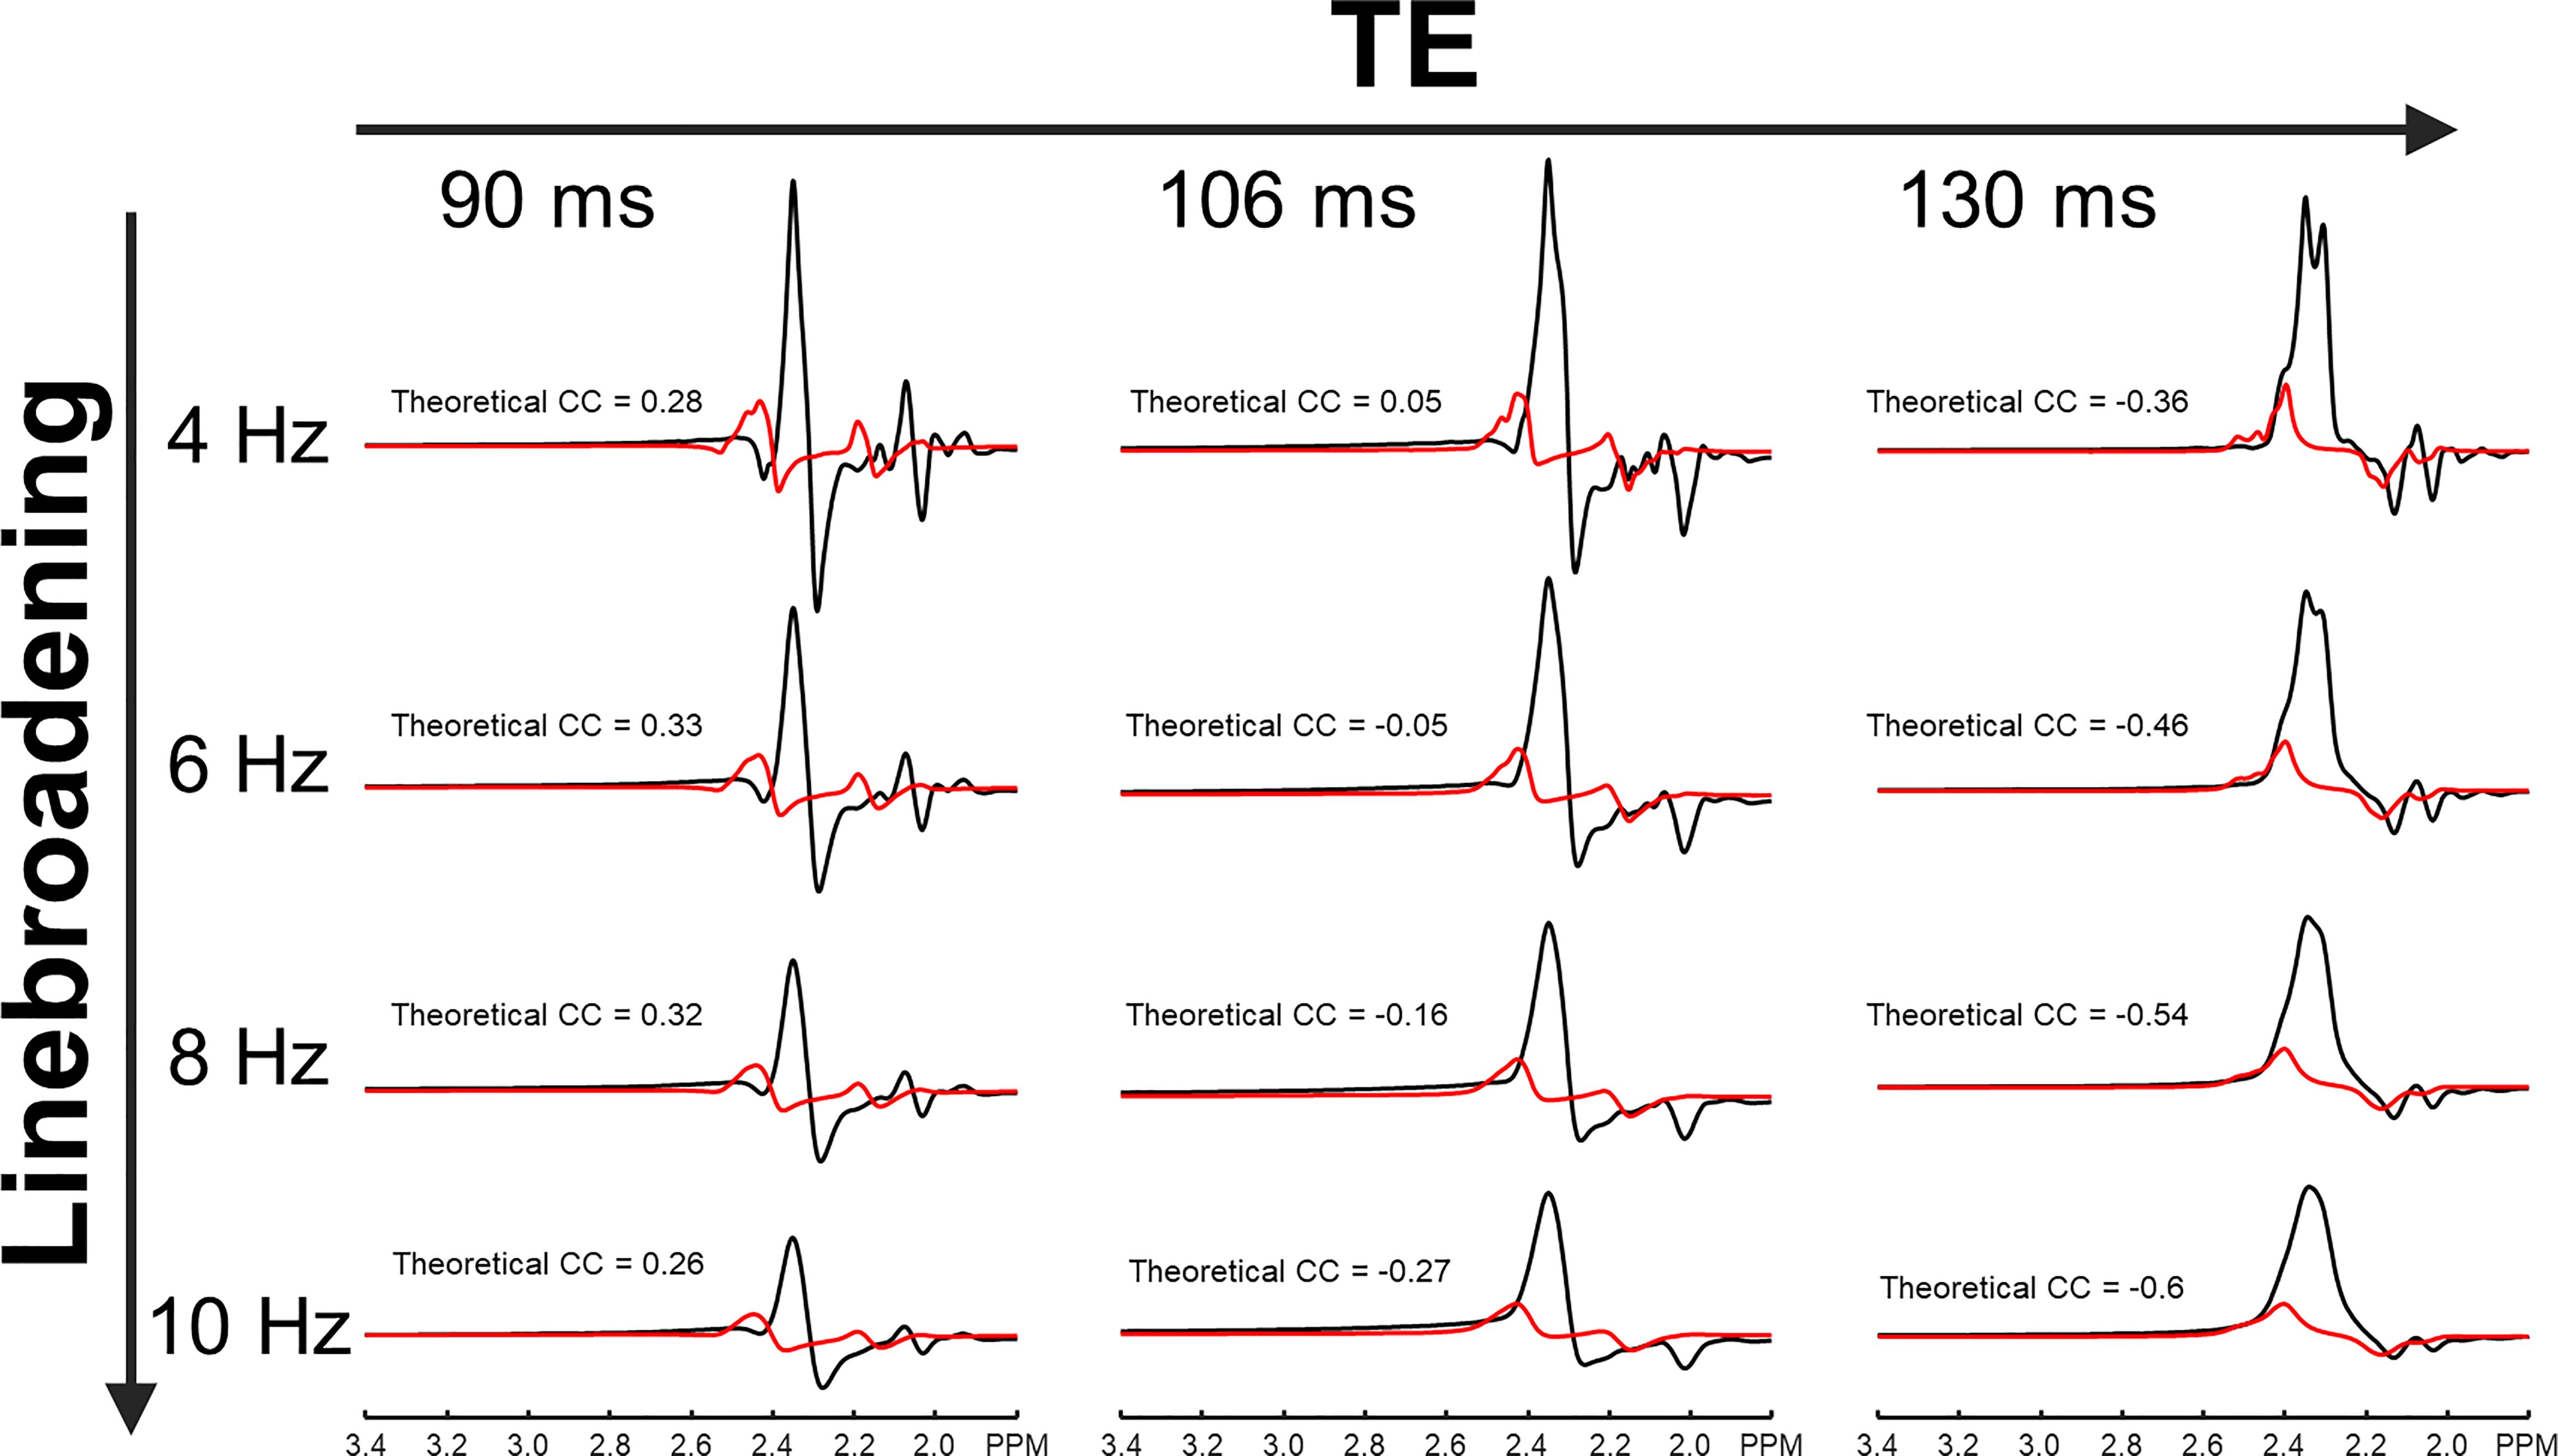
Figure 5. Numerically simulated spectra of glutamate (black line) and glutamine (red line) with four different linebroadening factors of 4 Hz (first row), 6 Hz (second row), 8 Hz (third row), and 10 Hz (fourth row) at three different echo times (TEs) of 90 ms (first column), 106 ms (second column), and 130 ms (third column). Theoretical CCs between glutamate and glutamine are given next to each spectrum.