3451
A Subspace EPTI Reconstruction with Magnitude-only Bases and Synergistic Phase Bias Updating for Distortion-Free Diffusion-Relaxometry MRI1Departmnet of Radiology, Stanford University, Stanford, CA, United States, 2Athinoula A. Martinos Center for Biomedical Imaging, Massachusetts General Hospital, Charlestown, MA, United States, 3Department of Radiology, Harvard Medical School, Boston, MA, United States, 4Departmnet of Electrical Engineering, Stanford University, Stanford, CA, United States
Synopsis
The distortion-free diffusion and relaxometry images provided by echo-planar time resolved imaging (EPTI) ) represent a valuable acquisition strategy for mapping brain tissue microstructure. However, given the large under-sampling factor of EPTI acquisition and the intrinsically low SNR of diffusion MRI, an SNR-efficient reconstruction is vital. Subspace reconstruction can improve SNR efficiency by reducing the number of unknowns. In subspace reconstruction, the selection of bases strongly affects the reconstruction image fidelity, SNR, and computational efficiency. Here, we explore a new subspace-based EPTI reconstruction with magnitude-only bases and synergistic phase bias updating and demonstrate its performance for microstructural mapping.
Purpose
Echo-planar time resolved imaging (EPTI) is a valuable tool for distortion-free diffusion and relaxometry imaging 1-6.Given the large under-sampling factor in the EPTI acquisition and the intrinsic low SNR of diffusion MRI, an SNR-efficient reconstruction is vital. Subspace reconstruction is an SNR-efficient approach by reducing the number of unknowns and thus improving the conditioning of the reconstruction2,3,6,7. In subspace reconstruction, the selection of bases is critical for reconstruction image fidelity, SNR, and computational efficiency, which can include only magnitude (“magnitude bases”) or both magnitude and phase (“complex bases”). Compared with the magnitude-only bases, complex bases can increase the accuracy of the reconstruction but at the cost of increasing number of bases, which may degrade the SNR performance and computational efficiency. A previous study has proposed to concatenate the subspace reconstructions with complex bases and magnitude bases to ensure the accuracy and SNR simultaneously 6. In this study, we aim to explore a new approach to ensure the accuracy and SNR of the subspace reconstruction, i.e., using magnitude-only bases together with a synergistic phase bias updating.Methods
EPTI AcquisitionData were acquired on a GE 3.0T Premier MRI scanner, using a 48-channel head coil and a custom diffusion prepared self-navigated EPTI sequence 5 (Fig. 1a). The imaging parameters were shown in Fig. 1b. A low-resolution fully sampled EPTI scan (Fig. 1c) was conducted as a calibration scan, to estimate the coil sensitivity map (Sj) and and the B0 inhomogeneity induced phases at each TE (PB0,k). A product single-shot EPI (ss-EPI) acquisition was conducted as a reference. In the ss-EPI acquisition, 3 extra b=0 volumes with reversed phase encoding directions were also acquired for distortion correction.
Subspace EPTI Reconstruction
The multi-TE diffusion MRI signal from EPTI acquisition can be formulated as:
$$\mathbf{d}_{i,j,k}=\mathbf{G}_{i}\mathbf{FS}_{j}\mathbf{P}_{B_{0},k}\mathbf{P}_{i}\mathbf{P}_{bias}\mathbf{m}_{k}. \left ( 1 \right )$$
where di,j,k is the multi-shot multi-channel diffusion k-space data at TEk, mk is the magnitude image at TEk, Pbias is the phase bias term from potentially dynamic B0 drift, eddy current and bias of the estimated motion induced phase from the navigator, Pi is the estimated motion induced phase from the navigator, PB0,k is the B0 inhomogeneity induced phase at different TEk (estimated from the time-resolved calibration scan), Sj is the sensitivity map, F is Fourier transform, G is data under-sampling operator of each shot.
The underlying principle of subspace reconstruction is that the multi-TE images mk (Necho×1) are strongly correlated temporally and can be represented by a few subspace bases φ (Necho×Nk) and coefficients c (Nk×1) 2,3,6,7. Since Nk is much smaller than Necho, the number of unknowns in the subspace reconstruction drops significantly, which improves the reconstruction conditioning.
The subspace EPTI reconstruction can be written as:
>$$\underset{\mathbf{c}}{min}\left \| \mathbf{G}_{i}\mathbf{FS}_{j}\mathbf{P}_{B_{0},k}\mathbf{P}_{i}\mathbf{\varphi }\mathbf{c} -\mathbf{d}_{i,j,k}\right \|^{2}+\lambda \left \| R\left ( \mathbf{c} \right ) \right \|_{*}. \left ( 2 \right )$$
where the first term is data consistency and the second term is locally low-rank regularization on c, λ is the regularization parameter.
If incorporating Pbias in the subspace approximation, then the subspace basesφ and coefficients c in “complex format”. Alternatively, if excluding Pbias from the subspace approximation (either ignoring Pbias or updating Pbias separately), then the subspace bases φ' and coefficients c' will be “magnitude format”.
Given Eq. 2 is bilinear in terms of Pbias and c, we will explore the alternating minimization with respect to Pbias and c' to solve the above problem. Specifically, in each iteration, we first solve the subproblem regarding c' using locally low-rank constrains (Eq. 2) 2,3,6,7. Then the subproblem w.r.t. is
$$\underset{\mathbf{\mathbf{P}_{bias}}}{min}\left \| \mathbf{G}_{i}\mathbf{FS}_{j}\mathbf{P}_{B_{0},k}\mathbf{P}_{i}\mathbf{m' }\mathbf{P}_{bias} -\mathbf{d}_{i,j,k}\right \|^{2}. \left ( 3 \right )$$
with m' =abs(φ'c') is the magnitude of φ'c'. Eq. 3 can be solved using gradient descent 8 or phase cycling 9,10.
Image Processing
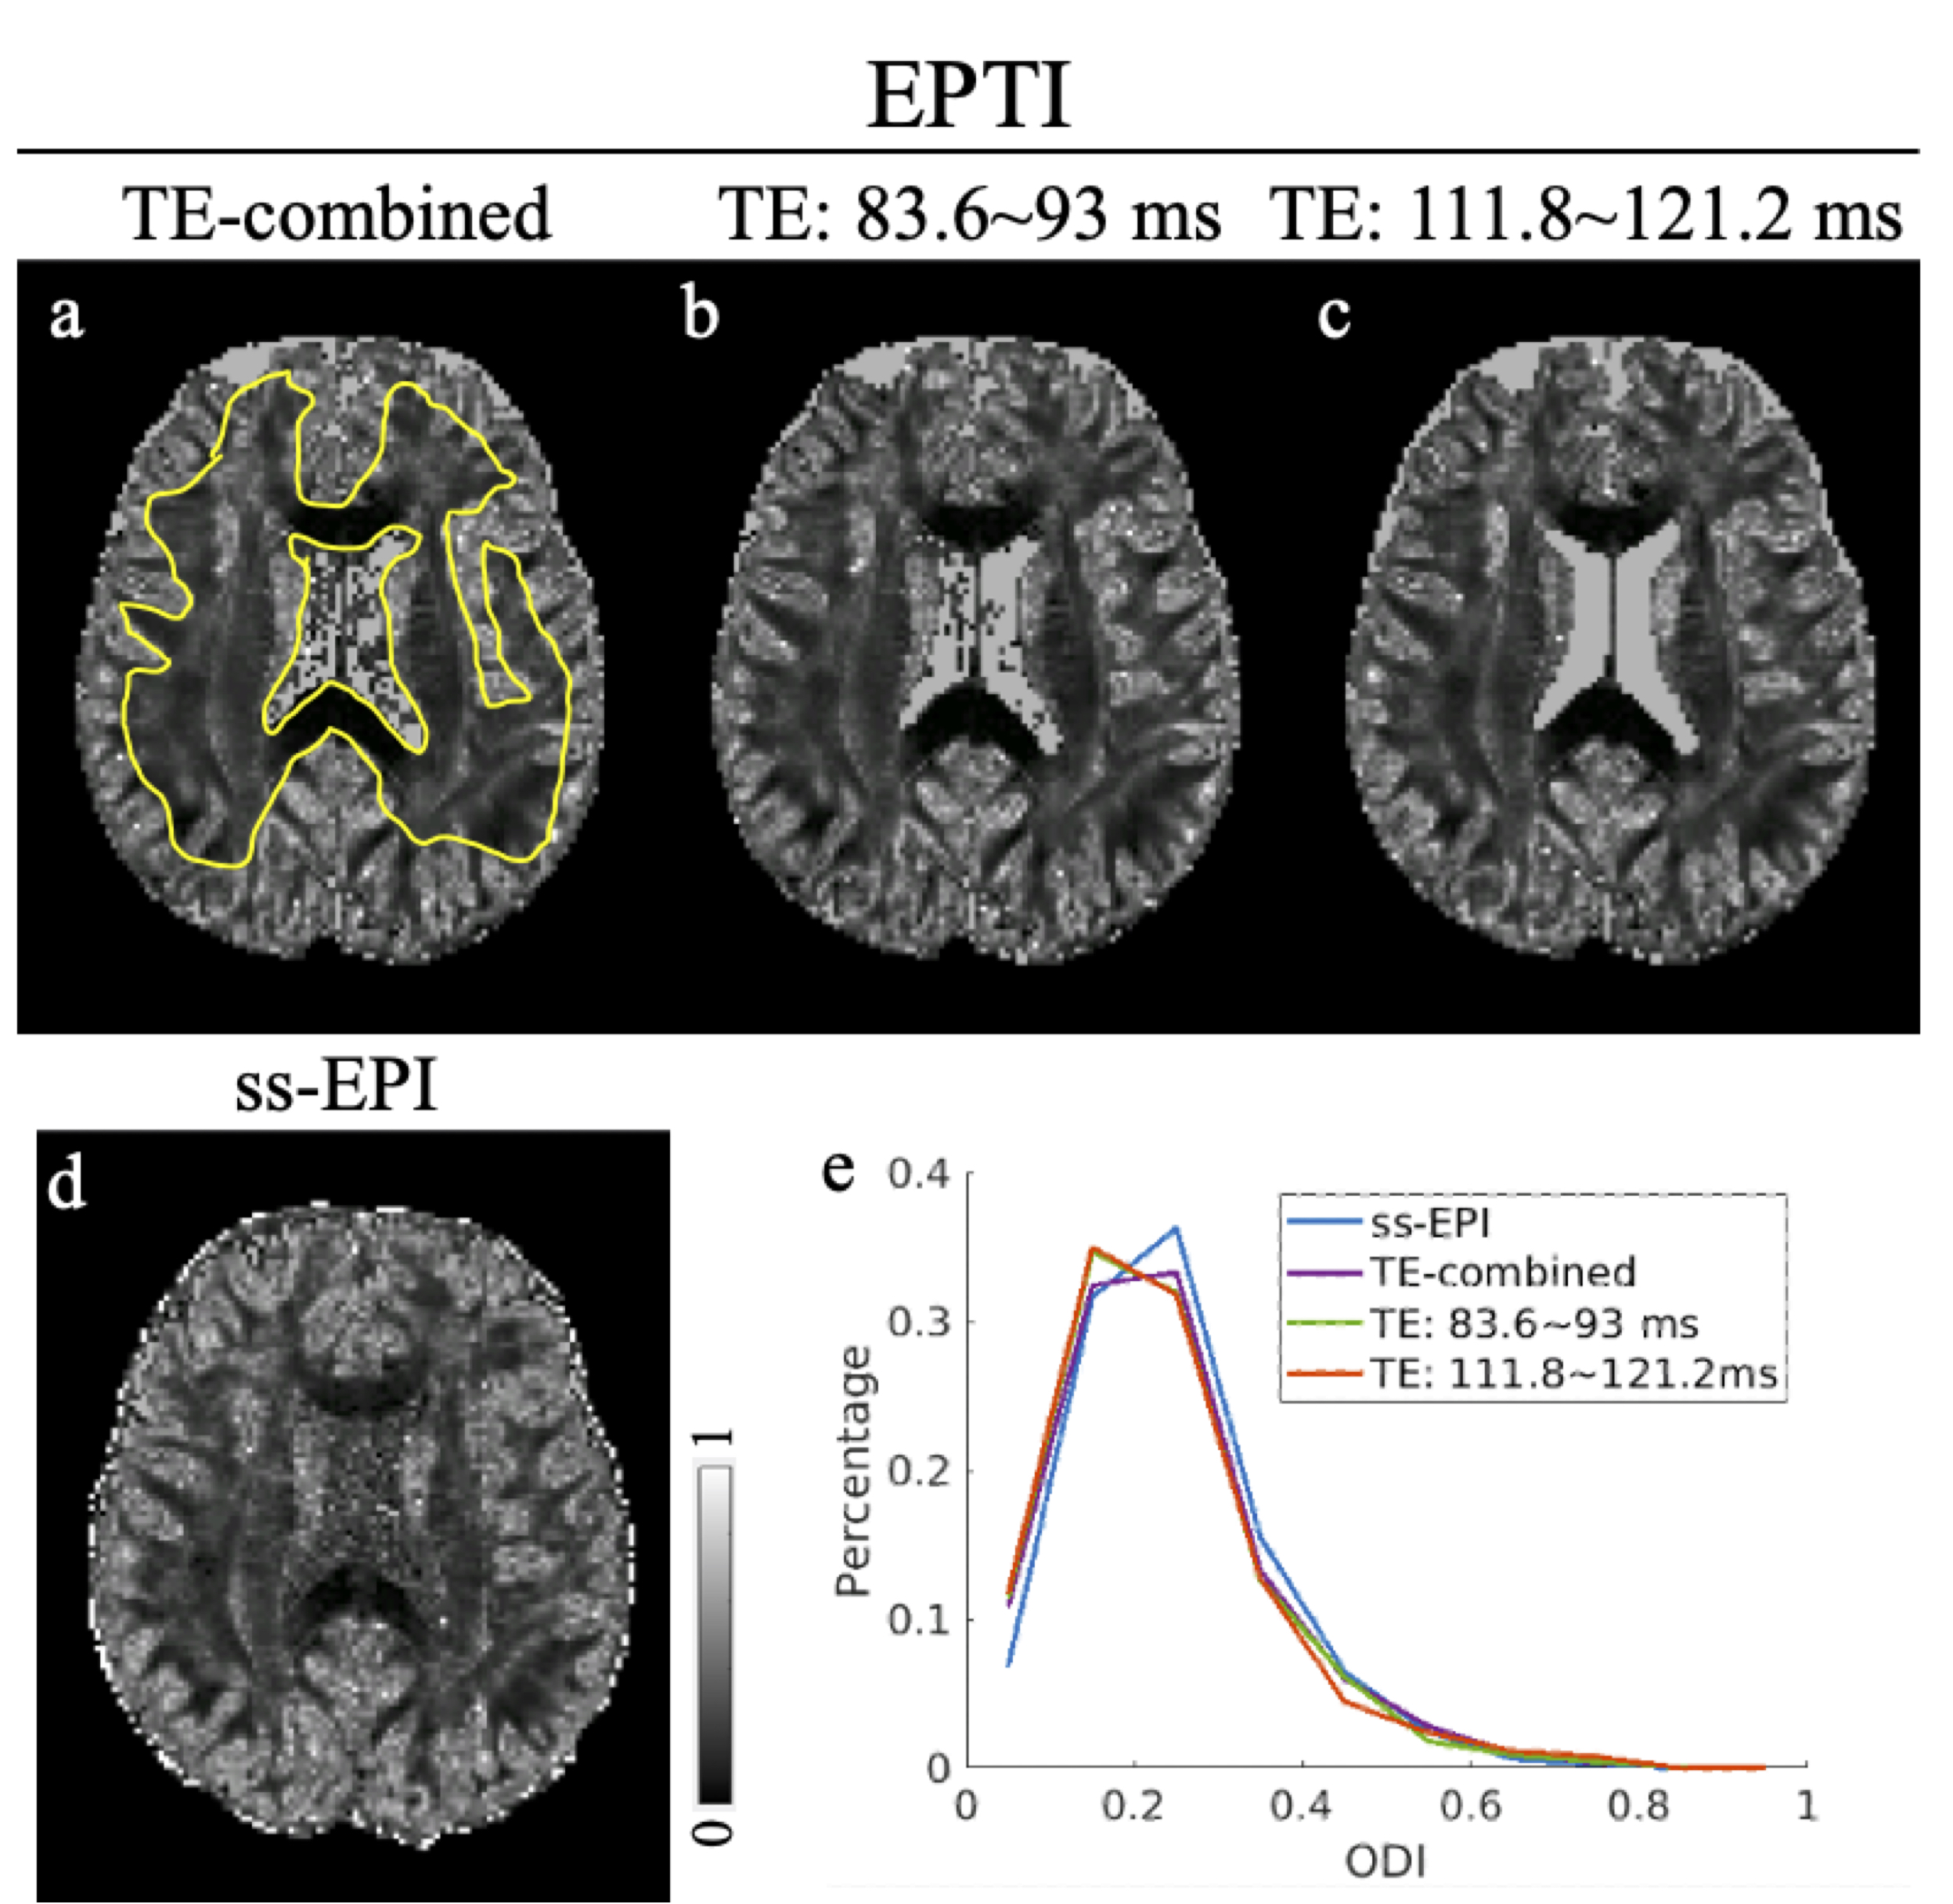
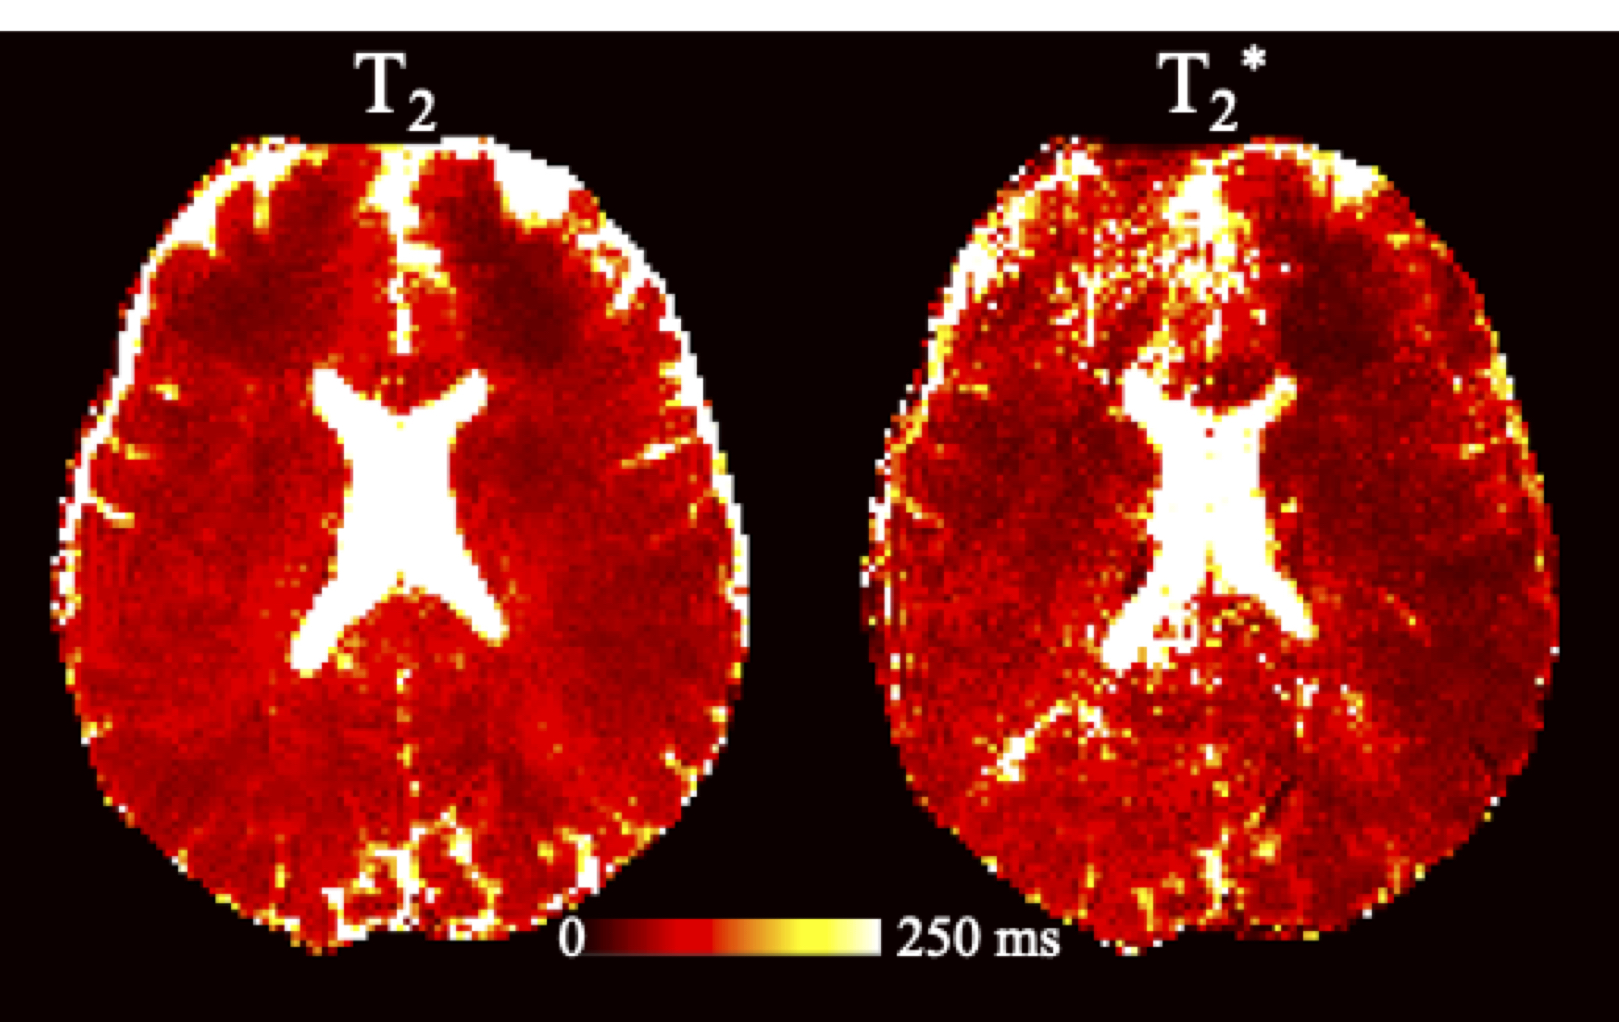
The ss-EPI images were first preprocessed with FSL TOPUP11 and EDDY12 for distortion and eddy current correction. DTI metrics (FA and MD) were calculated with the b=0 and 1000 s/mm2 data 13. Orientation dispersion index (ODI) maps were calculated with b=0, 1000 and 2500 s/mm2 data with the NODDI model 14. For DTI and NODDI calculation, images at 12 adjacent TEs were averaged prior to model fitting for higher SNR purpose. For EPTI data, T2 and T2* maps were estimated using a custom Matlab script.
Results
Fig. 2 shows the FA and color-coded FA comparisons between (a) ss-EPI and (b-d) EPTI acquisition. Three EPTI results with the raw images combined from different TE ranges are shown: (b) from all TEs, (c) from TEs=83.6~93 ms, and (d) from TEs=111.8~121.2 ms. The FA results from EPTI with the new reconstruction match well with the ss-EPI reference both visually and quantitatively (histogram in Fig. 2e).The MD maps (Fig. 3) and ODI maps (Fig. 4) are also consistent well between EPTI and the ss-EPI. Fitted T2 and T2*maps from EPTI are shown in Fig. 5.
Discussion & Conclusion
Our preliminary results show that the subspace reconstruction with magnitude bases and synergistic phase bias updating can be a promising approach for high-efficacy EPTI reconstruction. Our future work includes comparing this work thoroughly with other EPTI reconstructions. We will also leverage the SNR gains from the EPTI and subspace reconstruction to evaluate more about the TE-dependent diffusion changes.Acknowledgements
This study is funded by GE Healthcare and the Focused Ultrasound Foundation.References
1. Wang F, Dong Z, Reese TG, et al. Echo planar time-resolved imaging (EPTI). Magn Reson Med 2019;81:3599-3615.
2. Dong Z, Wang F, Reese TG, Bilgic B, Setsompop K. Echo planar time-resolved imaging with subspace reconstruction and optimized spatiotemporal encoding. Magn Reson Med 2020;84:2442-2455.
3. Dong Z, Wang F, Chan KS, et al. Variable flip angle Echo Planar Time-Resolved Imaging (vFA-EPTI) for fast high-resolution gradient echo myelin water imaging. Neuroimage 2021117897.
4. Fair MJ, Liao C, Manhard MK, Setsompop K. Diffusion-PEPTIDE: Distortion- and blurring-free diffusion imaging with self-navigated motion-correction and relaxometry capabilities. Magn Reson Med 2021;85:2417-2433.
5. Dai E, Lee PK, Dong Z, et al. Distortion-Free Diffusion Imaging Using Self-Navigated Cartesian Echo-Planar Time Resolved Acquisition and Joint Magnitude and Phase Constrained Reconstruction. IEEE Trans Med Imaging 2021;PP:1-1.
6. Dong Z, Wang F, Wald L, Setsompop K. SNR-efficient distortion-free diffusion relaxometry imaging using ACcelerated Echo-train shifted EPTI (ACE-EPTI). bioRxiv 20212021.2008.2027.457992.
7. Tamir JI, Uecker M, Chen W, et al. T2 shuffling: Sharp, multicontrast, volumetric fast spin-echo imaging. Magn Reson Med 2017;77:180-195.
8. Hu Y, Wang X, Tian Q, et al. Multi-shot diffusion-weighted MRI reconstruction with magnitude-based spatial-angular locally low-rank regularization (SPA-LLR). Magn Reson Med 2020;83:1596-1607.
9. Bilgic B, Chatnuntawech I, Manhard MK, et al. Highly accelerated multishot echo planar imaging through synergistic machine learning and joint reconstruction. Magn Reson Med 2019;82:1343-1358.
10. Ong F, Cheng JY, Lustig M. General phase regularized reconstruction using phase cycling. Magn Reson Med 2018;80:112-125.
11. Andersson JLR, Skare S, Ashburner J. How to correct susceptibility distortions in spin-echo echo-planar images: application to diffusion tensor imaging. NeuroImage 2003;20:870-888.
12. Andersson JLR, Sotiropoulos SN. An integrated approach to correction for off-resonance effects and subject movement in diffusion MR imaging. NeuroImage 2016;125:1063-1078.
13. Jenkinson M, Beckmann CF, Behrens TE, Woolrich MW, Smith SM. Fsl. Neuroimage 2012;62:782-790.
14. Zhang H, Schneider T, Wheeler-Kingshott CA, Alexander DC. NODDI: practical in vivo neurite orientation dispersion and density imaging of the human brain. Neuroimage 2012;61:1000-1016.
Figures
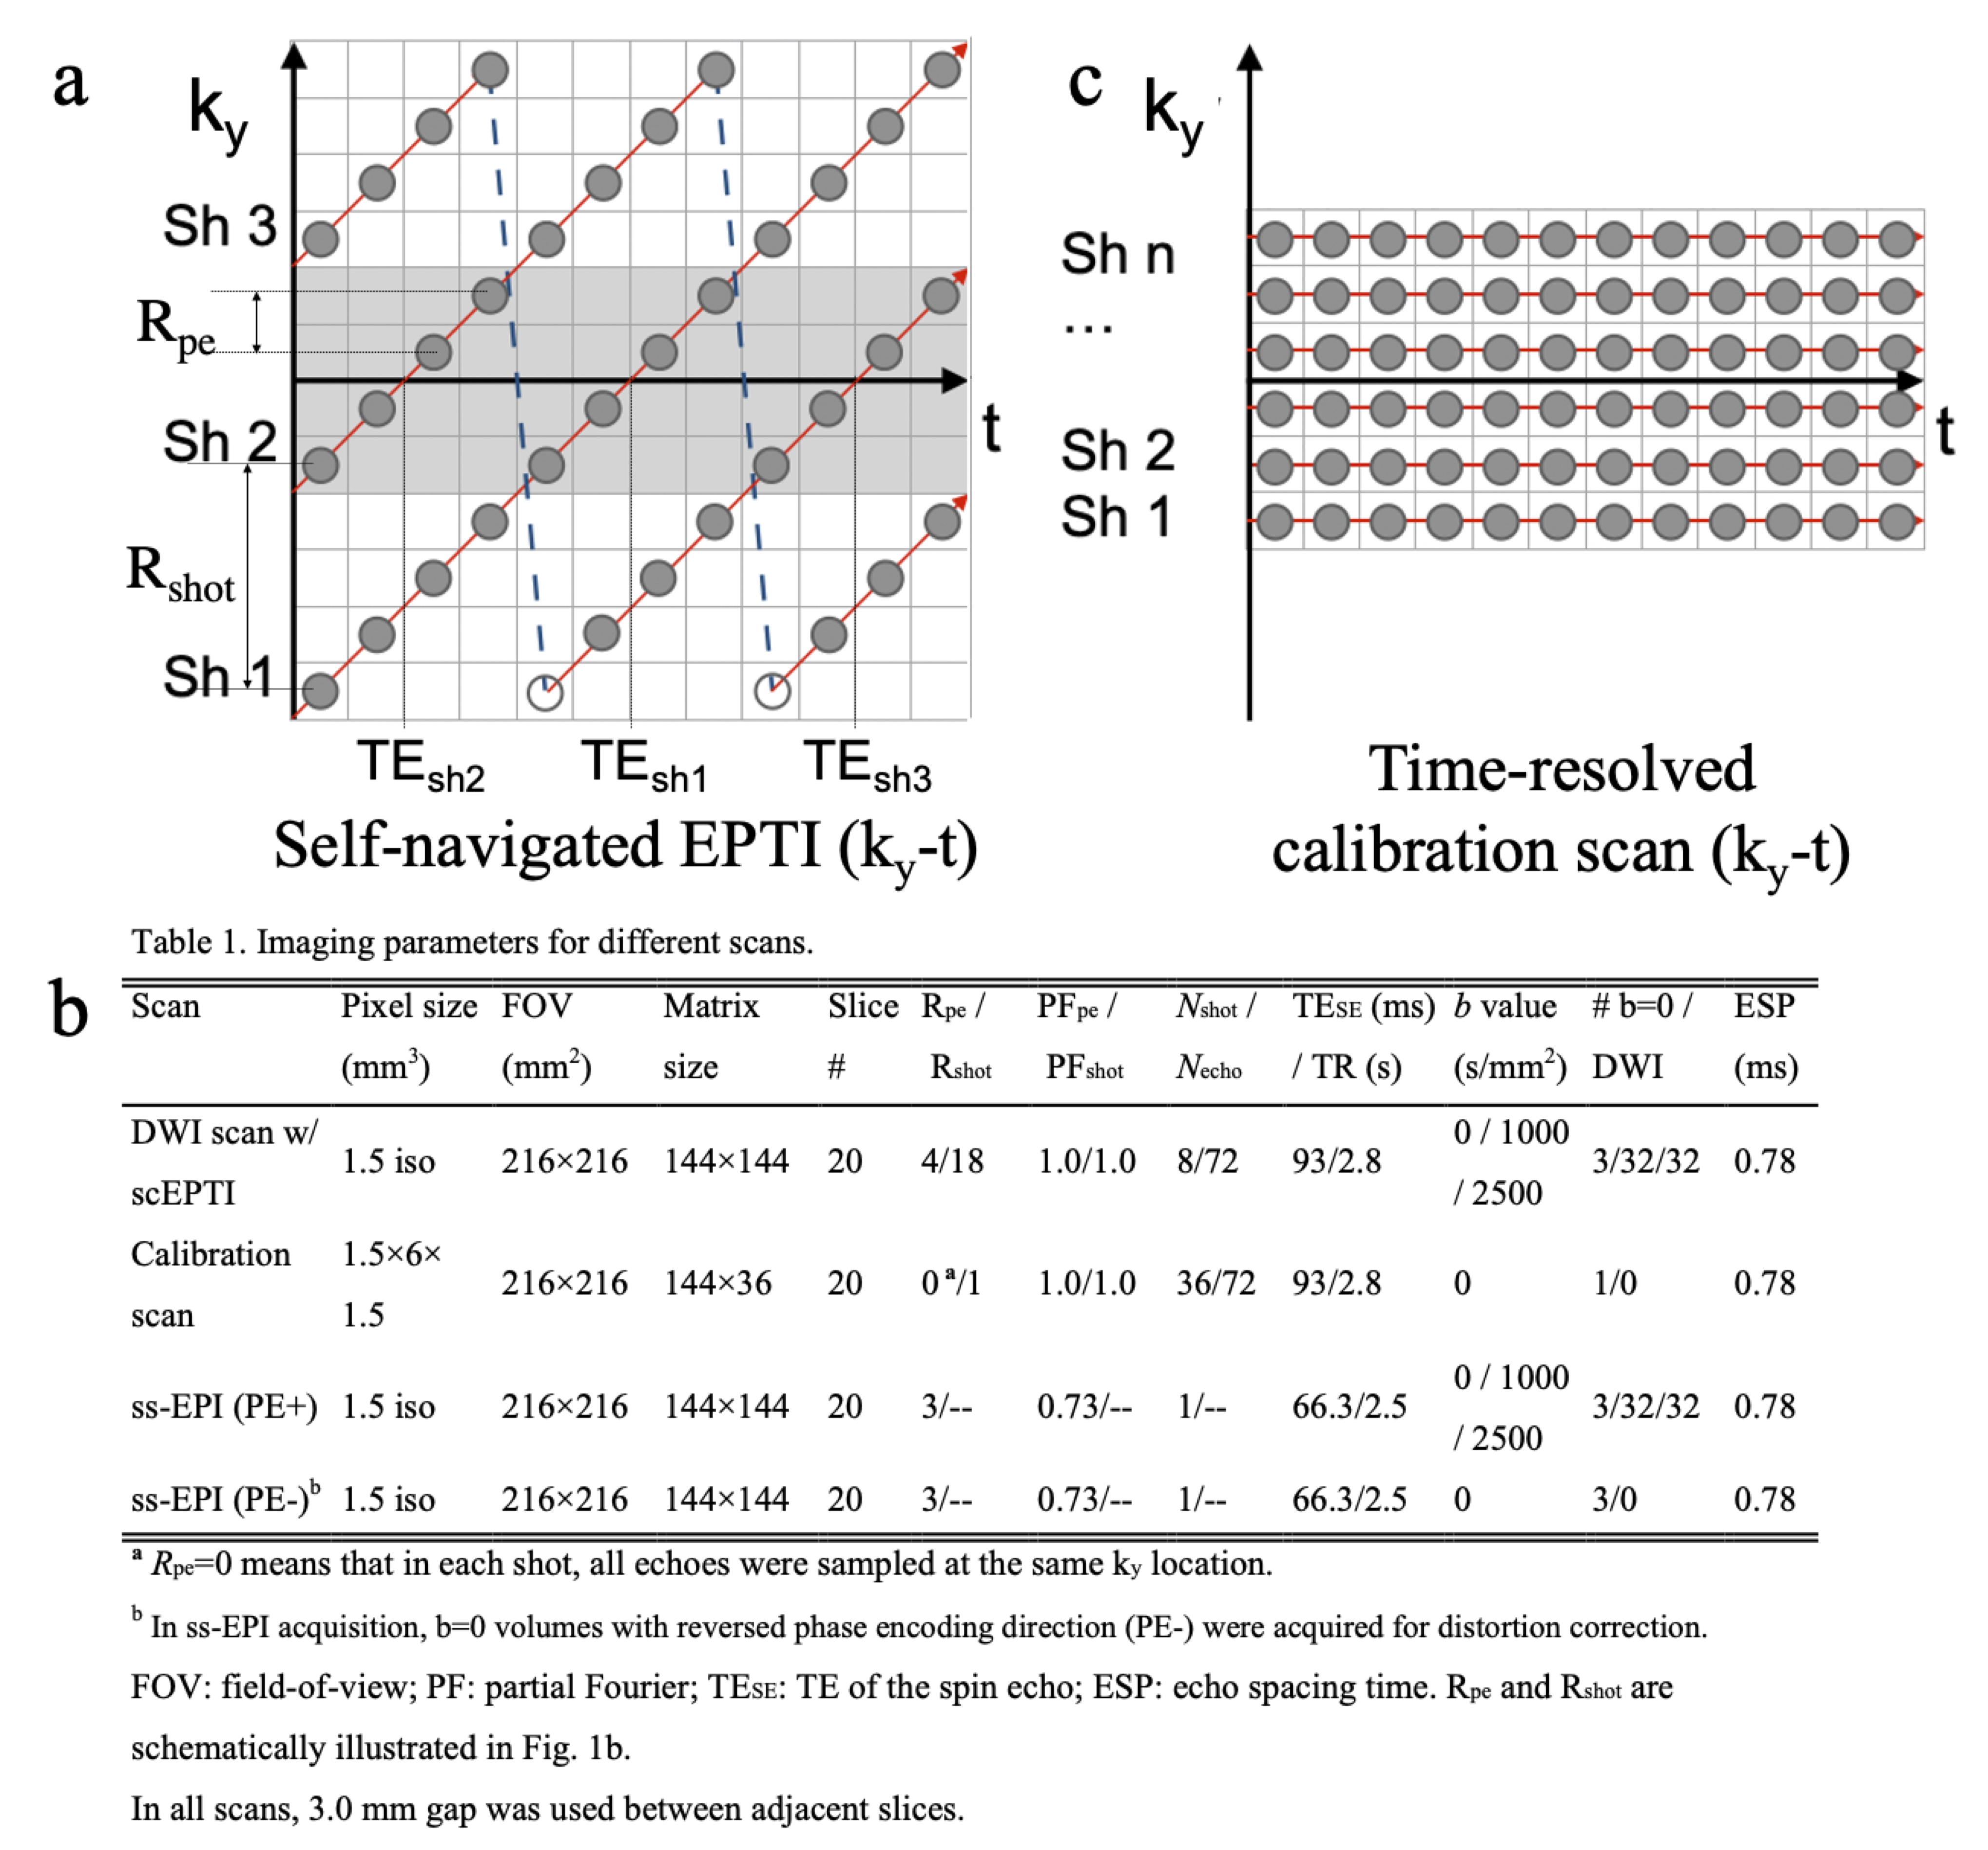
Figure 1: (a) The sampling trajectories of self-navigated Cartesian-based EPTI (scEPTI) sequence in this study. (b) The detailed parameters of the diffusion and calibration scans. (c) The fully sampled time-resolved 2D calibration scan. Rpeand Rshot are schematically illustrated in Fig. 1b. The grey region in Fig. 1b can be used to estimate the motion induced phase information in each shot.
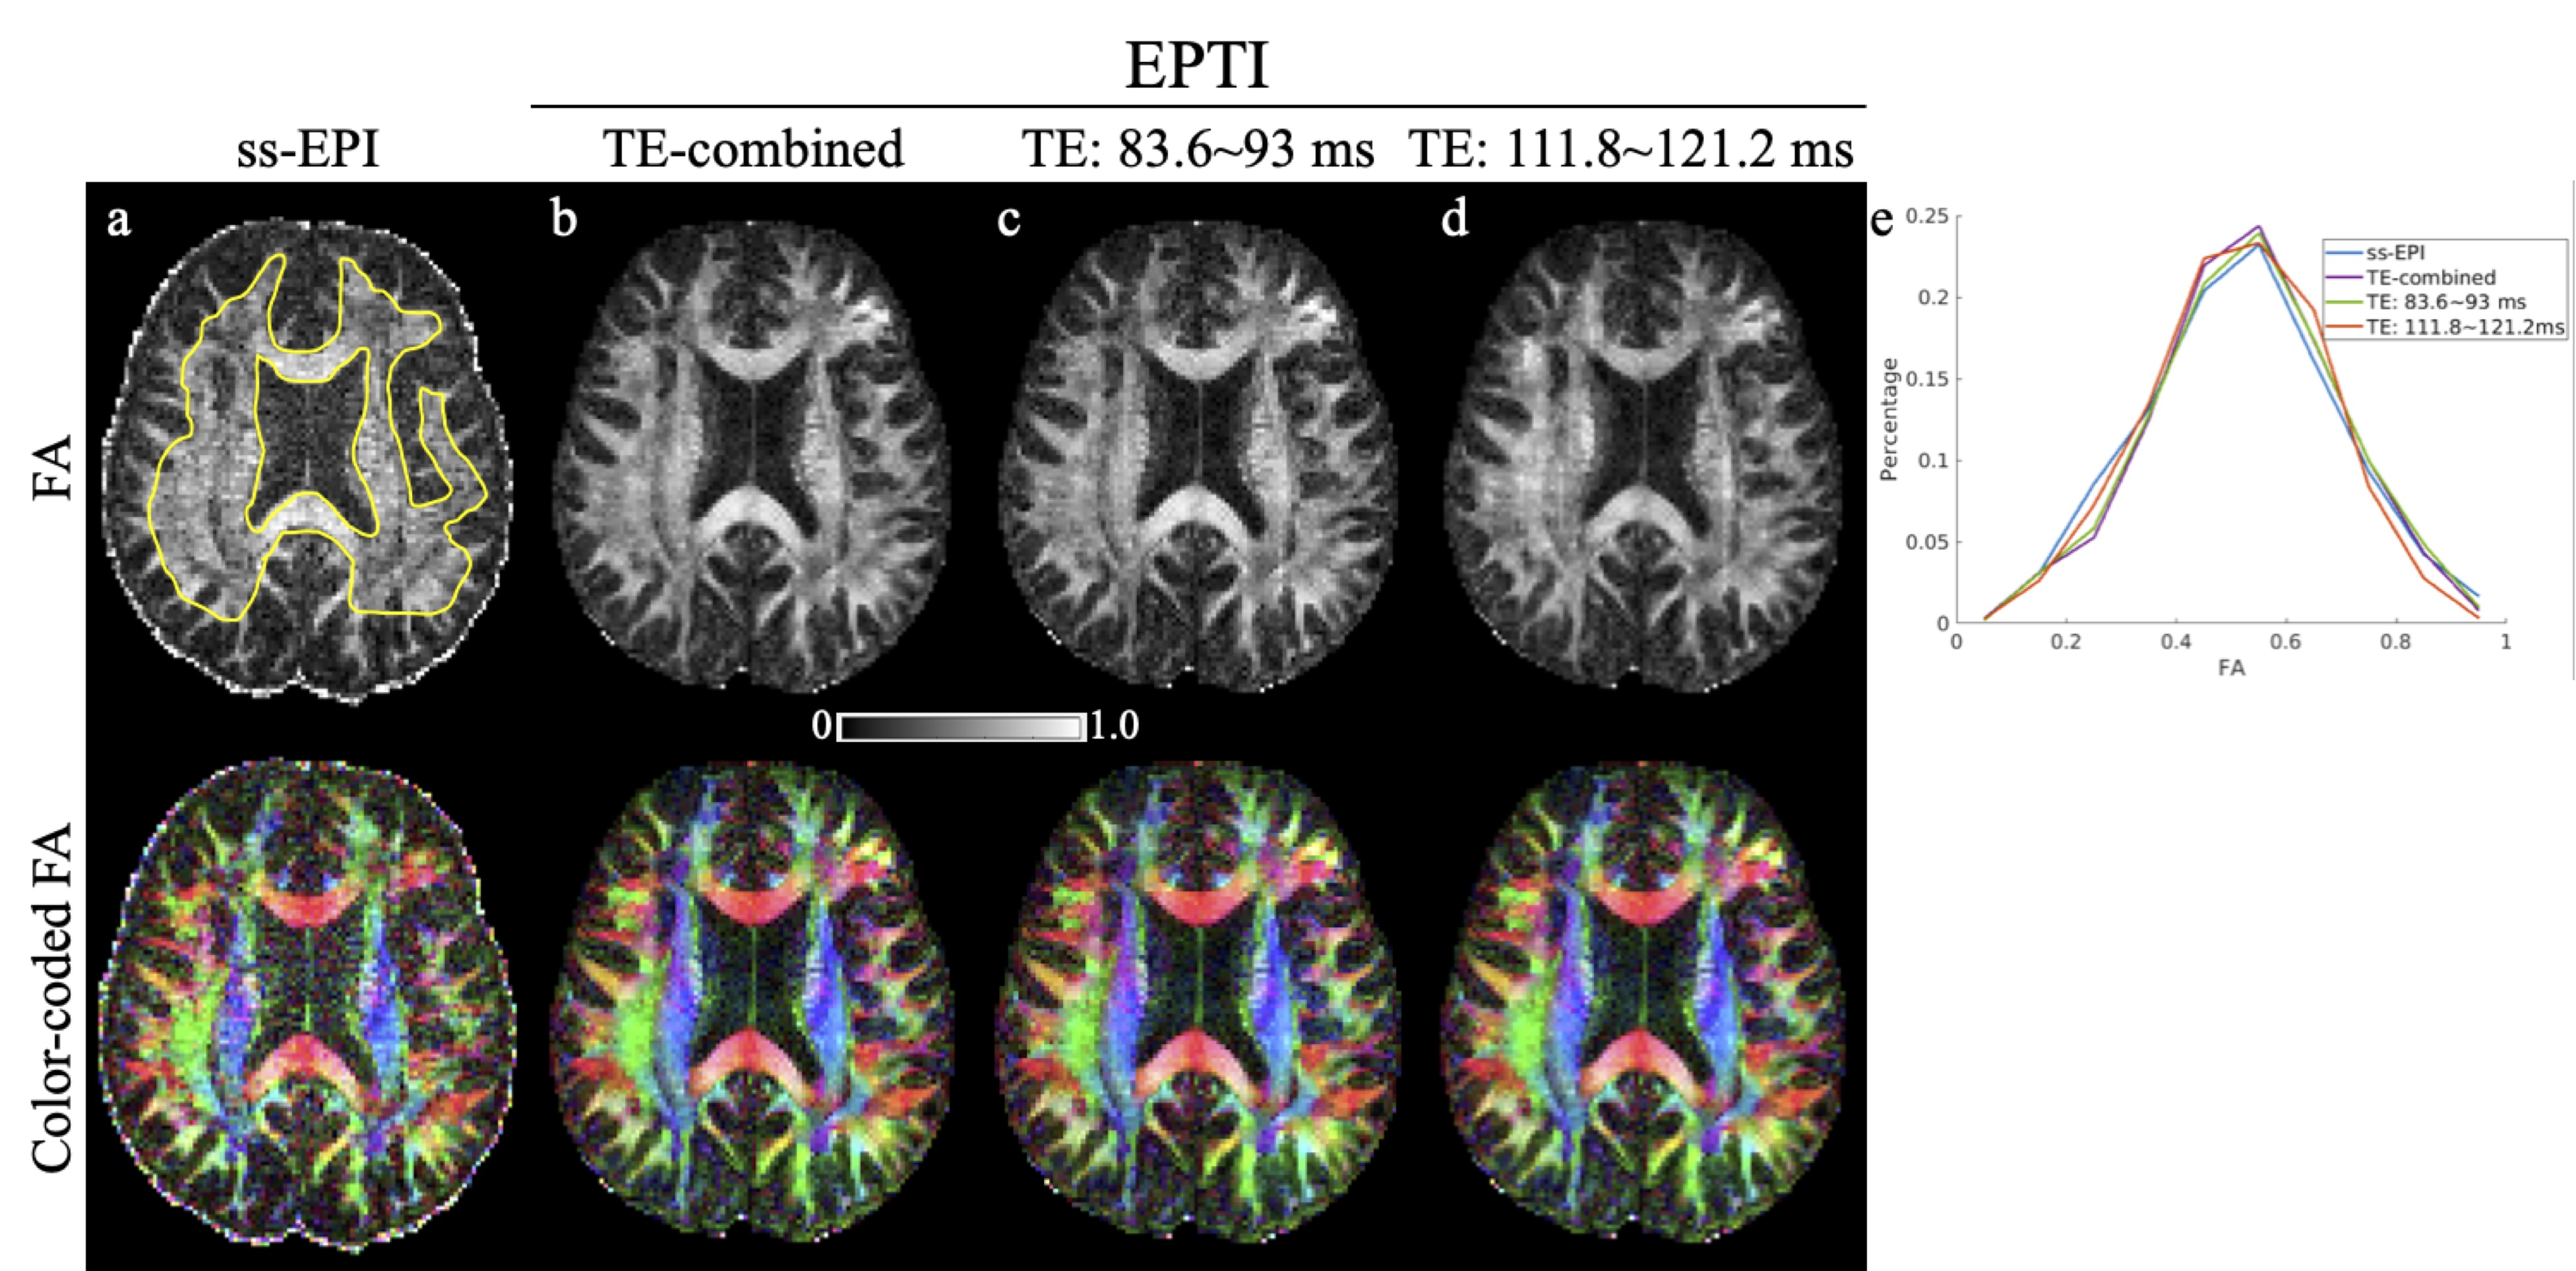
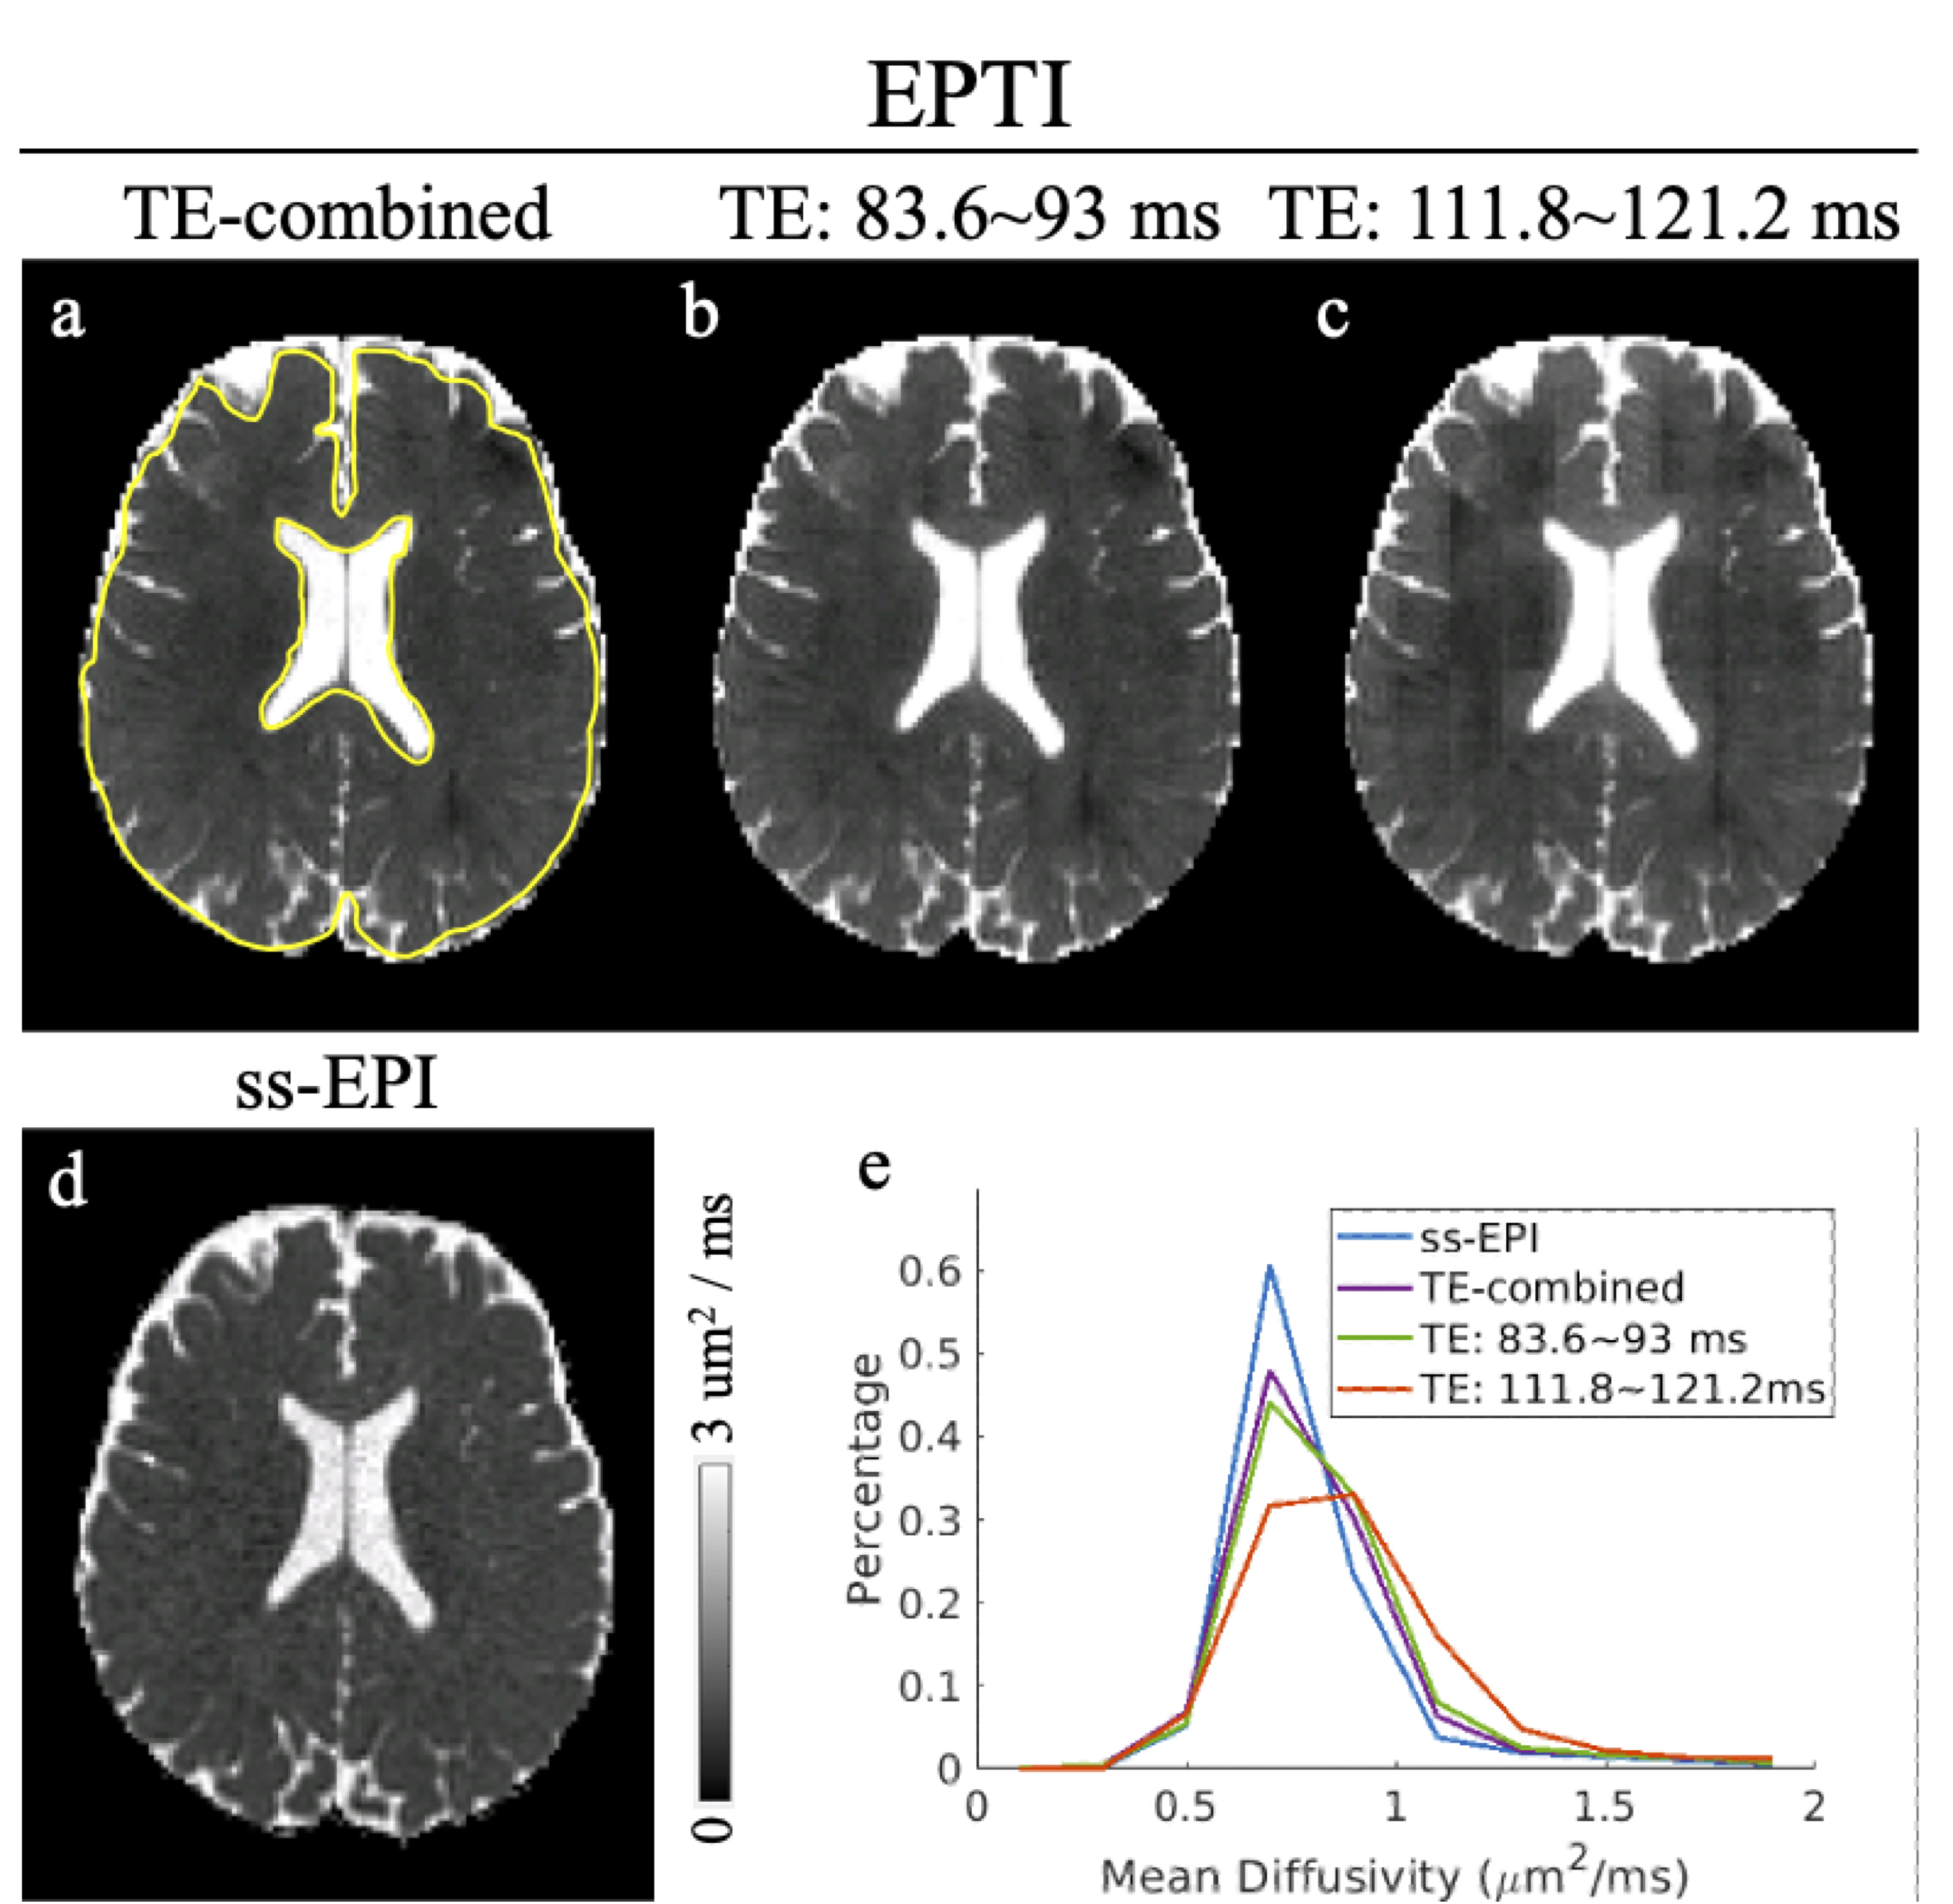
Figure 3: Mean diffusivity (MD) maps from (a-c) EPTI acquisition and (d) ss-EPI acquisition. The EPTI results include: (b) the combined images from all TEs, (c) the combined images with TE between 83.6 and 93 ms, and (d) the combined images with TE between 111.8 and 121.2 ms. (e) Histogram of the MD values over the manually drawn ROI on the brain tissue (regions between two yellow curves in Fig. 3a).