3441
Integrated T1rho Dispersion Imaging and Quantification1Department of Radiology, Albert Einstein College of Medicine, Bronx, NY, United States, 2Department of Medical Physics, Memorial Sloan Kettering Cancer Center, New York, NY, United States
Synopsis
T1ρ dispersion imaging is an emerging MRI technique for tissue characterization. Multiple independent repetitions of T1ρ experiments at different spin-lock frequencies have to be performed to generate tissue T1ρ dispersion curve. In this work, we demonstrate the feasibility of an integrated imaging and quantification approach for T1ρ dispersion imaging, which allows simultaneous generation of T1ρ maps at multiple spinlock frequencies in one coherent workflow. This opens door for further data undersampling to exploit redundancy at higher dimension data space, further reducing total scan time needed for the time-consuming T1ρ dispersion imaging.
Introduction
The spin-lattice relaxation time in the rotating frame (T1ρ or T1rho, and the relaxation rate R1ρ = 1/T1ρ), using spin-locking pulse sequences, have been shown to be sensitive to both local magnetic field fluctuations and chemical exchange process in the tissue. T1ρ varies as a function of the spin-lock frequency (FSL), known as T1ρ dispersion, which correlates with tissue properties.1, 2 Therefore, multiple repetitions of the T1ρ experiments at different FSLs have to be performed to generate a T1ρ dispersion curve. The MAPSS (Magnetization-Prepared Angle-Modulated Partitioned k-Space Spoiled Gradient Echo Snapshots) sequence has been proposed to achieve fast high-resolution 3D T1ρ mapping on the knee cartilage.3 Additionally, it has been shown that both T2 mapping and T1ρ mapping can be integrated in the same pulse sequence to reduce total scan duration and simplify post-processing.4, 5 In this work, we demonstrate the feasibility of an integrated imaging and post-processing approach for T1ρ dispersion imaging, which allows simultaneous reconstruction of T1ρ maps at multiple spinlock frequencies in one coherent workflow. This opens door for further data undersampling to exploit redundancy at higher dimension data space, potentially further reducing total scan time needed for the time-consuming T1ρ dispersion imaging.Methods
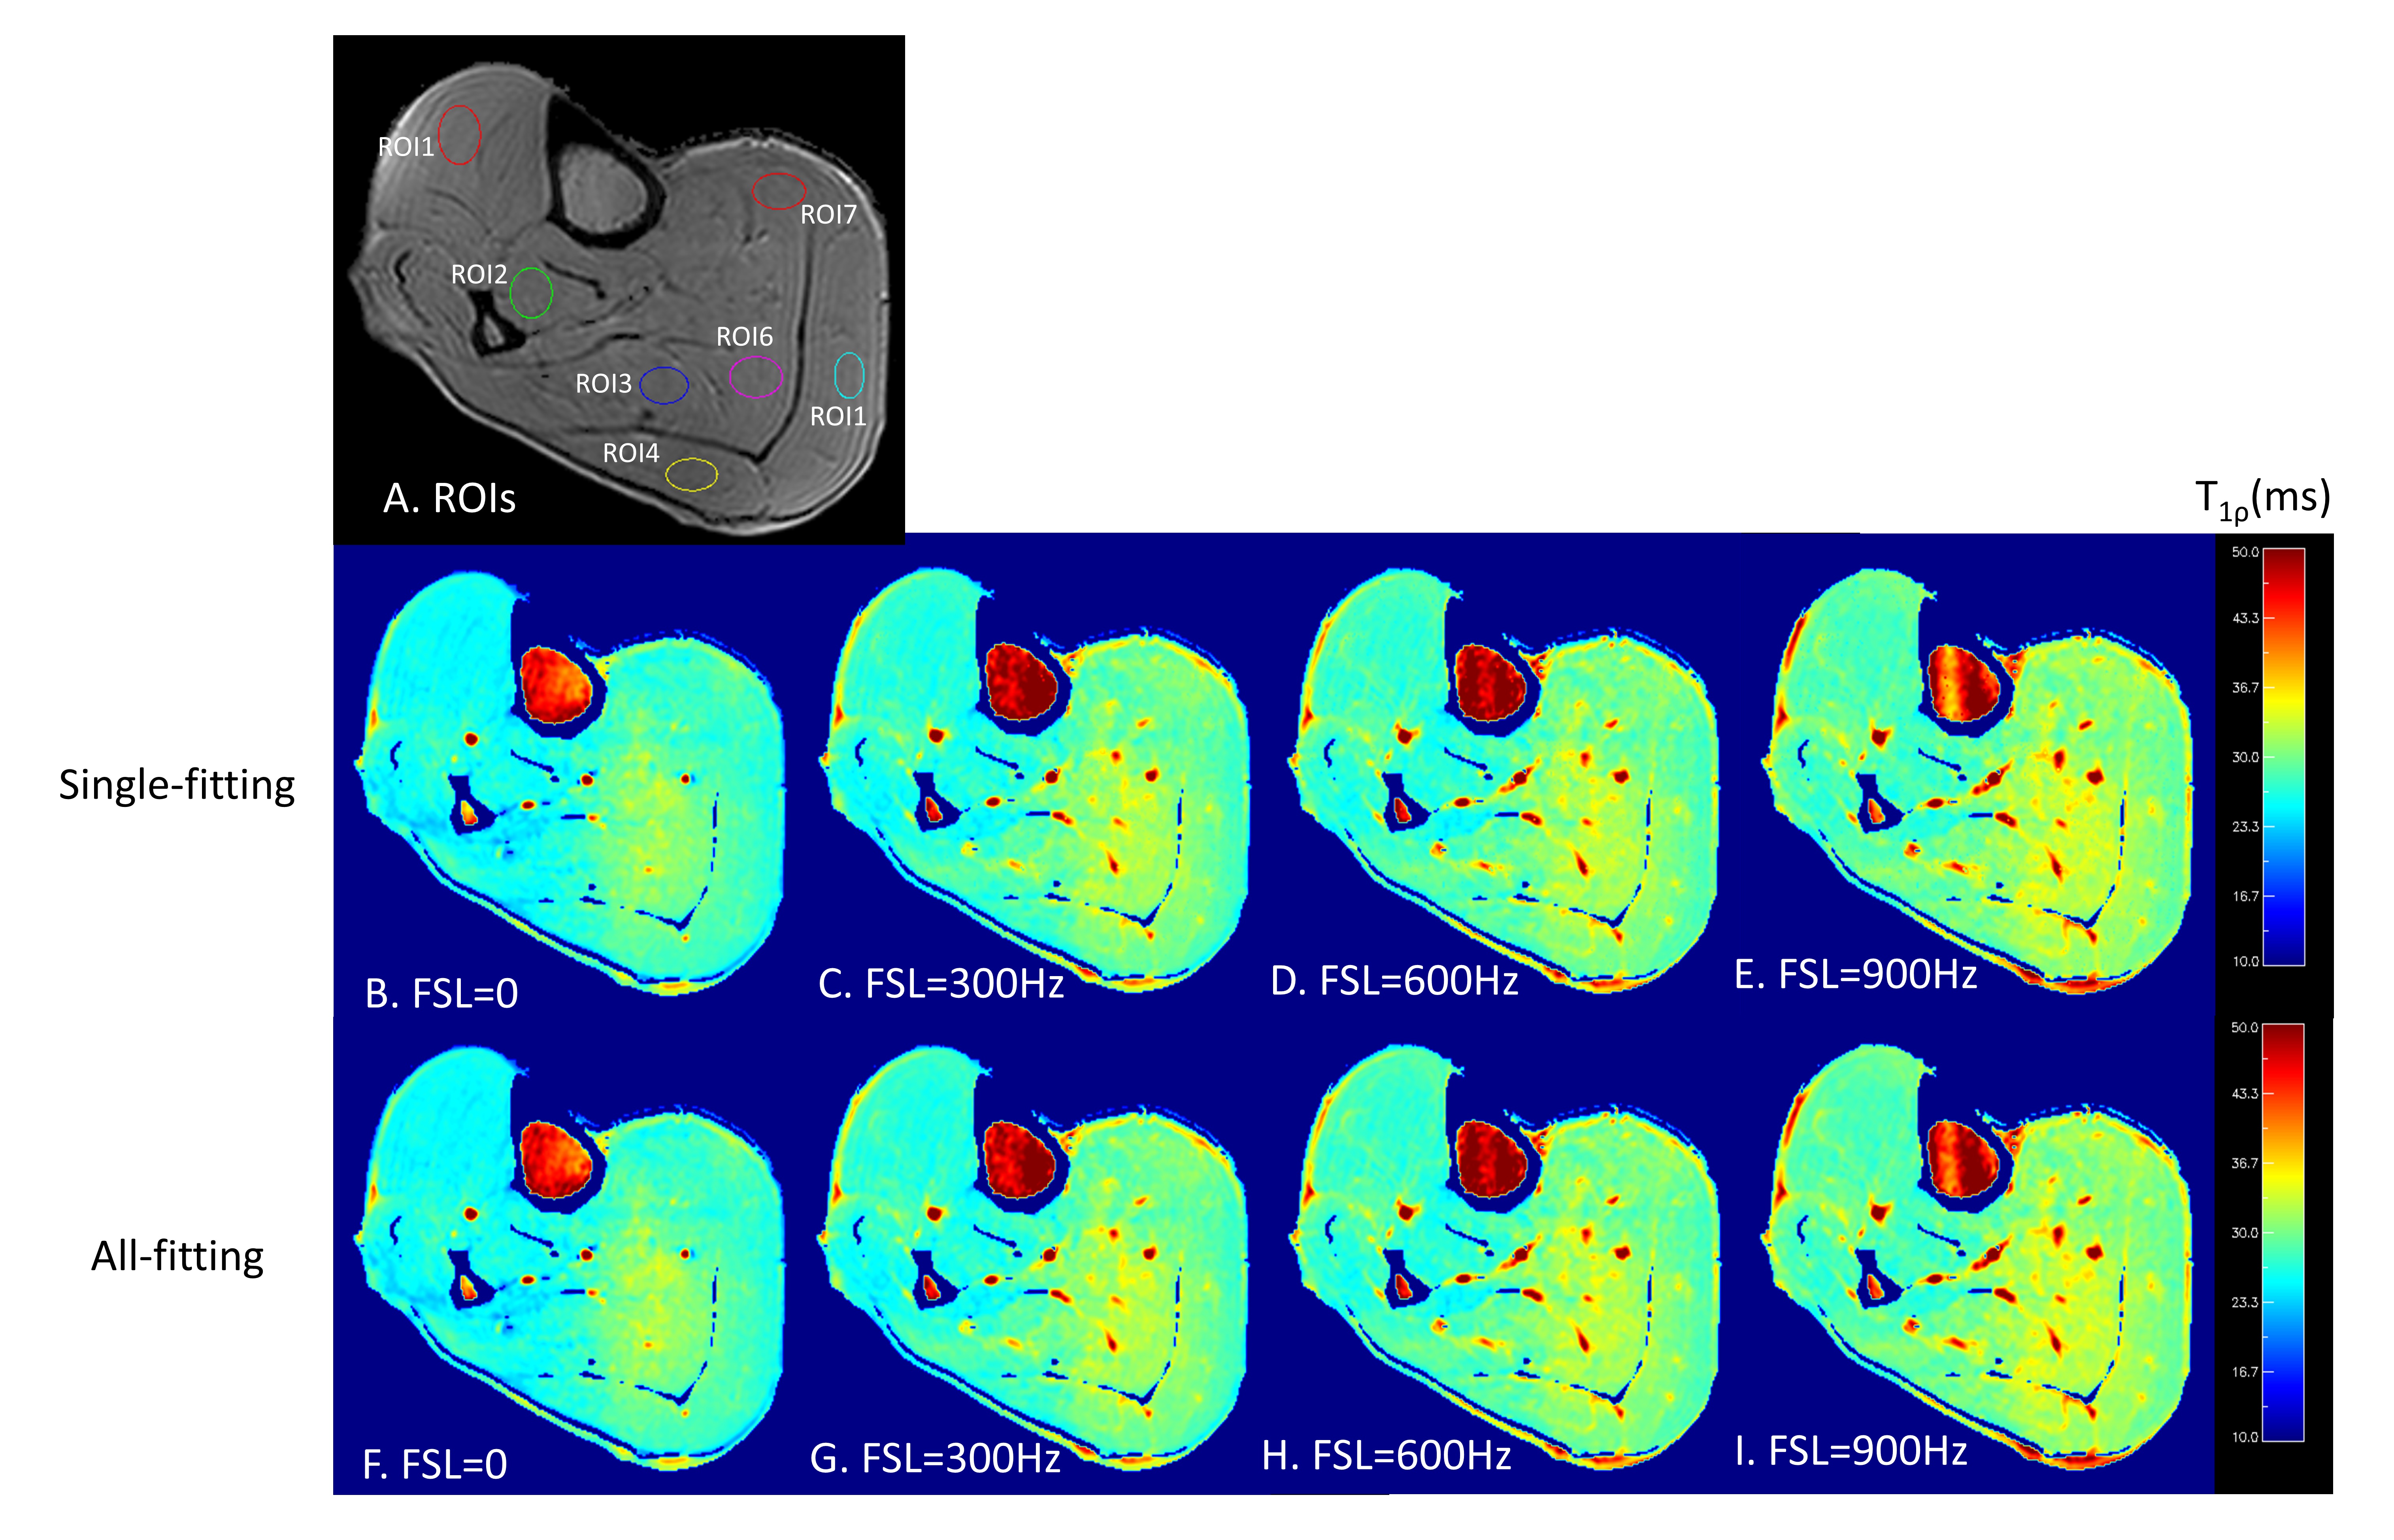
All imaging was performed on a 3T Philips Ingenia MR scanner. A modified 3D MAPSS sequence was used to acquire T1ρ-weighted images at multiple spin-lock frequencies for T1ρ dispersion imaging.3 The sequence was on calf muscles of a 46-yo male volunteer with a 1ch-TX/16ch-Rx knee coil with maximum B1+ of 27 µT. The MAPSS T1ρ preparation module includes a RF train of 90°x-TSL/2-180°y-TSL/2-90°x to achieve PC- (-Mz) preparation (Figure 1A). The PC+ (+Mz) preparation was obtained by applying an adiabatic inversion module before the T1ρ preparation module (Figure 1B).6 The MAPSS T1ρ dispersion imaging sequence had 10 FSLs (0 to 900Hz with 100Hz gap), and with time of spinlock (TSL) of 30ms in addition to the TSL=0 ms acquisition. Axial 3D volumetric imaging was performed with the following scan parameters: FOV=140/140/180mm3, acquisition voxel size=1x1x6mm3, TR/TE=5.4/2.6ms, TFE factor=96 with centric profile ordering and with increasing RF flip angle sweeping along the GRE readout train, and compressed SENSE factor=4. MR signal of a voxel with T1ρ at FSL can be modeled as $$$S^{*}(T1\rho(FSL),TSL\pm)=\pm S_{A}e^{-\frac{TSL}{T1\rho(FSL)}}+S_{B},$$$ where SA and SB are complex variable to be determined, and SB includes the contaminating signal originated from T1 recovery.7 For the standard T1ρ fitting (termed “Single-fitting” herein), each T1ρ at different FSL was obtained using paired subtraction between the positive and negative phase cycling acquisitions followed by a mono-exponential curve-fitting.3 For our proposed T1ρ dispersion fitting method (termed “All-fitting” herein), all T1ρ values at different FSLs were obtained simultaneously using a nonlinear least-square fitting algorithm using the following optimization function: $$$S_A,S_B,T_1ρ (FSL)=\arg min_{S_A,S_B,T_1ρ (FSL)}{\sum||S(T_1ρ (FSL),TSL±)-S^*(T_1ρ (FSL) ,TSL±)||^{2}},$$$ where S* and S are the modeled and acquired signals, respectively, from the TSL acquisitions with PC± at FSL. Seven regions-of-interest (ROIs) were drawn on calf muscles and T1ρ dispersion results were obtained from both Single-fitting and All-fitting analyses. Student-t test was performed to evaluate if they have the same mean T1ρ values from the seven ROIs at 10 FSLs. Pearson’s correlation and intraclass correlation coefficient were also calculated to evaluate the quantitative agreement between these two methods.Results
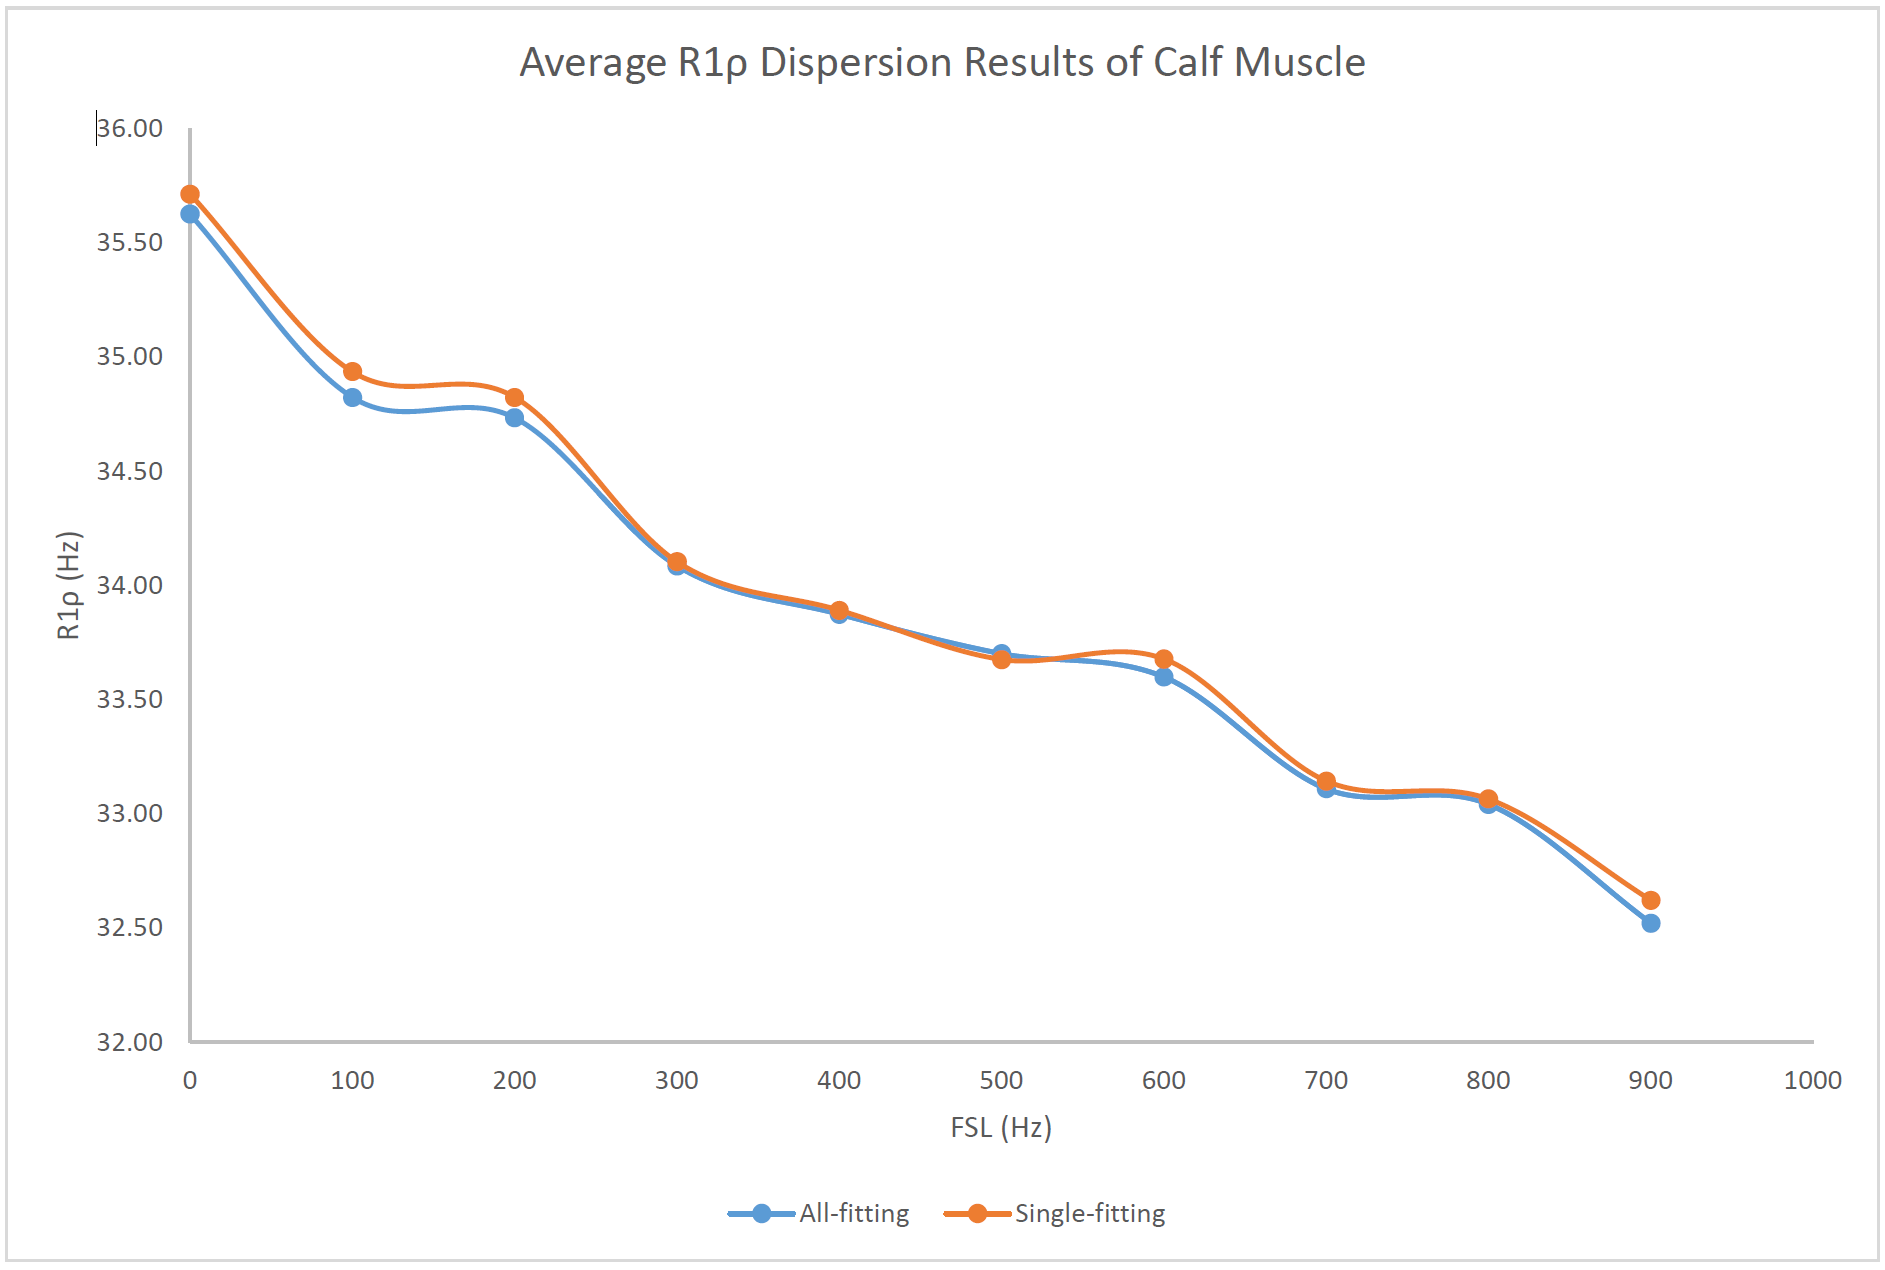
Representative T1ρ dispersion imaging results are shown in Figure 2. Figure 2A shows the seven ROIs defined on a T1ρ-weighted image acquired at TSL=0ms with PC+. Both the Single-fitting and the All-fitting methods resulted in good quality T1ρ maps with consistently increasing values at higher FSLs. From visual inspection, no difference within muscles between the two sets of T1ρ maps could be identified. The R1ρ results from the ROI-analyses are shown in Table 1. The R1ρ dispersion curves from the average R1ρ values of the 7-ROIs are shown in Figure 3, which shows consistent results from both methods within the whole spectrum of FSLs (from 0 to 900 Hz). From statistical analysis, there is a strong correlation (r=0.9984, and P<0.0002) between the R1ρ values from All-fitting and Single-fitting methods. Intraclass correlation coefficient was 0.9982.Discussion
T1ρ dispersion imaging can be obtained from multiple independent repetitions of T1ρ mapping at different FSLs. Given that fact that T1ρ is typically a monotonical, slowly increasing function of FSL, there is a high degree of redundancy along the FSL dimension in T1ρ dispersion imaging. In this pilot study, we demonstrated the feasibility of an integrated dispersion mapping approach from both the imaging acquisition and the T1ρ map reconstruction perspectives. Not only did this approach lead to similar results as traditional methods, but also it could be combined with the compressed sensing acquisition into the optimization reconstruction framework at a 5D (3D+TSL+FSL) space. This work opens the door for further data undersampling to dramatically reduce total scan time needed for the time-consuming T1ρ dispersion imaging, particularly true when combining with iterative or AI-based reconstruction algorithms.8, 9 Further work is warranted to validate this promising integrated imaging and reconstruction approach.Acknowledgements
No acknowledgement found.References
1. Koskinen SK, Virta AM, Niemi PT, et al. T1rho dispersion of rat tissues in vitro. Magn Reson Imaging. 1999;17(7):1043-1047.
2. Wang P, Block J, Gore JC. Chemical exchange in knee cartilage assessed by R1rho (1/T1rho) dispersion at 3T. Magn Reson Imaging. 2015;33(1):38-42.
3. Li X, Han ET, Busse RF, et al. In vivo T(1rho) mapping in cartilage using 3D magnetization-prepared angle-modulated partitioned k-space spoiled gradient echo snapshots (3D MAPSS). Magn Reson Med. 2008;59(2):298-307.
4. Li X, Wyatt C, Rivoire J, et al. Simultaneous acquisition of T1rho and T2 quantification in knee cartilage: repeatability and diurnal variation. J Magn Reson Imaging. 2014;39(5):1287-1293.
5. Peng Q, Wu C. High Spatial Resolution Simultaneous Quantitative T1rho and T2 Mapping at 3T. AAPM Annual Meeting. 2021.
6. Zhang H, Jiang B, Jian H, et al. Robust Quantitative T1rho imaging Proc Intl Soc Mag Reson Med 29. 2021.
7. Peng Q, Wu C, Kim J, et al. Efficient Phase Cycling Strategy for High Resolution 3D GRE Quantitative MRI Mapping. NMR in Biomedicine. 2021;Under Review.
8. Cao T, Ma S, Wang N, et al. Three-dimensional simultaneous brain mapping of T1, T2, T 2 * and magnetic susceptibility with MR Multitasking. Magn Reson Med. 2021.
9. Wang N, Gaddam S, Wang L, et al. Six-dimensional quantitative DCE MR Multitasking of the entire abdomen: Method and application to pancreatic ductal adenocarcinoma. Magn Reson Med. 2020;84(2):928-948.
Figures