3439
Investigating time-restricted feeding and metabolic sexual dimorphism in Nile grass rats by time-domain NMR lipid profiling
Hayden Johnson1, Thomas Yates1, Chidambaram Ramanathan2, Melissa Puppa2, Marie van der Merwe2, and Aaryani Tipirneni-Sajja1
1Biomedical Engineering, University of Memphis, Memphis, TN, United States, 2College of Health Sciences, University of Memphis, Memphis, TN, United States
1Biomedical Engineering, University of Memphis, Memphis, TN, United States, 2College of Health Sciences, University of Memphis, Memphis, TN, United States
Synopsis
NMR-based metabolomics is a powerful technique for elucidating the metabolic effects of diet through the identification and quantification of molecules present in tissues. This study utilizes time-domain processing of NMR data for robust, reproducible resonance characterization in the profiling of lipid species in heart and liver tissues of male and female animals subject to high fat diets with and without time-restriction. Results show triglyceride and fatty acid accumulation was associated with eating a high fat diet, but these effects were attenuated by time-restricted feeding. Hepatic lipids expressed a sexually dimorphic response, with higher concentrations of many lipids in female subjects.
Introduction
NMR-based metabolomics is conventionally performed in the frequency-domain which requires many user-dependent steps such as zero-filling, apodization, phase and baseline correction followed by quantification by integration or peak deconvolution and hence, can introduce user bias and inter-operator variability in metabolite quantification1. In this study, we utilize a Bayesian approach to time-domain NMR parameter estimation, CRAFT (Complete Reduction to Amplitude-Frequency Table), for accurate, time-efficient quantification of lipid metabolites in rat tissue samples. These rats were subjects of a dietary study examining time-restricted feeding (TRF), an increasingly popular diet in which caloric intake is restricted to a certain window of time each day. Recent research suggests TRF can be an effective strategy for weight loss and preventing common chronic metabolic diseases such as obesity and type 2 diabetes; however, most studies to date only examine male animals2,3. This study investigates both sexes, as males and females handle many major metabolic challenges such as fat storage and energy homeostasis differently4. Liver and heart tissues were profiled to evaluate the effects of diet as these organs play major roles in maintaining systemic metabolic homeostasis.Methods
Male and female Nile grass rats were subjects of a TRF study on one of four diets (chow ad libitum, high fat ad libitum [HF-AD], high fat morning TRF [HF-AM], and high fat evening TRF [HF-EV]). The TRF restrictions were characterized by access to the high fat diet for the first 6 hours of the 12 hour light/active phase for HF-AM or the second 6 hours of the 12 hour light/active phase for HF-PM. Hepatic and cardiac tissues were harvested after six weeks, and lipids were extracted from tissues using an MTBE extraction before resolubilizing in deuterated solvent mixture (chloroform, methanol, and water) for profiling by proton NMR using a 400-MHz JEOL ECZ NMR spectrometer. For all measurements, the spectrometer was cooled to 0°C to shift the water resonance and 32 scans were recorded using a single-pulse proton sequence with a pulse angle of 45° and a relaxation delay of 4 s. NMR data processing for all samples was performed in JEOL Delta v5.3 software using CRAFT. Resonances used for quantification of lipid groups were first identified using reference standards and using relevant scientific publications5,6. Lipid species quantified include total triglycerides, total cholesterol, total fatty acids (TFA), unsaturated fatty acids (UFA), omega-3 fatty acids, linoleic acid, phosphatidylcholine (PC), phosphatidylethanolamine, and sphingomyelin. Two-way ANOVA with Holm-Sidak post-hoc testing (Sigma Plot 14.5) was used to compare tissue-specific metabolite concentrations between sexes and diets – with separate analysis performed to independently examine the effects of the high fat diet (Chow vs. HF-AD) and TRF (HF-AD vs. HF-AM vs. HF-EV). For both liver and heart lipid profiles, hierarchical clustering analysis (HCA) with heatmaps for visualization was performed including all dietary groups using MetaboAnalyst software (https://www.metaboanalyst.ca) using auto-scaled data (mean-subtracted and divided by standard deviation).Results & Discussion
Representative hepatic and cardiac lipid spectra are displayed in figure 1. As expected, rats on the HF-AD diet expressed a significantly greater amount of many hepatic lipid species compared to those on the standard chow diet including triglycerides, cholesterol, TFA, and UFA (Table 1). Similar increases were seen in cardiac tissue of HF-AD rats for triglycerides, TFA, UFA, and PC. Both the HF-AM and HF-EV diet schedules were associated with lower levels of many of these lipids associated with high fat diet (Table 2). In both heart and liver tissues, significantly lower concentrations of TFA and UFA were measured in each TRF group compared to their ad libitum counterpart. Although both tissues also exhibited lower triglyceride levels in response to TRF, this effect was only statistically significantly levels for hepatic triglycerides in the HF-AM dietary group. Irrespective of diet, females expressed significantly higher levels of many lipid groups including triglycerides, TFA, UFA, and omega-3 fatty acids in the liver, an effect which was not seen in heart samples. The higher concentrations of hepatic lipids measured in females compared to males suggest a sexual dimorphism in hepatic metabolism. Visualization of these trends is aided by the heatmaps of figures 2 and 3 – such as the many red blocks representing high levels of triglycerides and fatty acids in the HF-AD diets in both figures, or the red-field at the bottom half of figure 2 representing the high amounts of many lipid species in the livers of female rats compared to males.Conclusion
The metabolite profiles measured using the CRAFT approach for time-domain NMR parameter estimation suggest that TRF induces positive effects on lipid metabolism.Acknowledgements
No acknowledgement found.References
- K. Krishnamurthy, (2013) Magn. Reson. Chem., 51, 821. https:// doi.org/10.1002/mrc.4022
- Hatori M, Vollmers C, Zarrinpar A, DiTacchio L, Bushong EA, Gill S, et al. Time-restricted feeding without reducing caloric intake prevents metabolic diseases in mice fed a high-fat diet. Cell Metab. 2012;15.
- Sutton EF, Beyl R, Early KS, Cefalu WT, Ravussin E, Peterson CM. (2018) Early Time-Restricted Feeding Improves Insulin Sensitivity, Blood Pressure, and Oxidative Stress Even without Weight Loss in Men with Prediabetes. Cell Metab.;27.
- Power, M. L., & Schulkin, J. (2007) Sex differences in fat storage, fat metabolism, and the health risks from obesity: possible evolutionary origins. British Journal of Nutrition, 99(05). doi:10.1017/s0007114507853347
- R. Barrilero, M. Gil, N. Amigó, C. B. Dias, L. G. Wood, M. L. Garg, J. Ribalta, M. Heras, M. Vinaixa, X. Correig, (2018) Anal. Chem., 90, 2031. https://doi.org/10.1021/acs.analchem. 7b04148
- Amiel, A., Tremblay-Franco, M., Gautier, R., Ducheix, S., Montagner, A., Polizzi, A., Debrauwer, L., Guillou, H., Bertrand-Michel, J., & Canlet, C. (2019). Proton NMR Enables the Absolute Quantification of Aqueous Metabolites and Lipid Classes in Unique Mouse Liver Samples. Metabolites, 10(1), 9. https://doi.org/10.3390/metabo10010009
Figures
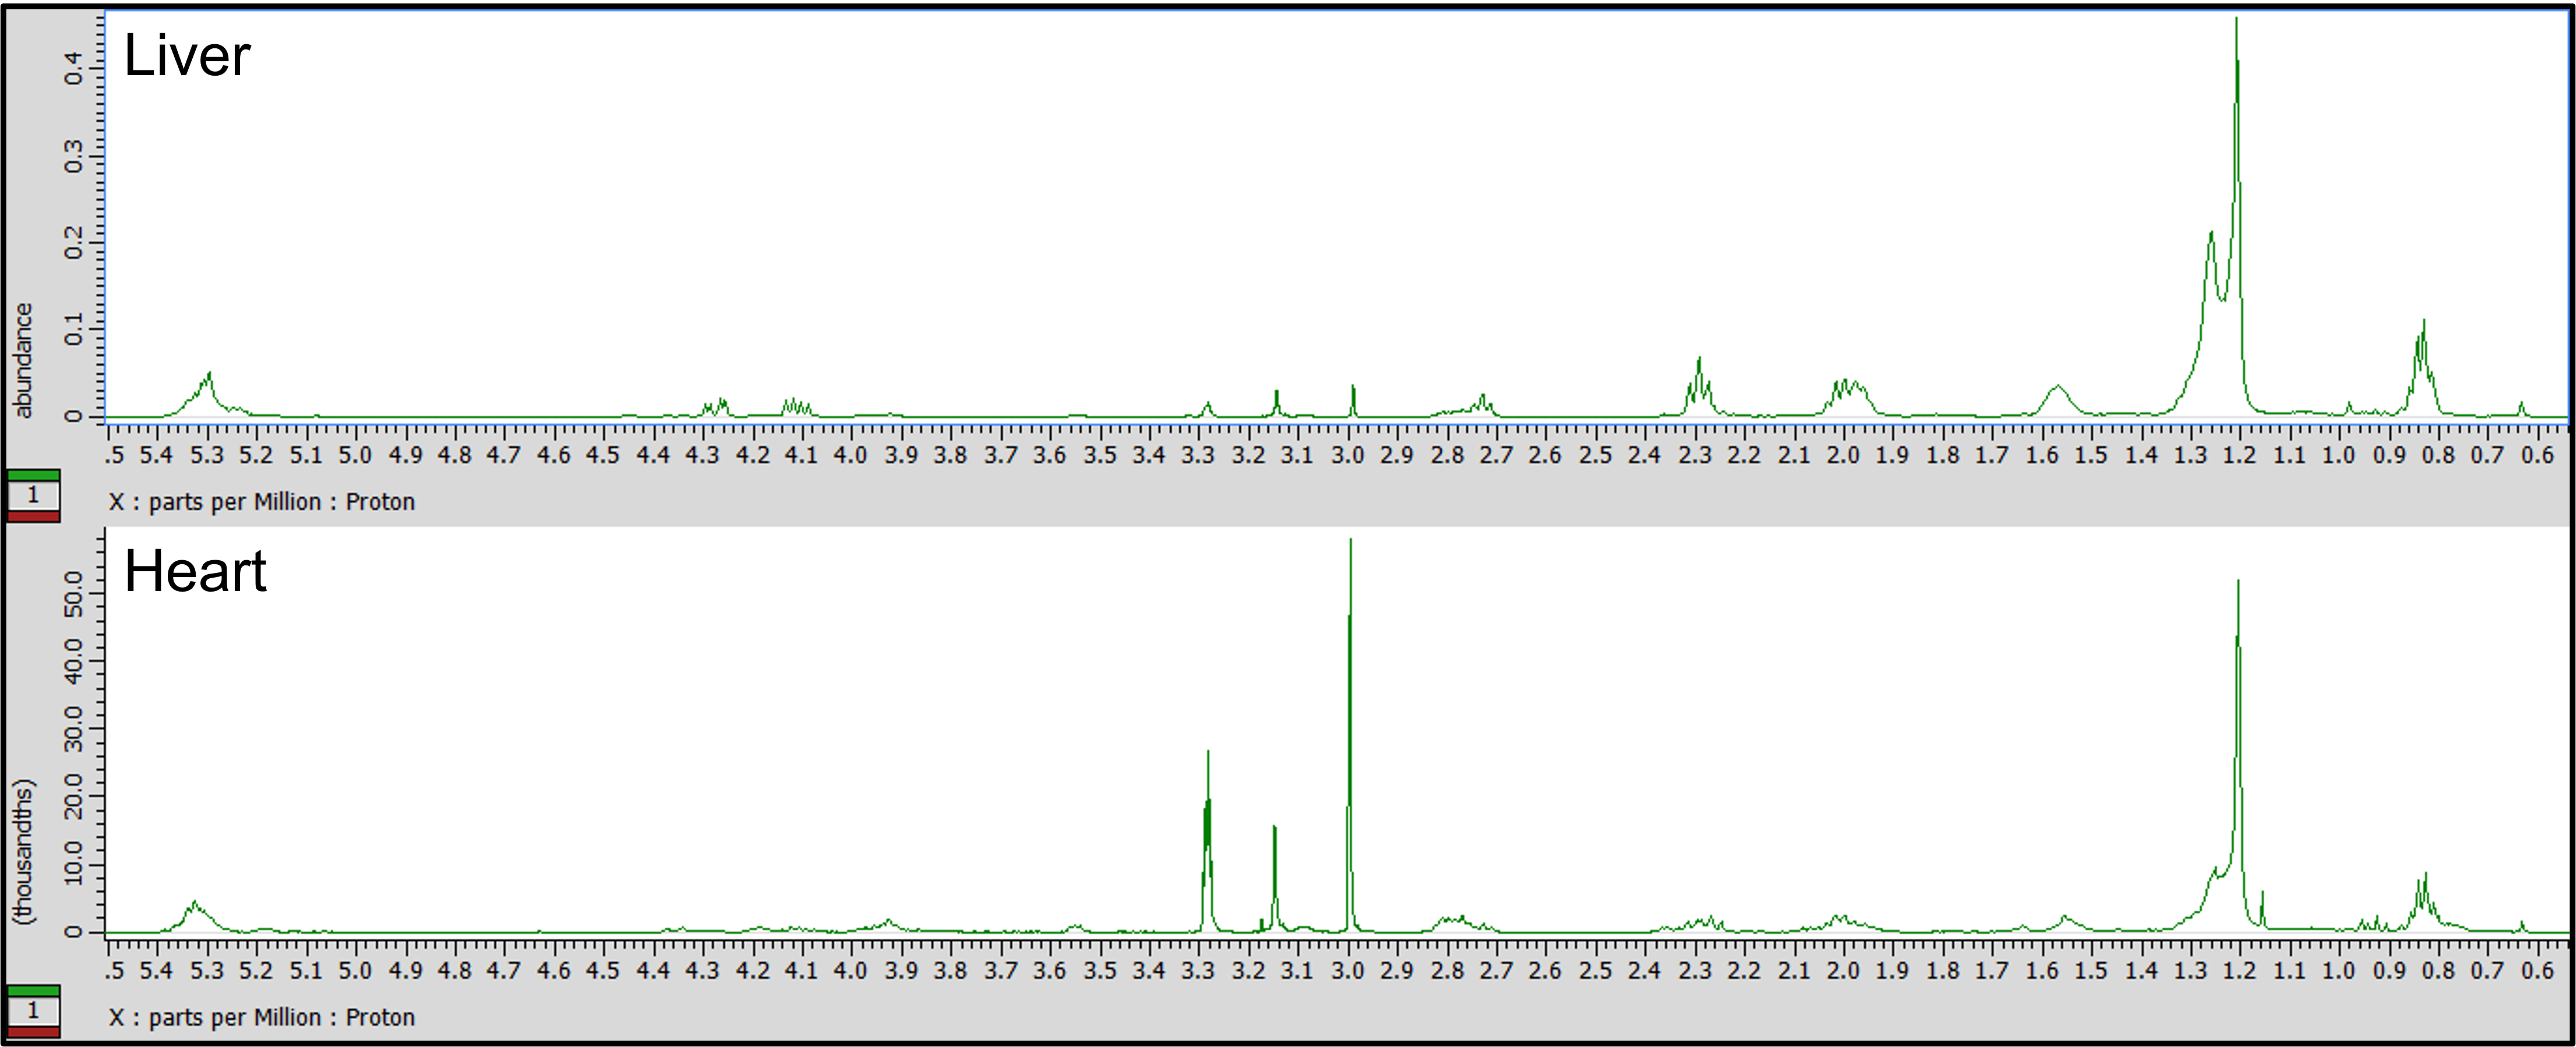
Figure 1 – Lipid spectra for hepatic and cardiac tissues, top and bottom respectively, from the same Nile grass rat.
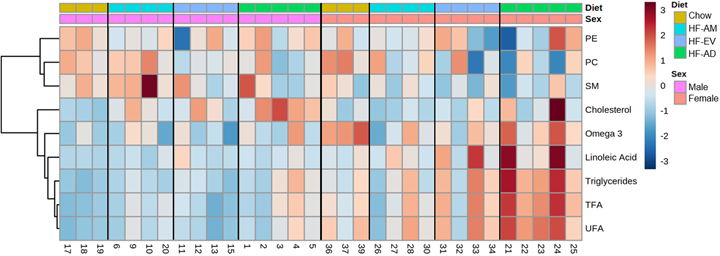
Figure 2 – HCA heatmap of hepatic lipid profiles. The red and blue colors denote concentrations above and below the indicated lipid’s mean concentration value respectively, with darker colors indicating values further from the mean. Males and females had similar responses to diet, expressing high levels of triglycerides, cholesterol, and fatty acids on the HF-AD diet which were attenuated through TRF. Irrespective of diet, females expressed higher levels of hepatic triglycerides and fatty acids compared to males. The lipid name abbreviations are mentioned in abstract main body.

Figure 3 – HCA heatmap of cardiac lipid profiles. Data is auto-scaled and clustered by ward linkage using Euclidean distance. The red and blue colors denote concentrations above and below the indicated lipid’s mean concentration value respectively, with darker colors indicating values further from the mean. Males and females had similar responses to diet, expressing high levels of triglycerides, PC, and fatty acids on the HF-AD diet which were attenuated through TRF. The lipid name abbreviations are mentioned in main body of the abstract.
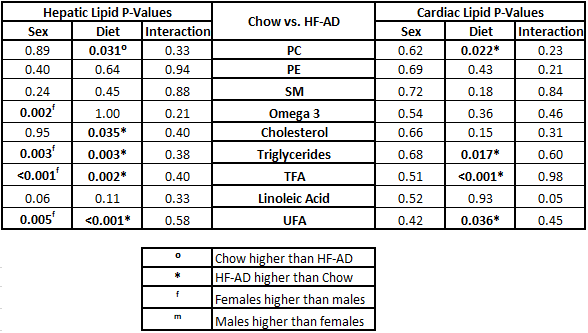
Table 1 - Results of ANOVA and post-hoc analysis for ad libitum diets in heart and liver tissues with lipid species exhibiting significant differences between sexes and/or diets highlighted.

Table 2 - Results of ANOVA and post-hoc analysis for TRF diets in heart and liver tissues with lipid species exhibiting significant differences between sexes and/or diets highlighted.
DOI: https://doi.org/10.58530/2022/3439