3437
Investigating the origin of the BOLD initial dip with biophysical simulations based on realistic microvascular networks: flow or metabolism?1Martinos Center for Biomedical Imaging, Massachusetts General Hospital, Charlestown, MA, United States
Synopsis
We used simulations to achieve insights about the nature of the initial dip and found that it is indeed possible that retrograde propagation causes a local decoupling between hemodynamics and neural activity localized to the upper layers of the cortex. The simulations allowed to assess the contributions of the different simultaneously occurring contributions and point towards a high specificity of the initial dip to the capillaries or the veins. A methodological difficulty was posed by the limited availability of arterial dilation data. Therefore, we derived dilation traces from the measurements and determine a range of possible propagation velocities.
Introduction
The initial dip is a well-known feature of the BOLD response consisting of a subtle, transient decrease in the BOLD signal below baseline before the main BOLD response peak1. This dip was initially attributed to a rapid, transient increase in the metabolic consumption of oxygen prior to the blood flow response and was interpreted as a transient decoupling of blood flow and metabolism. Later studies suggested that this dip may instead reflect a rapid, transient increase in blood volume2. In part because the initial dip is challenging to observe experimentally3, its origins are not well understood. High-resolution experiments in small animal models that combined fMRI with optical imaging suggested that the initial dip may be a feature that arises due to varying delays of the hemodynamic response across cerebral cortical depths, partly attributed to the delays in retrograde arteriolar dilation between parenchymal arterioles and upstream feeding arteries4,5, suggesting a delayed flow—and hence flow-metabolism uncoupling—in the upper layers only. In these data, the initial dip in the BOLD response was observed only at the cortical surface, which may explain why its observation has been “elusive” in human fMRI data. The precise origin of the initial dip is important since it may or may not reflect an aspect of the BOLD signal that is more neural specific than the main peak6 and may represent a breakdown of the universally accepted tenet of strong flow-metabolism coupling in the brain7. However, due to the large number of simultaneous occurring physiological processes during the early phase of the BOLD effect this is a complex task and requires a vast and simultaneous experimental diagnostic access which is difficult to achieve. Motived by this, here we use detailed biophysical models with realistic vascular anatomy and dynamics to quantitatively test potential origins of the BOLD initial dip.Methods
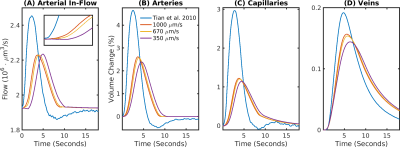
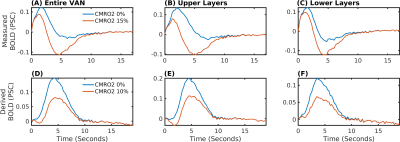
We used a realistic Vascular Anatomical Network (VAN) model reconstructed from mouse cortex8 (Fig.1A) to simulate a short 2 second stimulus based on measured arterial dilation traces5 (Fig.1B), derived average traces with a modified propagation velocity (Fig.1C), a viscoelastic model9, and boundary pressure time traces derived from a whole brain network model10 (Fig.1D). The resulting blood flow dynamics were used to computed advective and diffusive oxygen transport to determine susceptibility changes in the vessels11 and magnetic fieldoffsets which were in turn used to determine the BOLD signal in a Monte-Carlo tissue water diffusion simulation8.Results
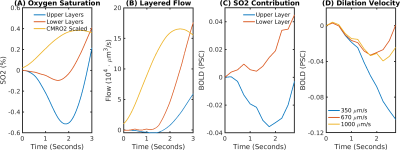
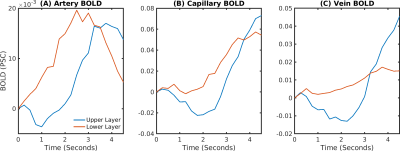
The delay between stimulus and flow onset was larger for the derived than the measured dilation, which had only a negligible delay (Fig.2A). Also the delay between onset of the capillary volume increase was larger (Fig.2D) while the onset of the venous blood volume stayed almost unchanged (Fig.2E). The simulation of the BOLD curves agreed much better with experiments for the derived dilation (Fig.3D-F) than for the measured traces (Fig.3A-C) which also had an initial dip in the upper but not the lower layers. The dip originated from an SO2 depletion in the upper cortical layers (Fig.4A) which was caused by a decreased flow in the upper layers (Fig.4B). The BOLD effect due to SO2 (Fig.4C) showed that SO2 changes cause the initial dip, while volume changes were negligible. Lowering the propagation velocity increased the dip magnitude and duration, while an increase had only little effect (Fig.4D) verifying the validity of the applied propagation velocity. The initial dip was found to be most specific to capillaries (Fig.5B), followed by veins (Fig.5C), while arteries where negligible (Fig.5A).Discussion
A delay between stimulus and flow onset in the upper layers can cause an initial dip but this depends on details of the arterial propagation which is only sparsely known. The initial dip may allow to differentiate the hemodynamic response of lower and upper cortical layers and may prove useful in layered fMRI. However, additional anatomies with different veins may result in a more dominant role of the volume effect as previously outlined2.Conclusion
Our simulations suggest that the initial dip exists and that it could be linked to retrograde arterial propagation. The initial dip has a high specificity to gray matter and may be useful to investigate neurovasular coupling.Acknowledgements
This work was supported in part by the NIH NIBIB (grant P41-EB030006 and R01-EB019437), the BRAIN Initiative (NIH NIMH grants R01-MH111419, R01-MH111438, and F32-MH125599), the MGH/HST Athinoula A. Martinos Center for Biomedical Imaging; and the resources provided by NIH Shared Instrumentation Grant S10-RR023043 and the German Research Foundation (DFG PF 897/2-1).References
1. Kim S, Ogawa S. Biophysical and physiological origins of blood oxygenation level-dependent fMRI signals. J Cereb Blood Flow Metab, 2012; 32(7): 1188-1206.
2. Sirotin Y, Hillman E, Bordier C, Das A. Spatiotemporal precision and hemodynamic mechanism of optical point spreads in alert primates. Proc Natl Acad Sci U S A. 2009;106(43):18390-18395.
3. Buxton R,The Elusive Initial Dip. NeuroImage, 2001; 13(6): 953-958.
4. Devor A, et al. Overshoot of O2 Is Required to Maintain Baseline Tissue Oxygenation at Locations Distal to Blood Vessels. J Neurosci. 2011; 31(38): 13676--13681.
5. Tian P, et al. Cortical depth-specific microvascular dilation underlies laminar differences in blood oxygenation level-dependent functional MRI signal. Natl Acad Sci U S A. 2010; 107(34):15246-51.
6. Fukuda M, Wang P, Moon CH, Tanifuji M, Kim SG. Spatial specificity of the enhanced dip inherently induced by prolonged oxygen consumption in cat visual cortex: Implication for columnar resolution functional MRI. Neuroimage. 2006;30(1):70-87.
7. Fox P. The coupling controversy. Neuroimage. 2012;62(2):594-601.
8.Gagnon L, et al. Quantifying the microvascular origin of BOLD-fMRI from first principles with two-photon microscopy and an oxygen-sensitive nanoprobe. J Neurosci. 2015 25;35(8):3663-75
9. Pfannmoeller J, et al. et al. Simulations of the BOLD Non-Linearity Based on a Viscoelastic Model for Capillary and Vein Compliance. ISMRM Annual Meeting 2021.
10. Boas D, et al. A vascular anatomical network model of the spatio-temporal response to brain activation. Neuroimage. 2008; 15;40(3):1116-29.
11. Fang Q, et al. Oxygen advection and diffusion in a three-dimensional vascular anatomical network. 2008; 16(22): 17530-17541.
Figures


