3432
Assessment of anti-mitotic treatment response in breast cancer using temporal diffusion spectroscopy1Vanderbilt University Institute of Imaging Science, nashville, TN, United States, 2Department of Radiology and Radiological Sciences, Vanderbilt University Institute of Imaging Science, nashville, TN, United States, 3Department of Radiology and Radiological Sciences, Vanderbilt University Medical Center, nashville, TN, United States, 4Department of Radiology and Radiological Sciences, Vanderbilt University Medical Center, Nashville, TN, United States
Synopsis
Reliable and sensitive methods for assessing the response of breast cancer to treatment are critical for rapid selection of the most appropriate therapy for individual patients, and development of novel therapies. Paclitaxel has been reported to slow/block mitosis at the metaphase-anaphase transition and induce apoptosis, leading to cell shrinkage and membrane breakdown. Using a biophysical model that allows derivation of microstructural parameters (e.g., cell size d) and an indicator of the intracellular water lifetime (τin ) from the tdiff dependence of diffusion MRI signals, we monitored the treatment response of breast cancer in both cell cultures and solid tumors in vivo.
Introduction
Paclitaxel, one of the most successful microtubule-targeted chemotherapeutic drugs, has been reported to slow or block mitosis at the metaphase-anaphase transition and induce apoptosis which leads to cell shrinkage and membrane breakdown. To detect and monitor these changes, we propose a simplified biological model that incorporates transcytolemmal water exchange into a multi-compartment diffusion-based method (IMPULSED, Imaging Microstructural Parameters Using Limited Spectrally Edited Diffusion) 1-3 that has been developed previously to extract microstructural parameters (e.g., mean cell size d, and intracellular volume fraction vin) assuming no water exchange. Using both in vitro and in vivo models of breast cancer, we show that the proposed method can detect microstructural changes associated with the anti-mitotic treatment, and a classifier can be generated from our model-derived parameters for differentiation between paclitaxel-treated and drug-vehicle-treated tumors.Theory
Within the framework of temporal diffusion spectroscopy (TDS), we have previously developed a multi-compartment diffusion-based method IMPULSED1-3 for quantification of microstructural parameters in solid tissues, including mean cell size d, intracellular volume fraction vin, intra/extra cellular diffusion coefficients Din/Dex from a limited number of diffusion measurements with varying diffusion times. In practice, a combination of acquisitions using gradients with different waveforms (OGSE (oscillating gradient spin echo) for short tdiff (e.g., ≤ 5 ms) and bipolar gradients as in PGSE (pulsed gradient spin echo) or STEAM (stimulated echo acquisition mode) for relatively long tdiff (e.g., ≥30 ms)) provides sufficient coverage for characterizations of tumor microstructure. We have further improved IMPULSED by including the diffusion time-dependent influence of water exchange on IMPULSED4. For short tdiff (e.g., 5 ms), the water exchange can be ignored as proposed previously1. For long tdiff (e.g., ≥ 30 ms), we adapted the modified Kӓrger model5 that includes both restricted diffusion and exchange between pools. This model assumes short gradient pulses (i.e., δ ≪ Δ) so that diffusion is considered only during two short gradient pulses, while relaxation and exchange effects occur throughout the pulse sequence. Using this joint model, we can improve the accuracy of estimates of IMPULSED-derived cell size d, and vin and provide an indicator of water exchange, termed as apparent τin . Data fitting was performed using an in-house developed software package (https://github.com/jzxu0622/mati.git).Methods
In vitro experiment: We reanalyzed the diffusion MRI cell data in vitro, which were published in1, using the proposed joint model, and then compare model-derived parameters between drug-vehicle-treated and paclitaxel-treated MDA-MB-231 cells. A detailed description about cell preparation, MR imaging protocol can be found in1.In vivo experiment: MDA-MB-231 tumors were formed in the right hind limb of mice. After tumor volumes reached ~ 50-100 mm3, all the mice were treated with either paclitaxel (n=8) or DMSO (drug vehicle, n=7) twice weekly at 20 mg/kg for three weeks. Note that some mice were sacrificed at week 2 after the first treatment due to their poor health conditions. We performed TDS weekly on all the mice using a 4.7 T MRI scanner. For PGSE experiments, diffusion gradient duration/separation δ/Δ = 3/46 ms to ensure δ ≪ Δ. The OGSE method measured frequencies at 50 and 150 Hz with δ / Δ = 20/25 ms. For STEAM experiments, diffusion gradient duration/separation δ/Δ = 3/101 ms. Nine b-values spaced at equal logarithmic intervals from 0 to either 3000 s/mm2 or the allowed maximum b value (limited by the maximum gradient strength of 360 mT/m in any single direction).
Results
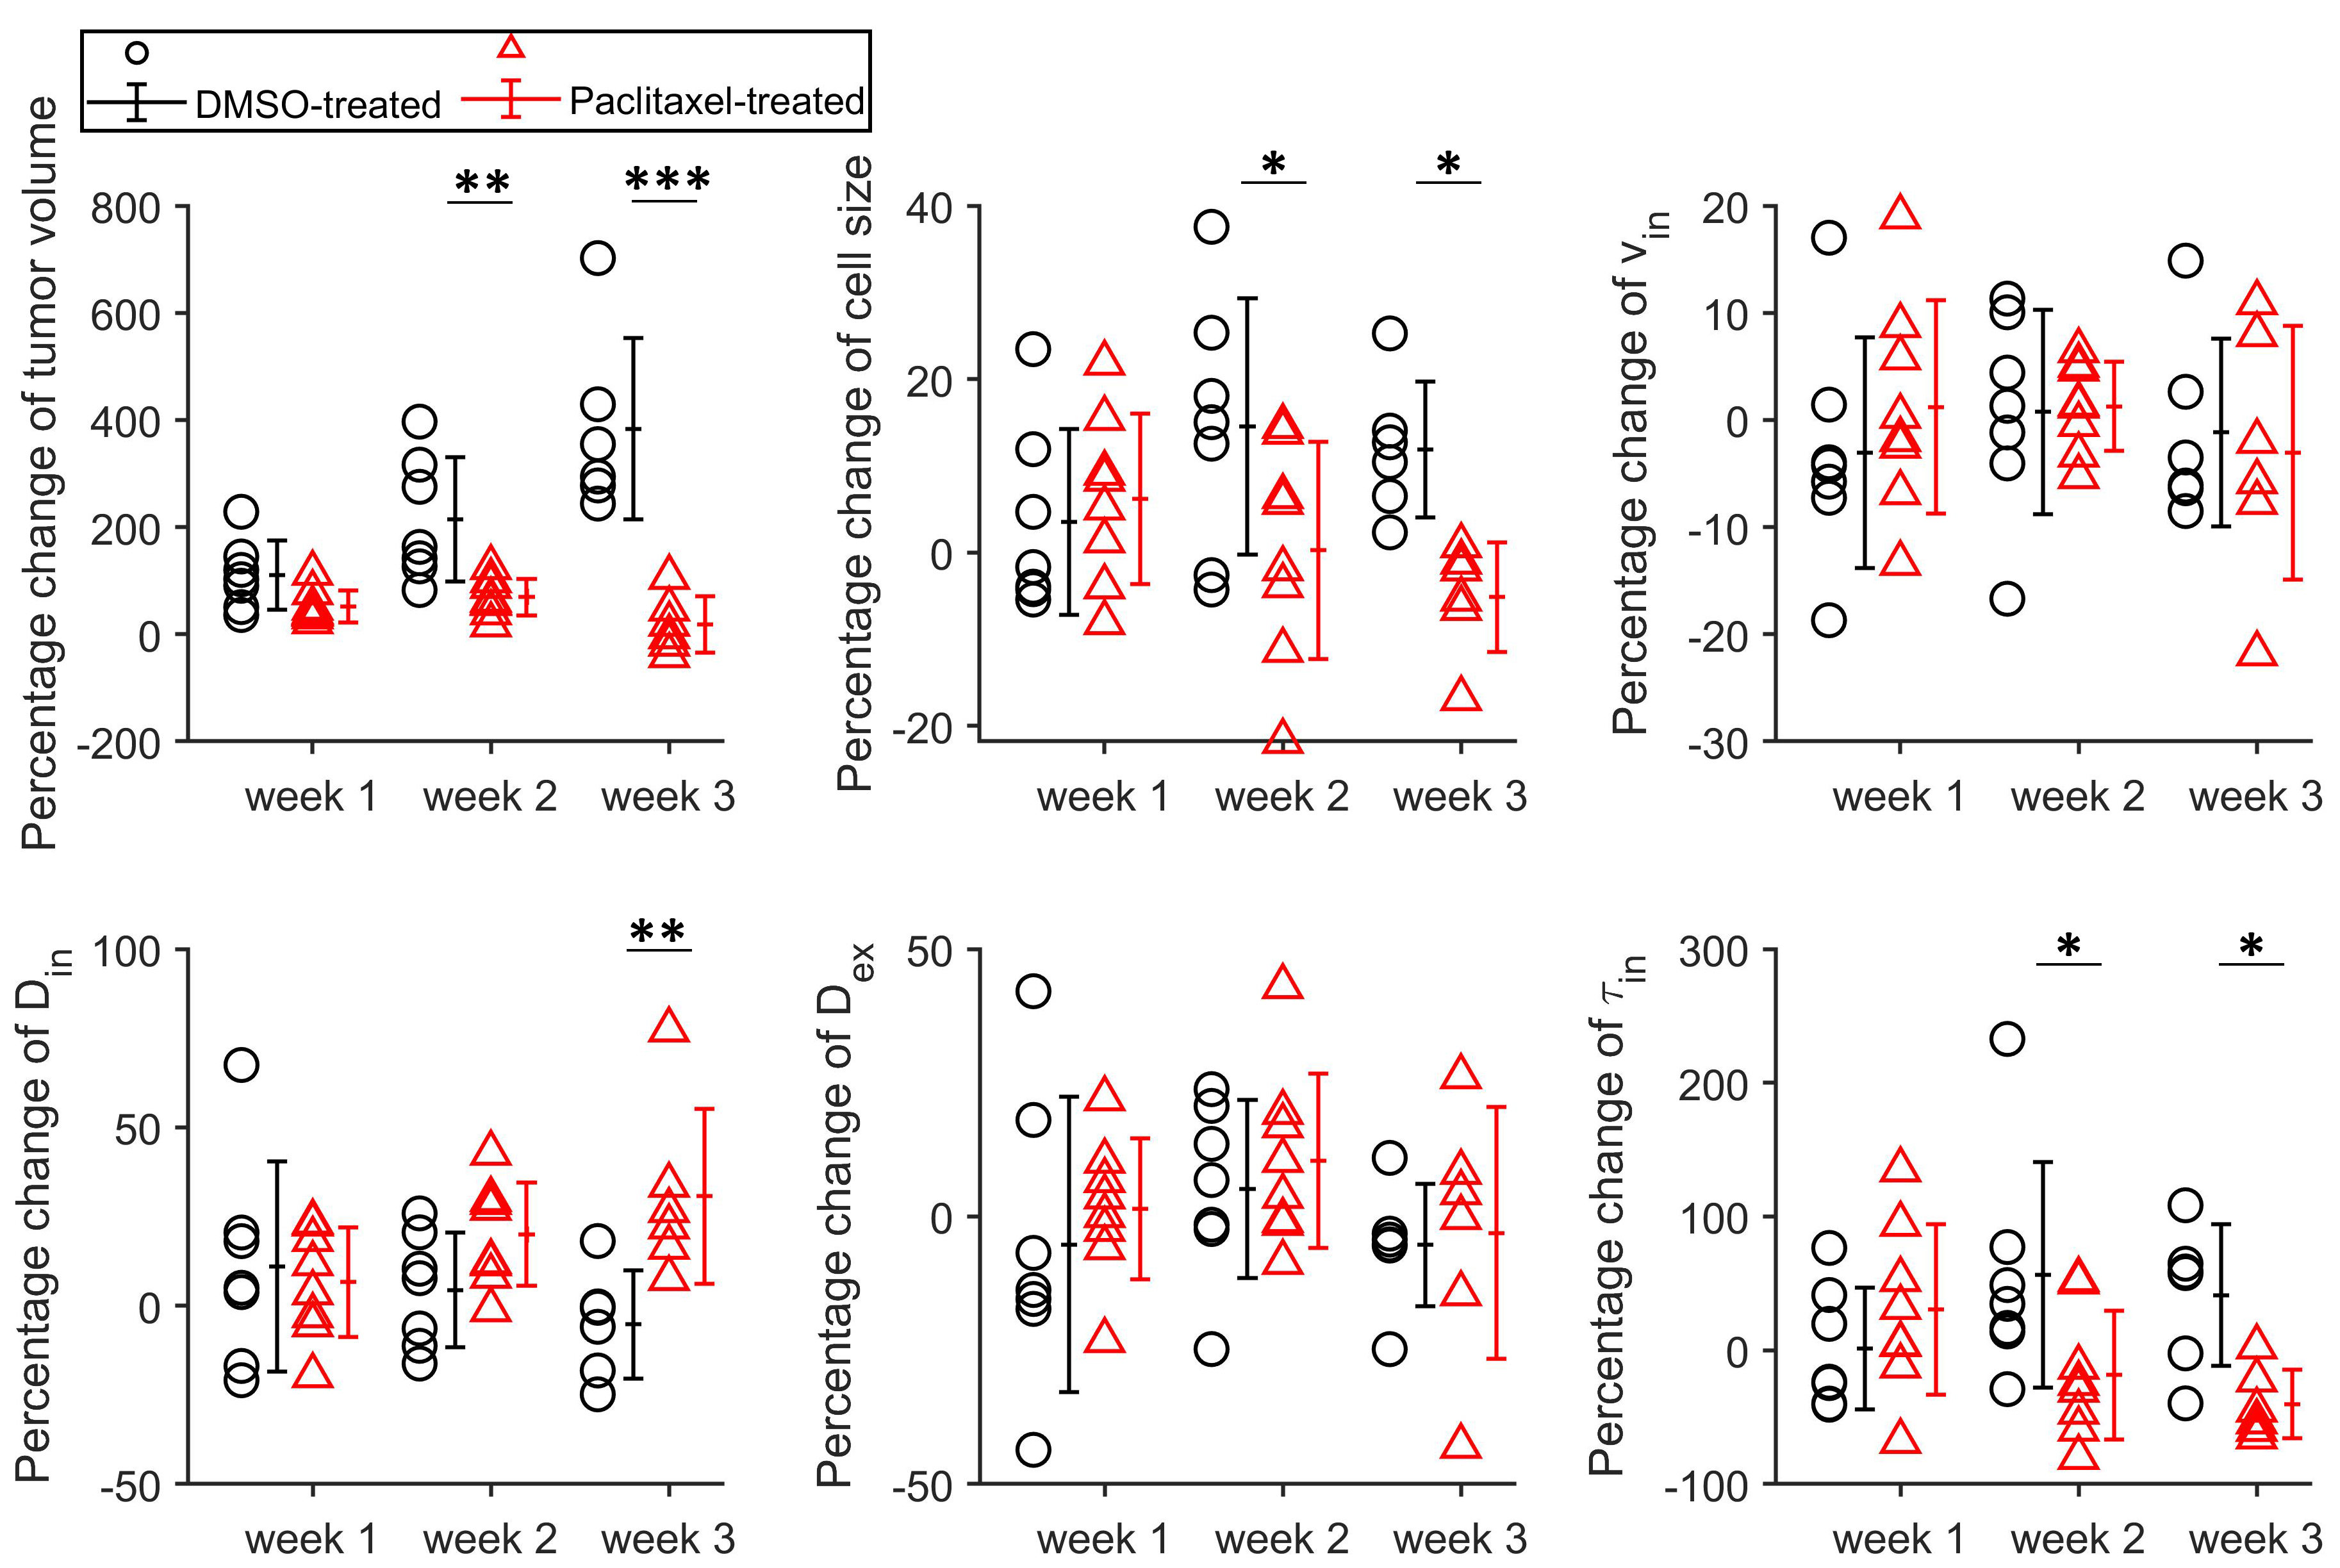
For the in vitro cell experiment, TDS-derived cell sizes of paclitaxel-treated cells are larger on average than the DMSO-treated cells, which is consistent with our microscopy observations. We also observed increased vin and decreased apparent τin for paclitaxel-treated cells compared with the DMSO-treated cells (Figure 1). For the in vivo experiment, the temporal behavior differences of TDS-derived parameters and T2-weighted image–derived tumor volumes between DMSO- and paclitaxel-treated tumors were compared by repeated measures 2-way analysis of variance with Bonferroni posttests (Figure 2). All the p values were False Discovery Rate (FDR) adjusted. The paclitaxel-treated tumors show non-significant increases in cell sizes and τin and decreases in Din at week#1, and then significant decreases in d and τin and increases in Din. This is consistent with the well-established drug mechanism that paclitaxel induces mitotic arrest and then apoptosis. Using discriminant analysis, we are also able to generate a classifier, which is a linear combination of cell size, Din, and τin for classification of treated and non-treated tumors.Discussion and Conclusion
We hypothesized that the size of a paclitaxel-treated cell first increases and then decreases, corresponding to mitotic arrest followed by apoptosis. However, it is more challenging to observe an increase in the average cell sizes in vivo due to the high heterogeneity in cell cycle activity than in vitro cell culture in which cells are more synchronized. Both in vitro and in vivo experiments report a decrease in the apparent τin, likely associated with either membrane reshaping during mitotic arrest or membrane breakdown during apoptosis. We have described the power of using TDS-derived parameters for the detection of treatment response in a preclinical breast cancer model. Data presented in this study provide compelling evidence to justify the further evaluation of TDS in clinical applications.Acknowledgements
This work was funded by NIH Grants/Award Numbers: K25CA168936, R01CA109106, R01CA173593, F32CA216942; American Cancer Society, Grant/Award Number: IRG#58-009-56.References
1 Jiang, X. et al. Quantification of cell size using temporal diffusion spectroscopy. Magnetic resonance in medicine 75, 1076-1085, doi:10.1002/mrm.25684 (2016).
2 Jiang, X. et al. In vivo imaging of cancer cell size and cellularity using temporal diffusion spectroscopy. Magnetic resonance in medicine 78, 156-164, doi:10.1002/mrm.26356 (2017).
3 Xu, J. et al. Magnetic resonance imaging of mean cell size in human breast tumors. Magnetic resonance in medicine 83, 2002-2014, doi:10.1002/mrm.28056 (2020).
4 Li, H. et al. Time-Dependent Influence of Cell Membrane Permeability on MR Diffusion Measurements. Magnetic resonance in medicine 75, 1927-1934, doi:10.1002/mrm.25724 (2016).
5 Stanisz, G. J., Li, J. G., Wright, G. A. & Henkelman, R. M. Water dynamics in human blood via combined measurements of T2 relaxation and diffusion in the presence of gadolinium. Magnetic resonance in medicine 39, 223-233, doi:10.1002/mrm.1910390209 (1998).
Figures