3431
EPR and MRI studies of microenvironment in pancreatic cancers. Mechanistic studies of combination therapy with gemcitabine and evofosfamide.
Yasunori Otowa1, Kota Yamashita1, Kazutoshi Yamamoto1, Jeffery R Brender1, Nallathamby Devasahayam1, Shun Kishimoto1, and Murali C Krishna1
1National Cancer Institute, Bethesda, MD, United States
1National Cancer Institute, Bethesda, MD, United States
Synopsis
Although gemcitabine (GEM) and evofosfamide as monotherapy has a weak effect on MIA Paca-2 and SU 86.86 pancreatic ductal adenocarcinomas respectively, yet the combination therapy shows synergistic effect on both tumor models. The purpose of this study is to understand the synergistic effects of combination therapy using multi-modal imaging methods. In MIA Paca-2 tumors, treatment with GEM induced hypoxia in tumor microenvironment by decreasing the perfusion, which can potentiate evofosfamide. On the other hand, in SU.86.86 tumors, evofosfamide increased blood volume and pO2 in the tumor microenvironment, to potentiate efficacy of anti-proliferatives such as GEM.
Introduction
Evofosfamide is a prodrug that selectively cytotoxic under hypoxic conditions where other anticancer treatment is less effective. This drug is not effective to all cancer subtypes in pancreatic ductal adenocarcinoma. MIA Paca-2 tumors respond to evofosfamide, while SU.86.86 tumors do not.1 On the other hand, MIA Paca-2 tumors do not respond to gemcitabine (GEM), while SU.86.86 tumors do.2, 3 Despite the difference of pO2 level in two tumors, combination treatment of evofosfamide and GEM reduces tumor growth than either GEM/evofosfamide alone in both tumors.4 The underlying mechanism of this combination treatment is not fully understood. Therefore, the aim of this study is to evaluate the mechanism of the synergistic effect of evofosfamide and GEM using multimodal imaging methods.Methods
Athymic nude mice were inoculated with 2 x 10⁶ MIA Paca-2 and SU.86.86 tumor cells adjacent to the right tibial periosteum. For treatment, approximately 400 mm3 tumor bearing mice were injected i.p. with 50 mg/kg of evofosfamide on day 1 through day 5 and 150 mg/kg of GEM on day 1. Tumor bearing mice in the control group were injected with same amount of vehicle. EPRI: Parallel coil resonators tuned to 300MHz were used for EPRI. OX063 (1.125 mmol/kg bolus) was injected i.v. to a mouse. The free induction decay (FID) signals were collected following the radiofrequency excitation pulses (65 ns) with a nested looping of the x, y, and z gradients, and each time point in the FID underwent phase modulation, enabling 3D spatial encoding. The repetition time was 8.0 μs. The number of averages was 4,000. After EPRI measurement, anatomic T2-weighted MR images were collected with a 1T scanner. DCE-MRI: DCE-MRI studies were performed on a 1 T scanner (Bruker BioSpin MRI GmbH). T1-weighted fast low-angle shot (FLASH) images were obtained with TR = 156 ms; TE = 4 ms; flip angle = 45˚; four slices; 0.44 x 0.44 mm resolution; 20-second acquisition time per image; and 98 repetitions. Gd-DTPA solution (4 mL/g of body weight of 50 mmol/L Gd-DTPA) was injected through a tail vein cannula 2 minutes after the start of the dynamic FLASH sequence. To determine the local concentrations of Gd-DTPA, T1 maps were calculated from three sets of Rapid Imaging with Refocused Echoes (RARE) images obtained with TR = 300, 600, 1,000, and 2,000 ms, with the acquisitions being made before running the FLASH sequence. Blood volume (BV) imaging: MRI scanning was conducted a 1 T scanner (Bruker BioSpin MRI GmbH). For BV calculation, spoiled gradient echo sequence images were collected before and 5 minutes after injection of ultra-small superparamagnetic iron oxide (USPIO) contrast (1.2 μL/g of body weight). The imaging parameters included the following: FOV = 28 x 28 mm; matrix = 128 x 128; echo time (TE) = 5.6 ms; TR = 200 ms; and number of average = 12Results
Combination treatment of evofosfamide and GEM showed a synergistic effect on both MIA Paca-2 and SU.86.86 tumors (Fig. 1). Cell cytotoxicity assay showed that MIA Paca-2 tumor cells have a higher sensitivity to GEM than SU.86.86 in vitro. Also, sensitivity of evofosfamide was similar between both tumor cells (Fig. 2). MIA Paca-2 tumors showed hypoxic profile compared with SU.86.86 tumors (Fig. 3). In MIA Paca-2 cells, the combination treatment with evofosfamide and GEM had only an additive effect (Fig. 4A). Thus, the in vivo synergistical effect can be attributed to the changes in TME. EPRI and DCE-MRI analysis showed that GEM caused hypoxia and decreased perfusion in MIA Paca-2 tumors (Fig 4.B-I). GEM did not affect the blood volume (Fig. 4J and 4K). In SU.86.86 cells, the combination treatment with evofosfamide and GEM had a synergistic effect in vitro, which may explain the synergistical effect in vivo. Further analysis on TME by multimodal imagings revealed that evofosfamide improved the pO2 and HF10 when treated with evofosfamide (Fig. 5B-E). Evofosfamide improved the blood volume (Fig. 5J and 5K) though it did not affect perfusion (Fig. 5G-I).Conclusion
Multi-model imaging showed that GEM induced hypoxia and led to synergistical effect with evofosfamide in MIA Paca-2 tumors. On the other hand, combination of evofosfamide and GEM showed synergistic effect and enhanced angiogenesis by evofosamide which led to improvement in HF10. These data can provide imaging biomarkers to detect early response to cancer therapy.Acknowledgements
No acknowledgement found.References
(1) Kishimoto S, Brender JR, Chandramouli GVR, et al. Hypoxia-Activated Prodrug Evofosfamide Treatment in Pancreatic Ductal Adenocarcinoma Xenografts Alters the Tumor Redox Status to Potentiate Radiotherapy. Antioxid Redox Signal. 2021;35(11):904-915. (2) Liu Q, Sun JD, Wang J, et al. TH-302, a hypoxia-activated prodrug with broad in vivo preclinical combination therapy efficacy: optimization of dosing regimens and schedules. Cancer Chemother Pharmacol. 2012;69(6):1487-1498. (3) de la Fuente M, Jones MC, Santander-Ortega MJ, et al. A nano-enabled cancer-specific ITCH RNAi chemotherapy booster for pancreatic cancer. Nanomedicine. 2015;11(2):369-377. (4) Matsumoto S, Kishimoto S, Saito K, et al. Metabolic and Physiologic Imaging Biomarkers of the Tumor Microenvironment Predict Treatment Outcome with Radiation or a Hypoxia-Activated Prodrug in Mice. Cancer Res. 2018;78(14):3783-3792.Figures
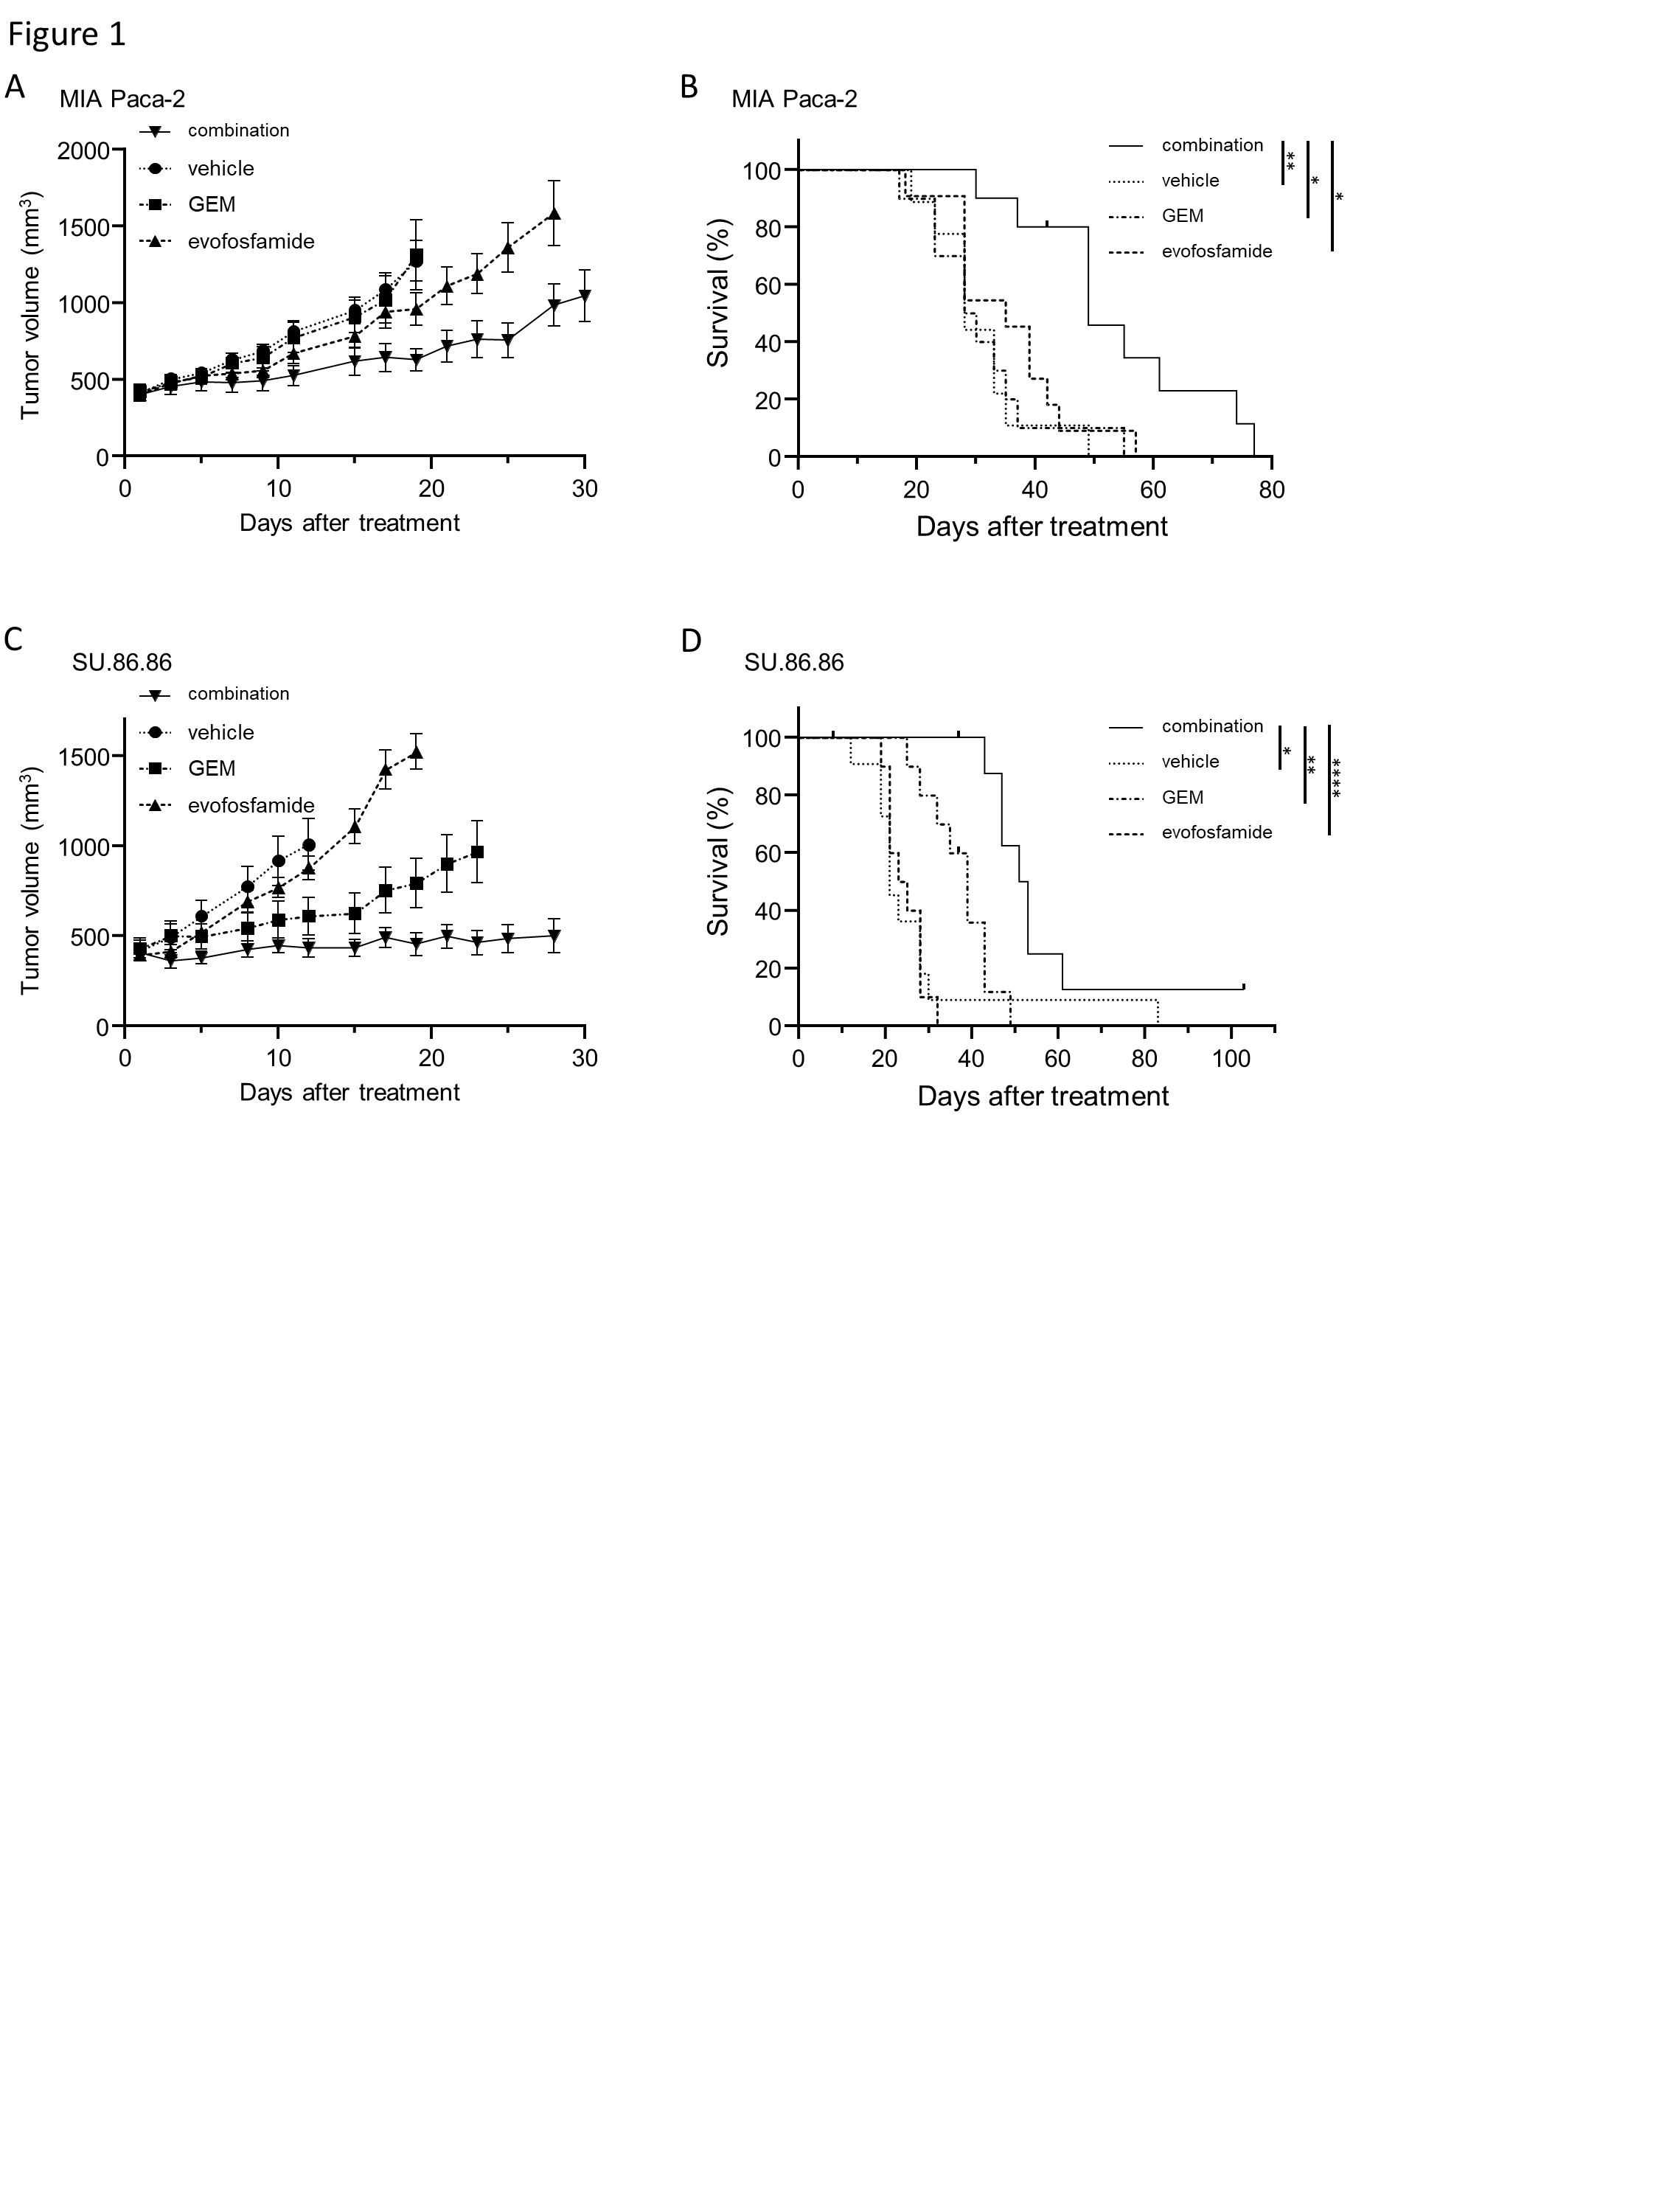
Tumor growth and survival of combination treatment
in two murine tumor models. (A and C) Growth
kinetics of each tumor. MIA Paca-2 or SU.86.86 inoculated mice were
treated with either combination of gemcitabine (GEM) and evofosfamide or GEM or
evofosamide or vehicle. Data are shown as mean ± SE at each time point. (B and
D) Kaplan-Meier survival curve for each tumor. Survival refers to the time
before reaching the maximally allowed tumor volume of 2,000 mm3. (B
and D) Statistical significance between groups was determined by
log-rank test. *p < 0.05, **p < 0.01, ****p <
0.0001
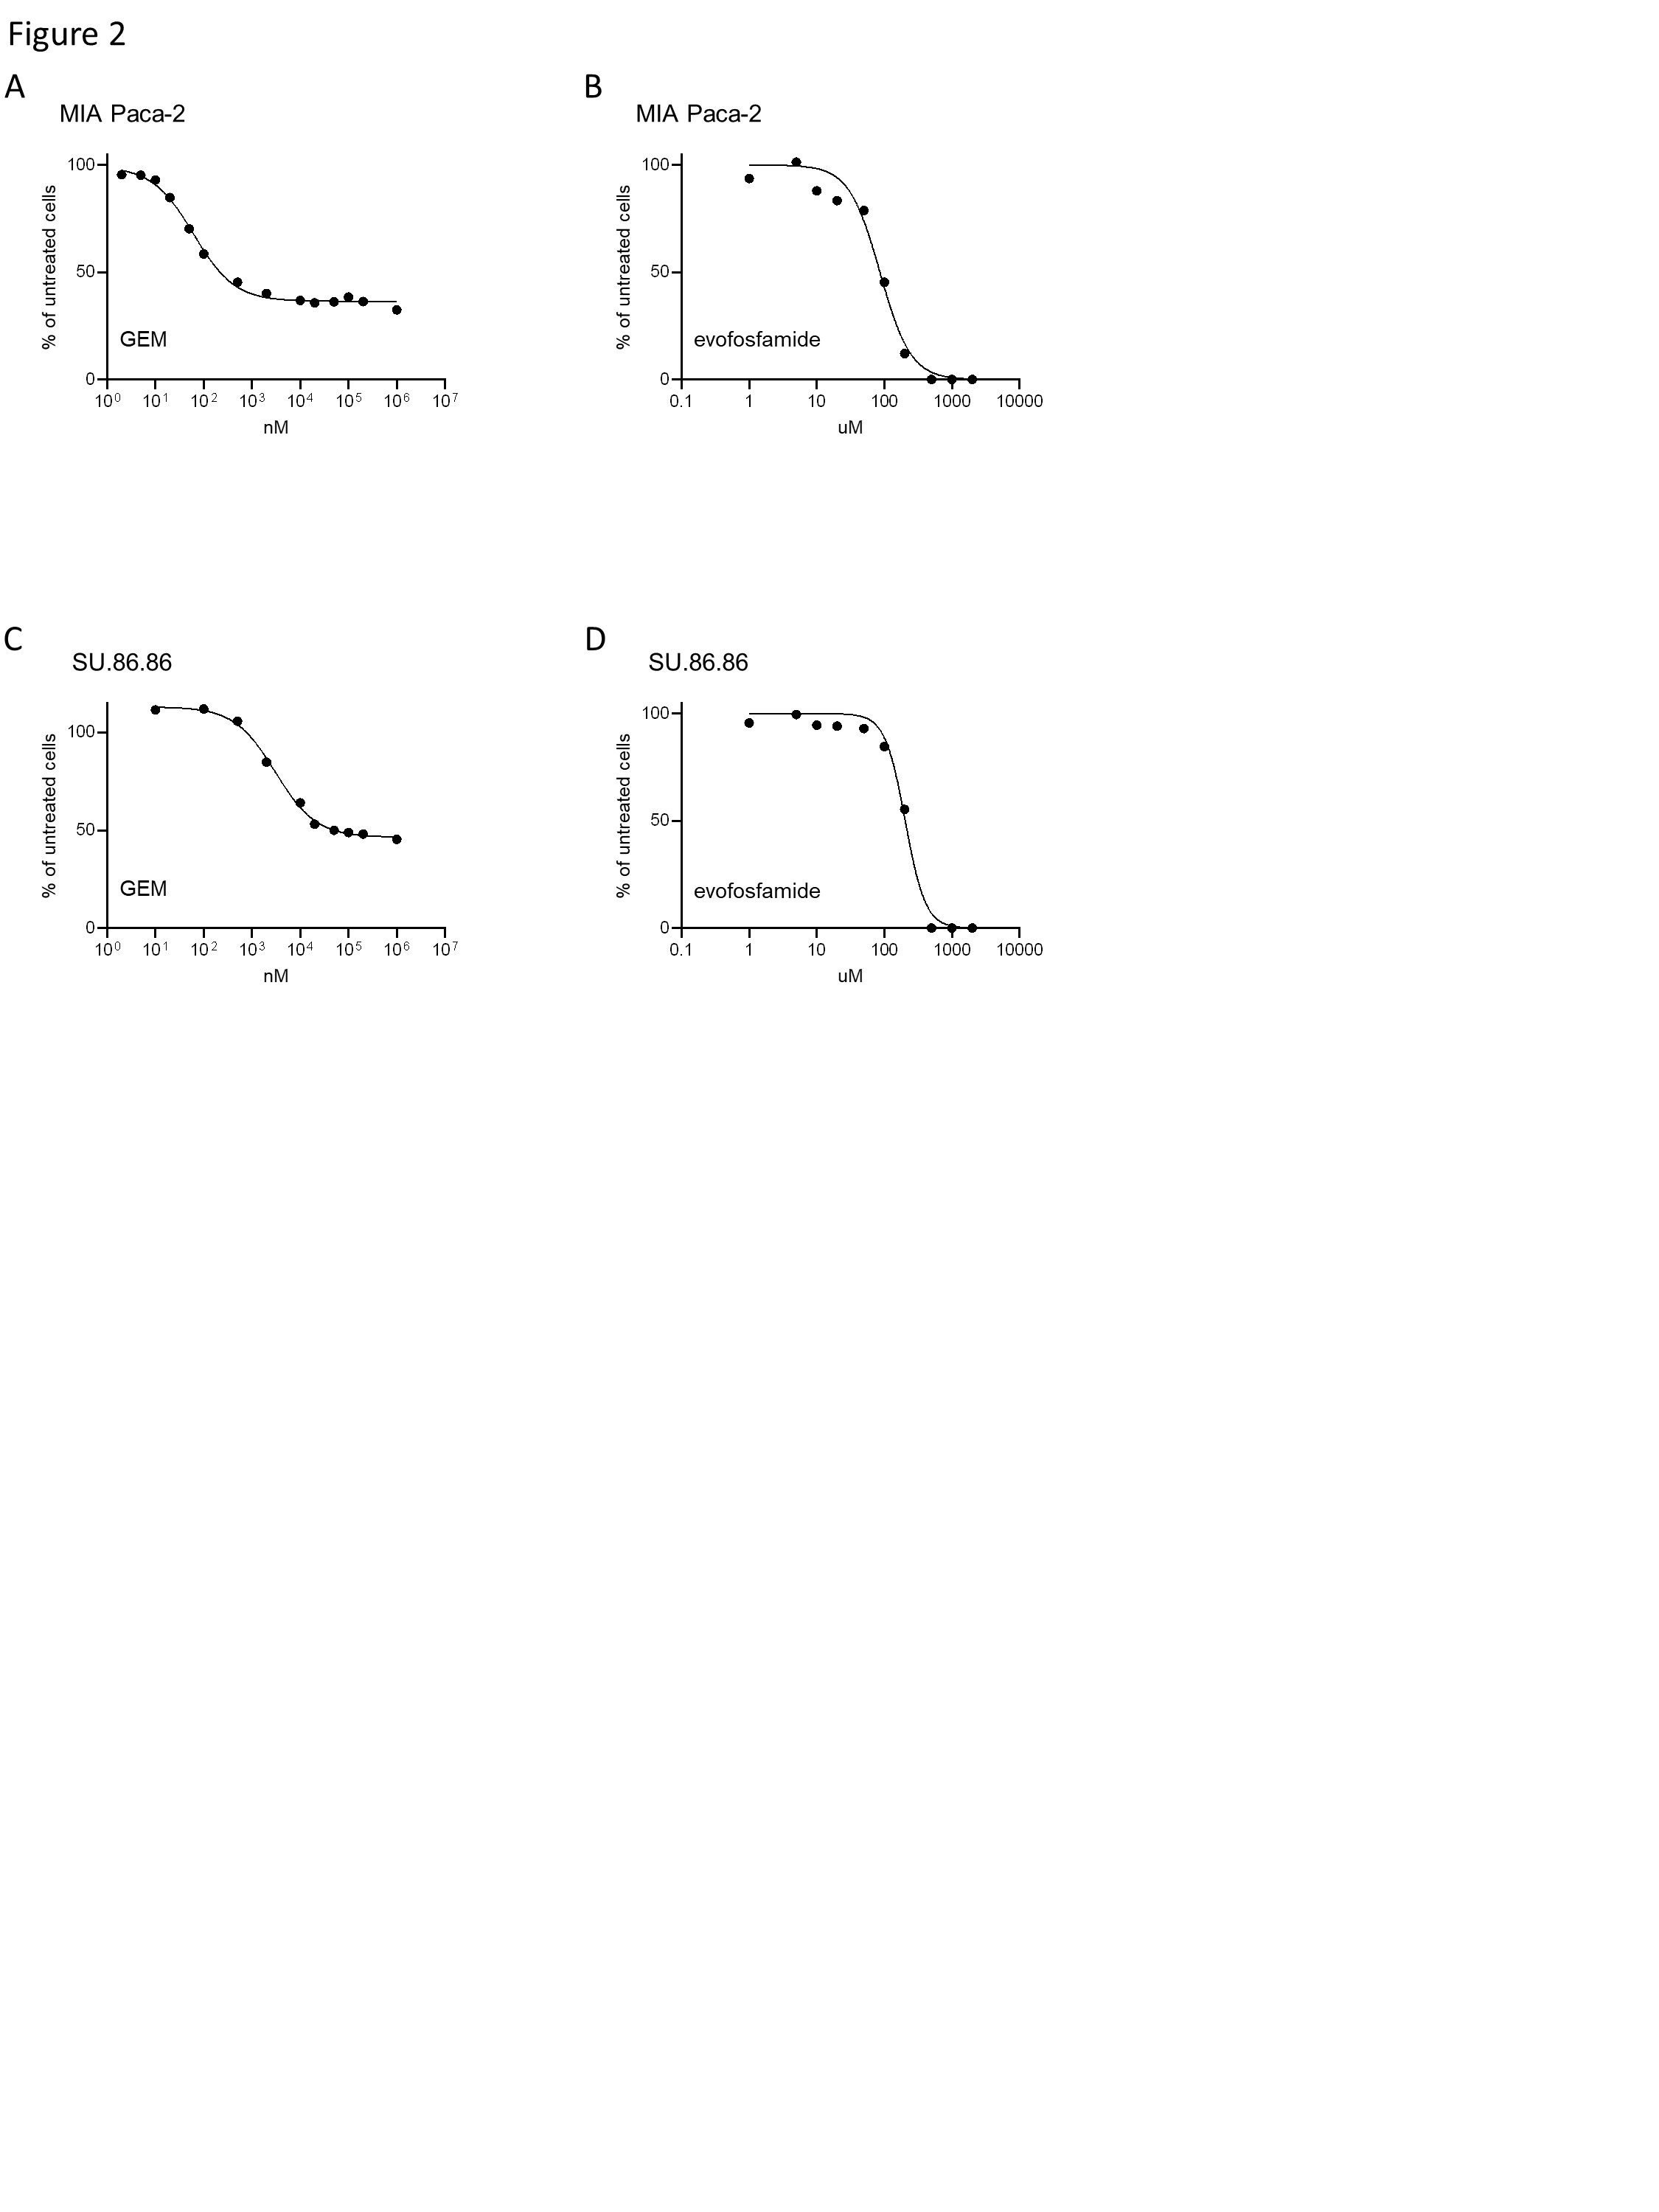
In vitro cytotoxicity evaluated after 48 h of
incubation with combination treatment. (A and C) Dose response curve
of MIA Paca-2 and SU.86.86 cells for gemcitabine (GEM) single administration. (B
and D) Dose response curve of MIA Paca-2 and SU.86.86 cells
for evofosfamide single administration.
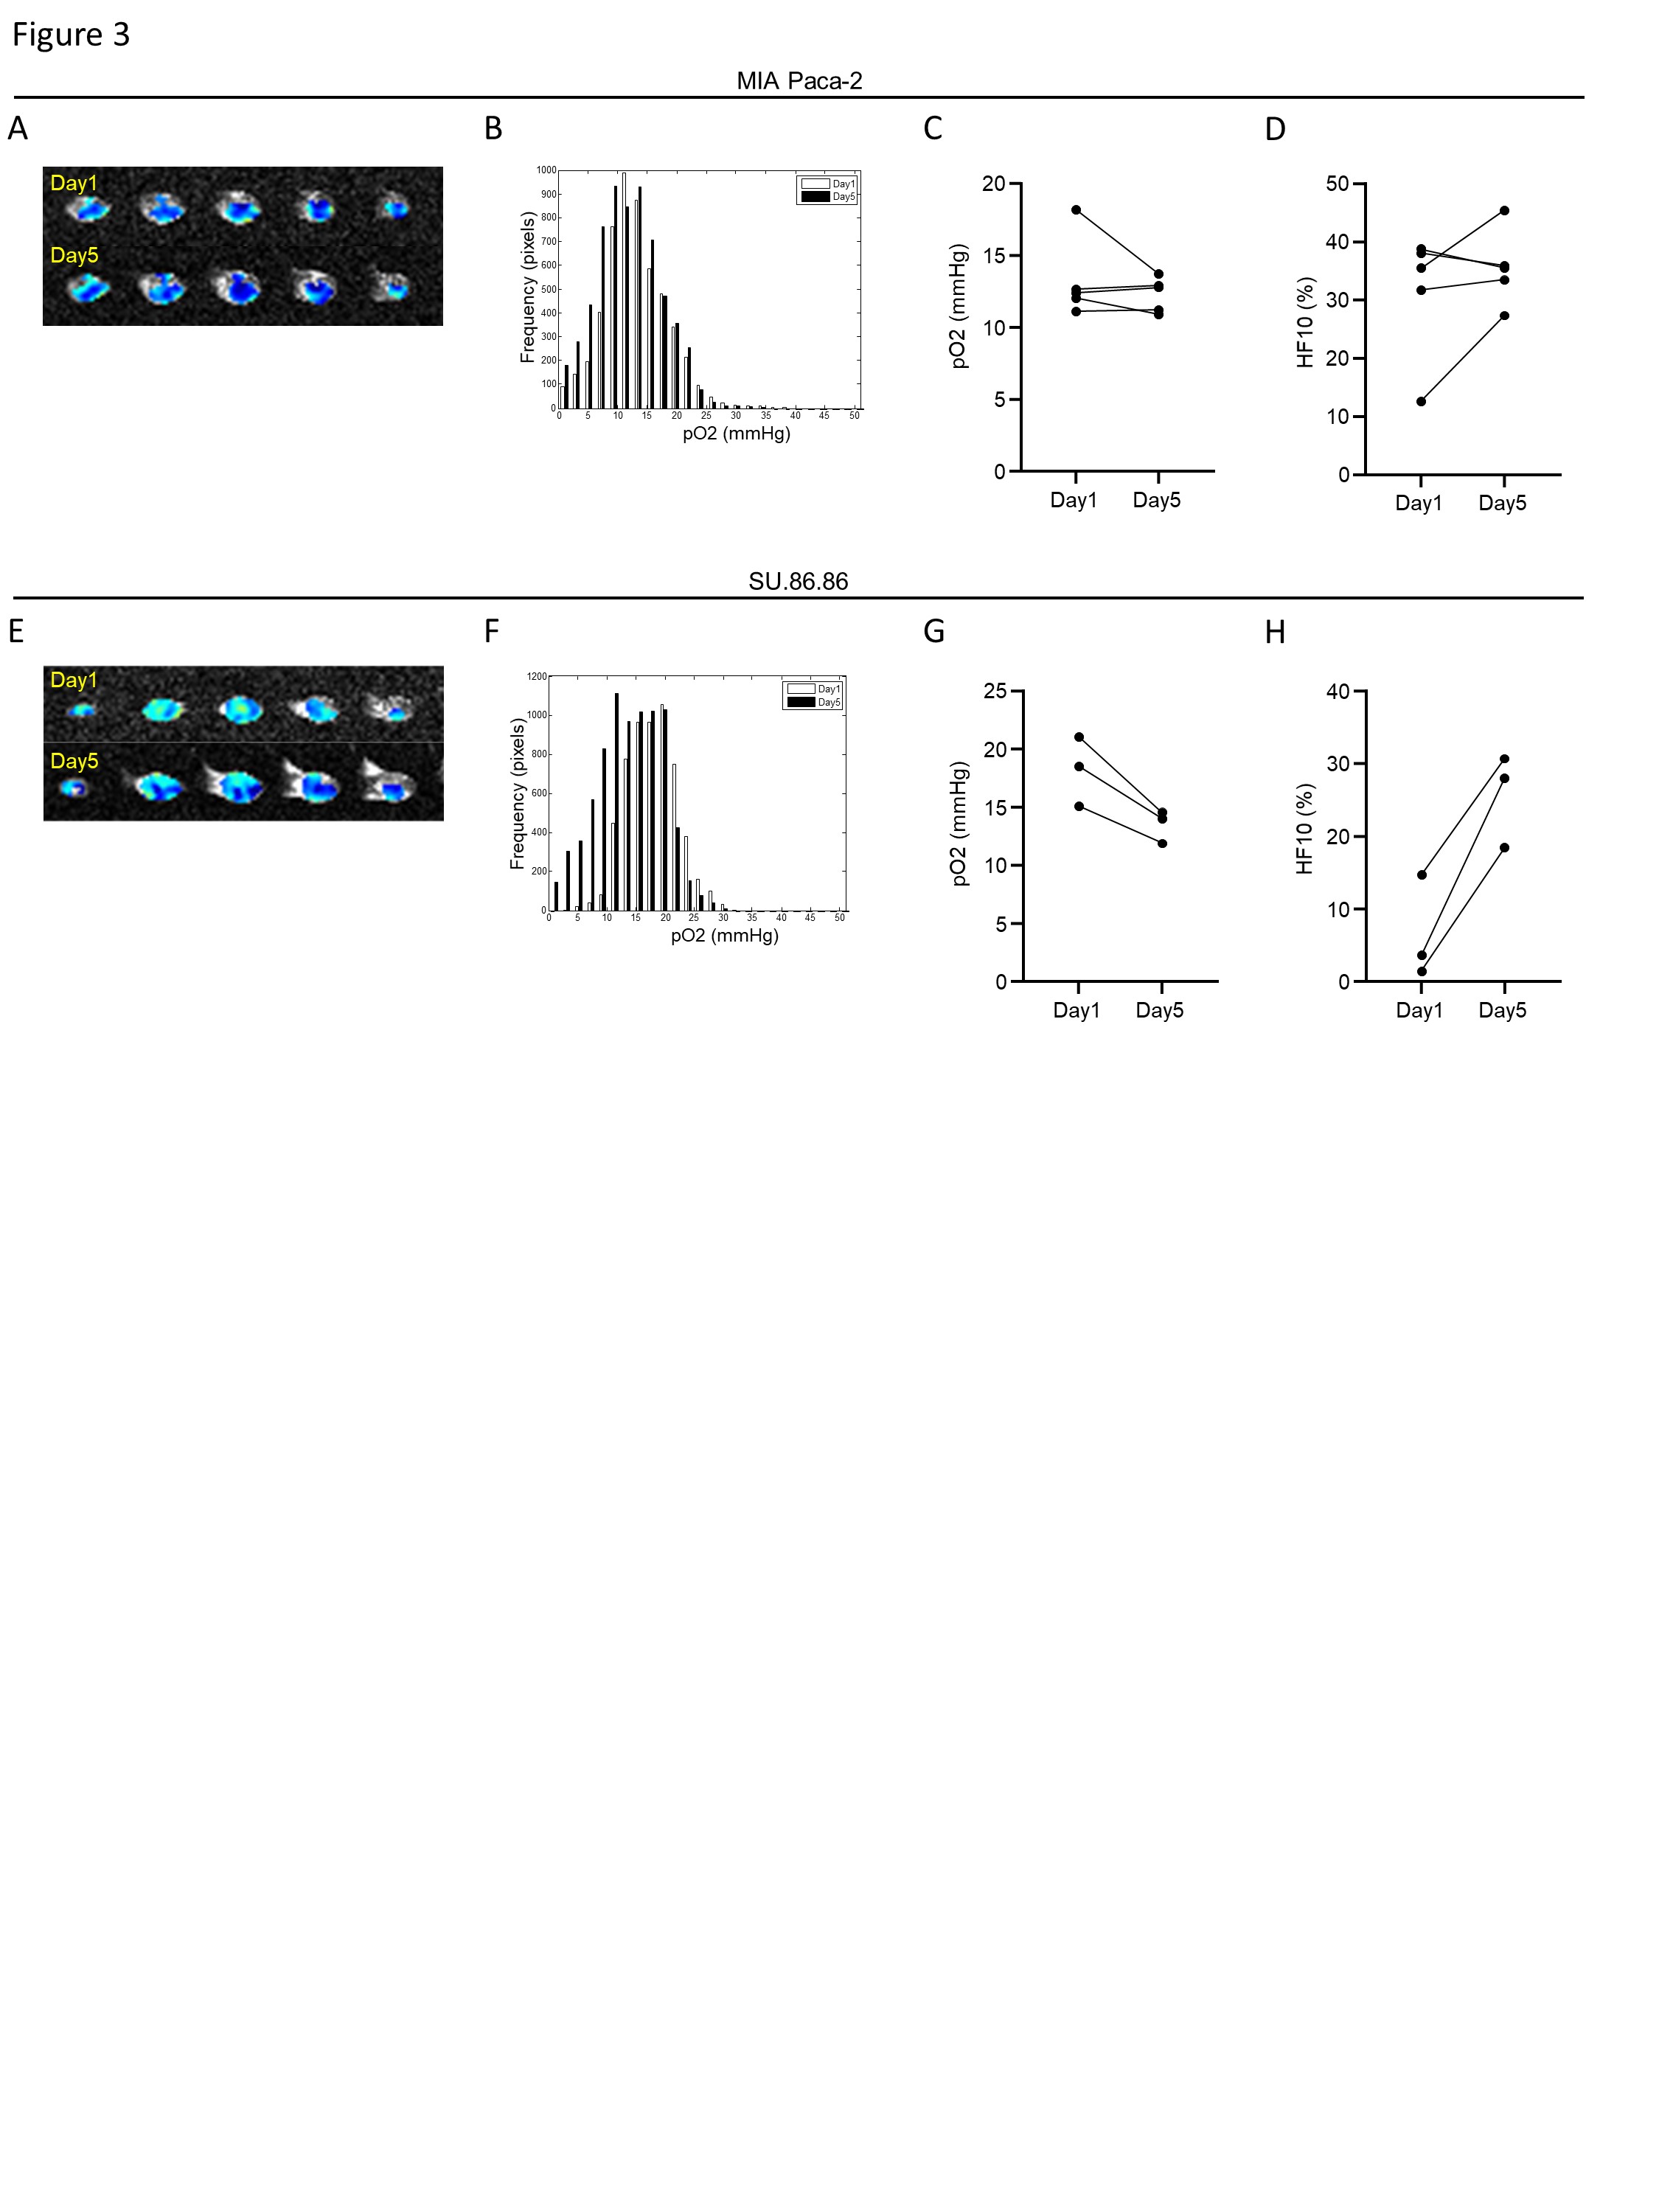
The effect of combination treatment on
EPR oximetry. EPR imaging in two murine tumor model. Tumor
bearing mice treated with vehicle were scanned before and after 5th treatment.
(A and E) Representative images from MIA Paca-2 and SU.86.86
tumors taken before and after 5th treatment. (B and F)
The frequency histogram of pO2 values before and after 5th
treatment. (C and G) The difference of pO2 after treatment with
vehicle in MIA Paca-2 and SU.86.86 tumors. (D and H) The
difference of ΔHF10 after treatment with vehicle in MIA Paca-2 and
SU.86.86 tumors.
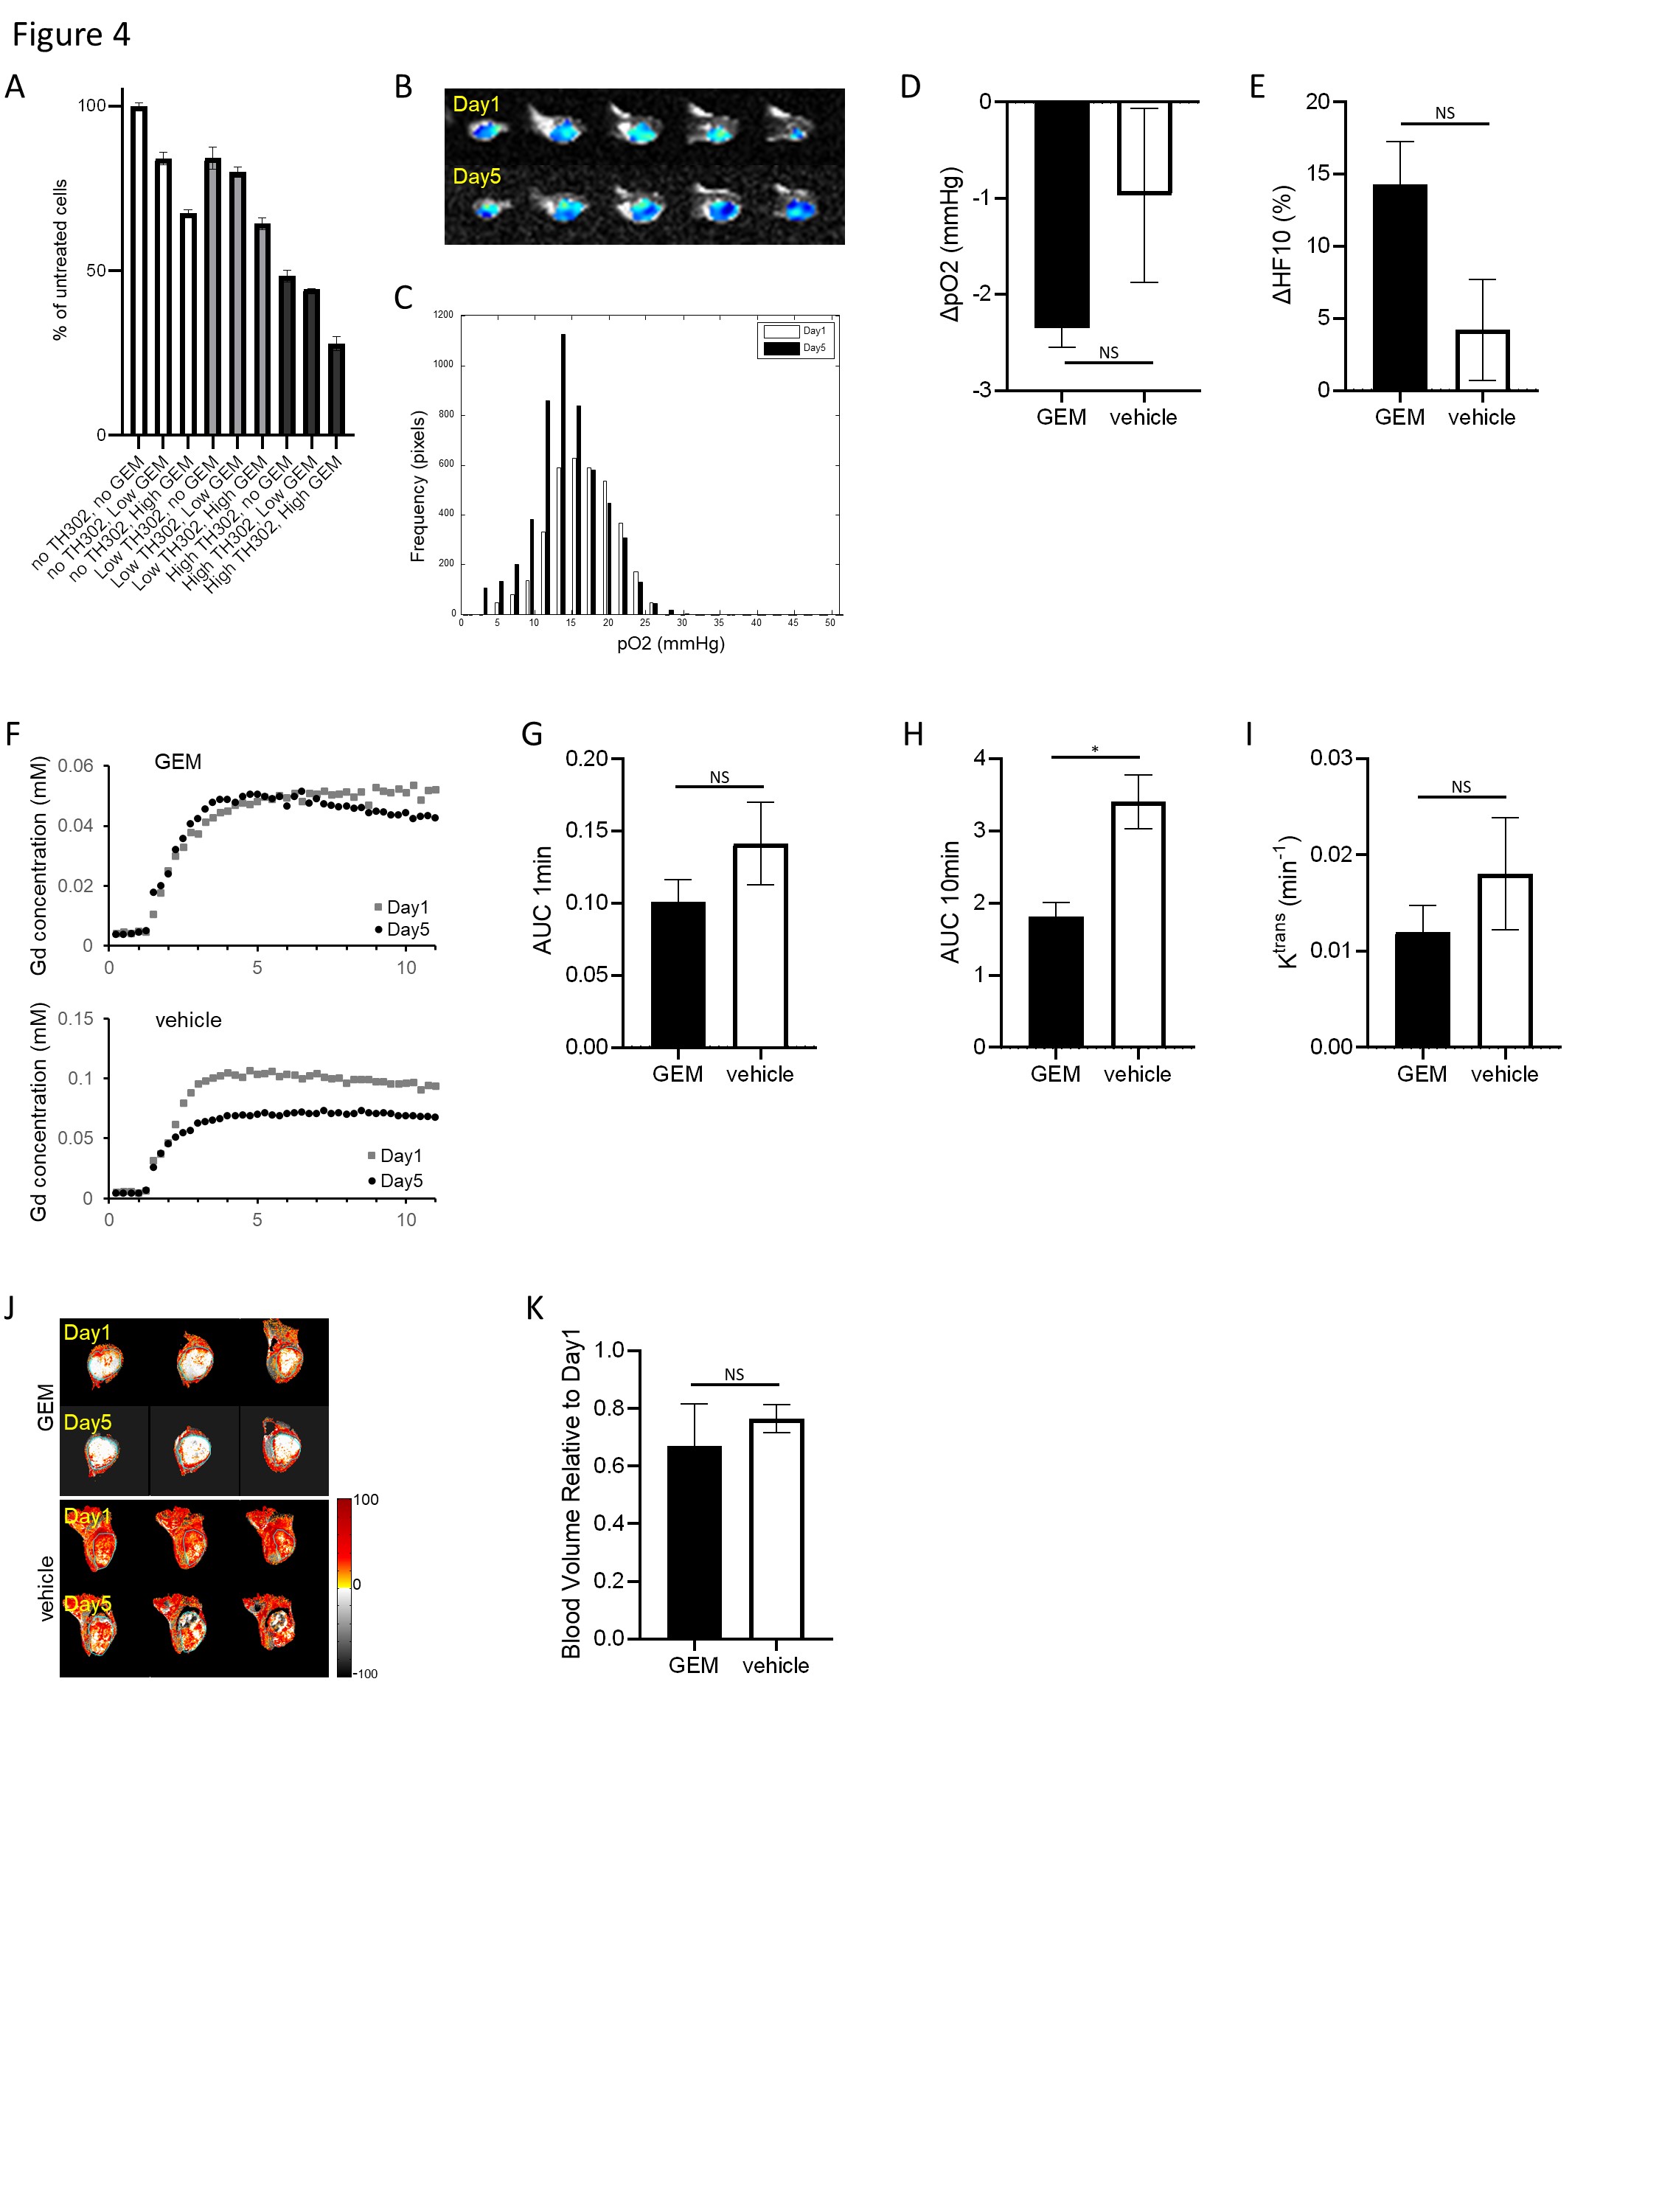
Combination treatment on MIA
Paca-2 tumors. (A) Combination treatment showed an additive
effect. (B and C) EPR images and histogram before and
after 5th treatment of GEM. (D and E) Difference of ΔpO2
and ΔHF10
between groups. (F) Time-intensity kinetic curve of DCE MRI. (G-I)
AUC 1 min, AUC 10 min and Ktrans after 5th treatment. (J)
Blood volume images taken before and after 5th treatment. (K)
The blood volume of Day5 relative to Day1. Data are shown as mean ± SE.
Statistical significance between groups was determined by Student t test.
*p < 0.05.
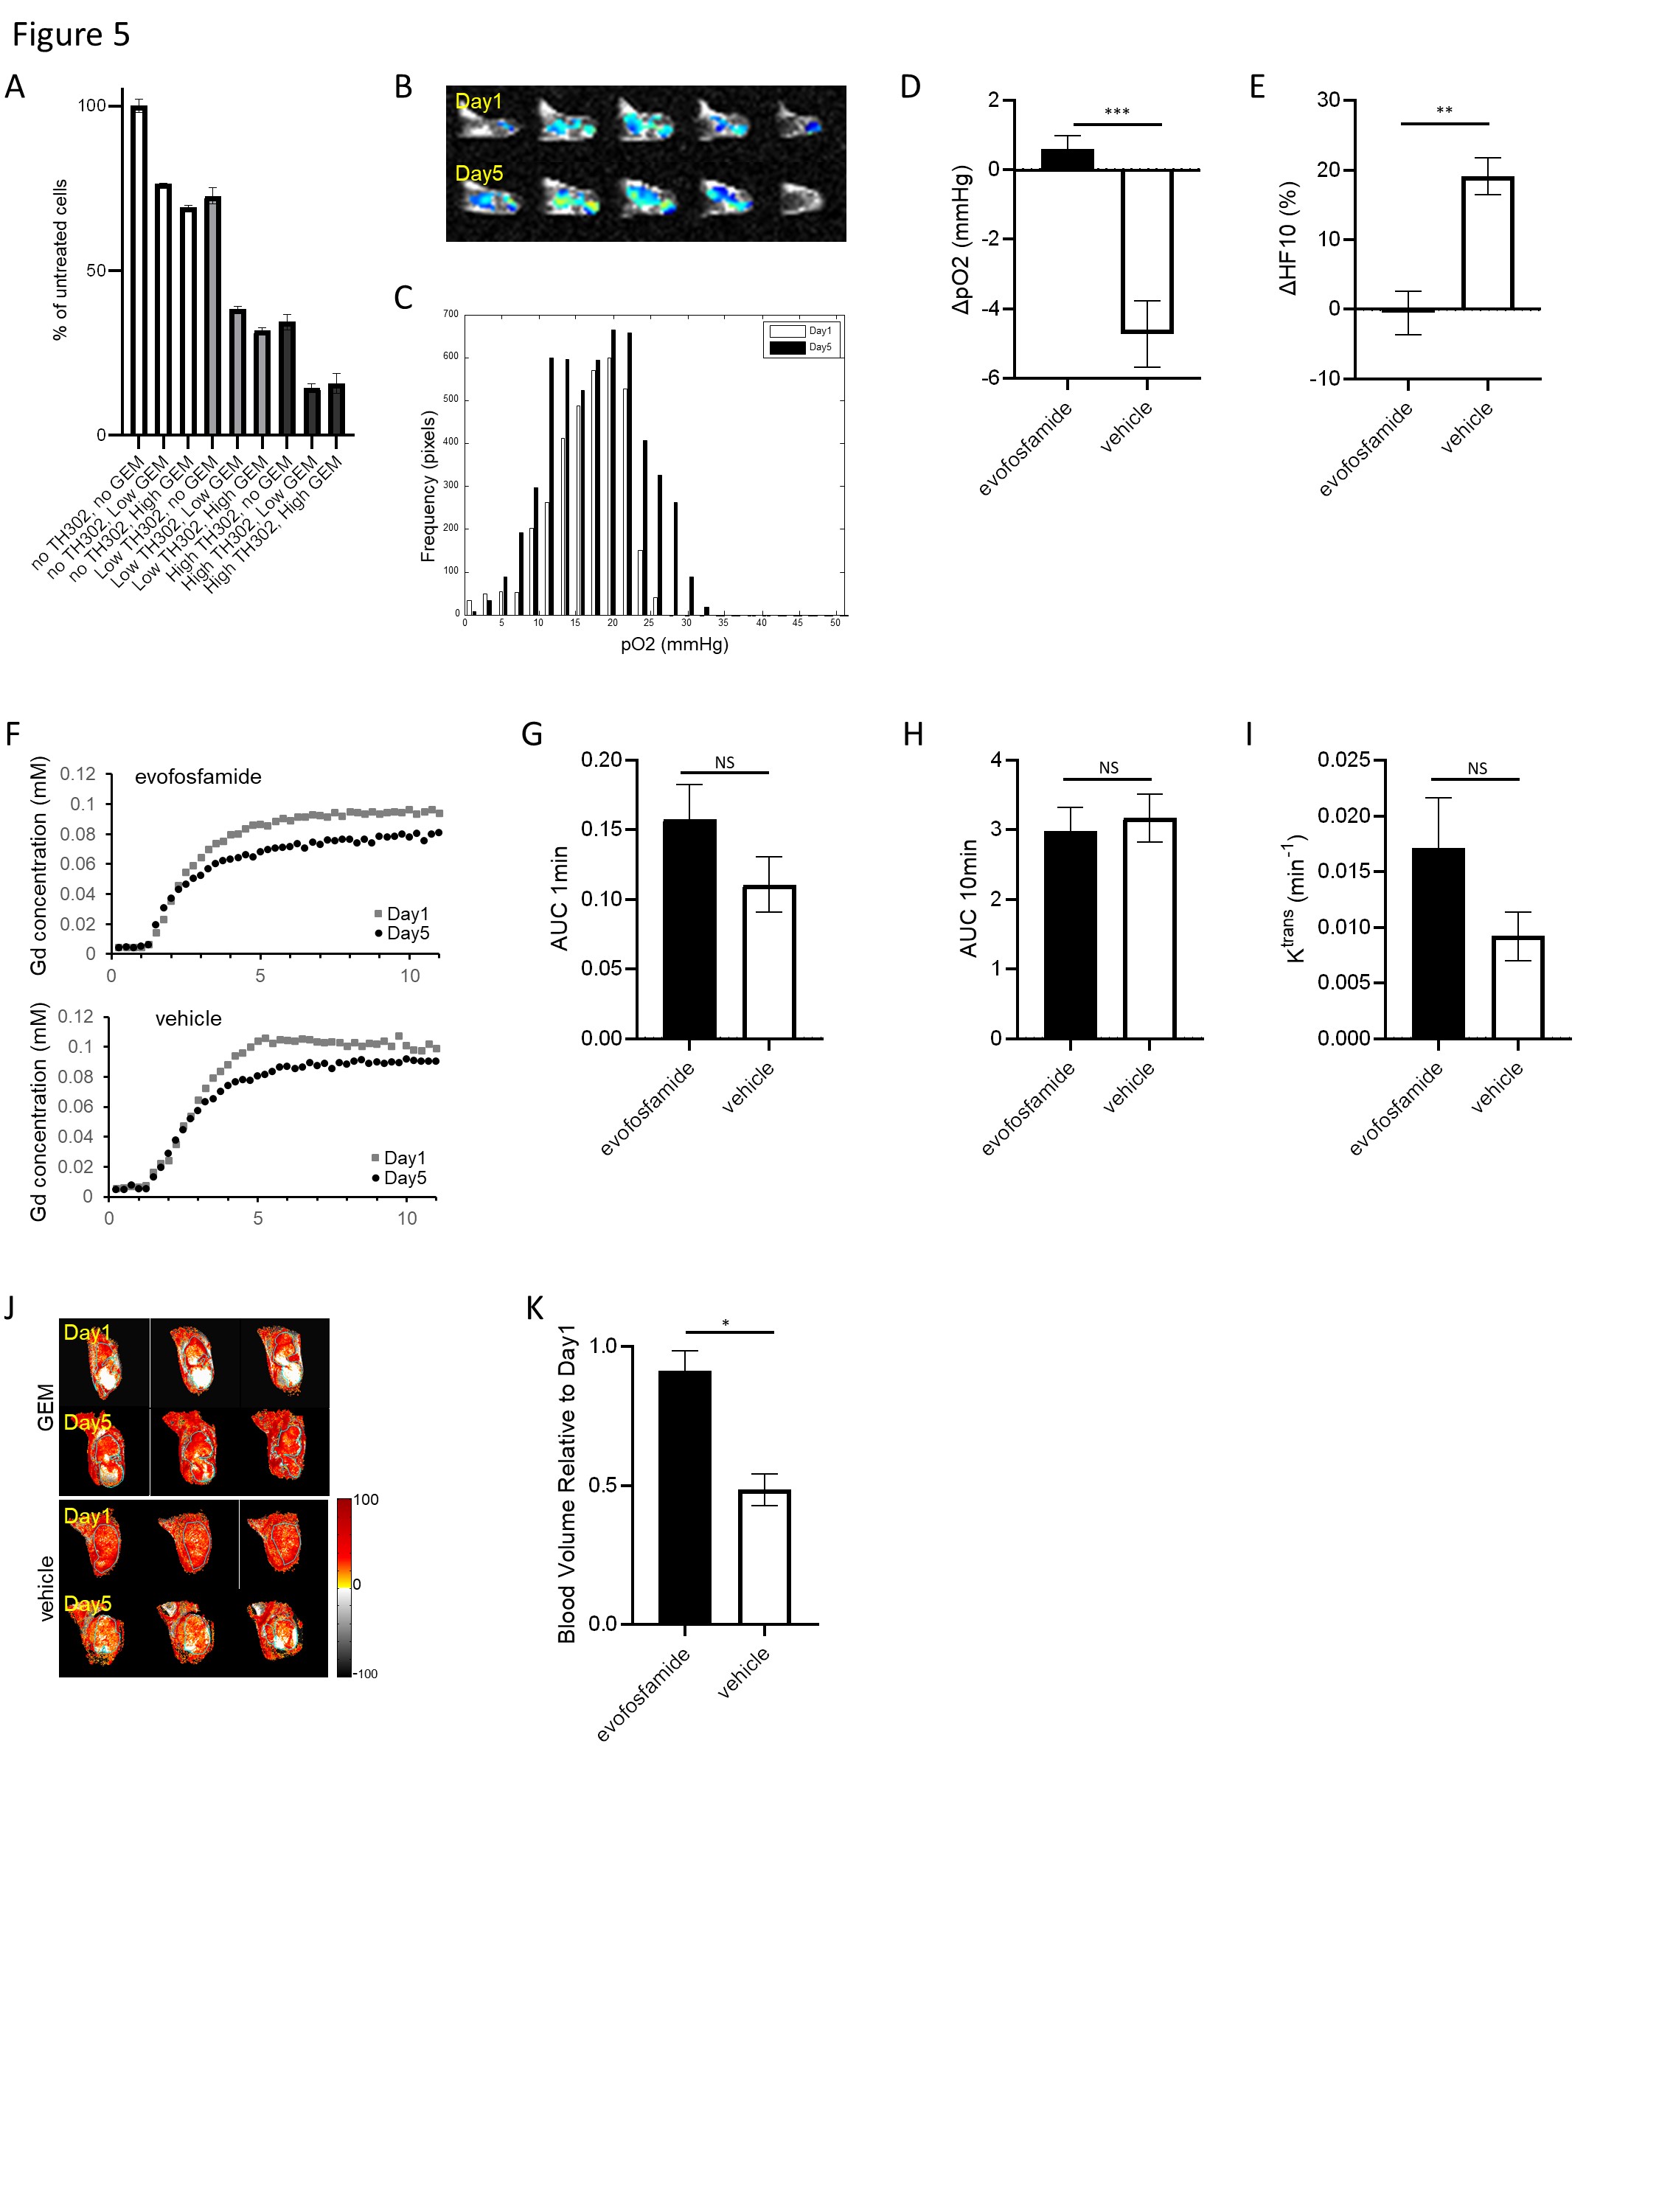
Figure 5. Combination treatment on
SU.86.86 tumors. (A) Combination treatment showed a
synergistic effect. (B and C) EPR images and histogram
before and after 5th treatment of evofosfamide. (D and E)
Difference of ΔpO2
and ΔHF10
between groups. (F) Time-intensity kinetic curve of DCE MRI. (G-I) AUC 1 min, AUC 10 min and Ktrans after
5th treatment. (J) Blood volume images taken before and after
5th treatment. (K) The blood volume of Day5 relative to Day1.
Data are shown as mean ± SE. Statistical significance between groups was
determined by Student t test. *p < 0.05; ** p <
0.01; *** p < 0.001.
DOI: https://doi.org/10.58530/2022/3431