3430
DWI Metrics Differentiating Intraductal Papillary Mucinous Neoplasms from Pancreatic Cancer: A study in GEM Models1Department of Radiology, University of Pennsylvania, Philadelphia, PA, United States, 2University of Pennsylvania, Philadelphia, PA, United States, 3University of Cambridge, Cambridge, United Kingdom
Synopsis
Intraductal Papillary Mucinous Neoplasms (IPMN) are recognized as important precursors to invasive pancreatic ductal adenocarcinoma (PDAC). While IPMN requires surveillance without treatment, a clinical marker is lacking which can identify those undergoing malignant transformation. In two genetic engineered mouse models (KPC and CKS), which resemble human PDAC and IPMN, respectively, we tested the hypothesis that differences in cellular architecture and stromal features between PDAC and IPMN present themselves in DW-MRI and /or DCE-MRI metrics. Our data revealed an almost complete separation of ADC values between CKS (benign) vs. KPC (malignant) tumors and identified histopathological features corroborating the imaging metrics.
Introduction
Human pancreatic ductal adenocarcinoma (PDAC) has prevailing genetic signatures including KRAS, TP53mutation and/or SMAD4 deletion. Hence, genetic engineered mouse (GEM) models provide powerful tools to study malignant transformation. Mice with simultaneous mutations of KRAS and TP53 in pancreas epithelium (KrasG12D:Trp53R172H:Pdx1-Cre, referred to as KPC) develop tumors resembling human PDAC with high penetrance and reproducible kinetics[1, 2]. In contrast, mice carrying KRASG12Dand SMAD4 deletion (KrasG12D:Smad4L/L:Ptf1a-Cre, CKS) harbor tumors that resemble human intraductal papillary mucinous neoplasms (IPMN) [3]. IPMN is considered premalignant thus surgical excision is not recommended until progression to malignant PDAC is suspected. However, there is no clinical biomarker that can guide management of IPMN patients. DW-MRI and DCE-MRI are two clinic translated quantitative imaging methods sensitive to tumor cellularity and the stromal microenvironment. We hypothesize that differences in cellular architecture and stromal features between PDAC and IPMN can be revealed by DW-MRI and/or DCE-MRI metrics. We test this hypothesis by comparing MRI metrics for KPC versus CKS models alongside detailed histopathological analyses.Methods
A total of 44 KPC and 20 CKS mice were studied in DW-MRI, of which 21 and 11 respectively were studied in DCE-MRI. A group of 11 KPC mice with similar tumor volumes was for comparison with the CKS group. 5 KPC and 7 CKS mice were studied in histopathology, with small overlap with MRI mice. In vivo MRI was performed on a 9.4T Avance III (Bruker, Berillica, MA) equipped with a 12-cm, 40 gauss/cm gradient coil with a maximum slew rate of 11.5 T/cm sec. Animal preparation and vital signs monitoring during MRI were described by us elsewhere [4-6]. Radial k-space sampling diffusion-weighted spin echo protocol (Rad-SE-DW), reconstruction and analyses were developed recently [6] and optimized here (e.g., respiration gating was deemed unnecessary). Golden-angle radial 3D acquisition (stack-of-star, SOS) was initially developed by HKS (coauthor) on clinical MRI [7], has been reverse engineered to animal 9.4T spectrometer and applied to B1 and T1 mapping and DCE series during DCE-MRI (detailed in the abstract by Pickup). From DW-MRI: apparent diffusion coefficient (ADC) and kurtosis index (KI) were obtained. From DCE-MRI: tumor T1, Ktrans, and Ve indices were obtained using a reference region model [8, 9]. All immunohistopathological studies were performed on FFPE tissue sections stained for H&E, Sirius Red (collagen) or CD31 (microvasculature). Stained sections were digitized using AperioScanScope(Leica) and analyzed in QuPath[10]. Two-tailed tests were conducted to compare metrics between the two models.Results
On T2W MRI, KPC tumor presents as a single, solid tumor, consistent with gross dissection (Fig 1A). In contrast, CKS tumor presents as a lobulated mass with small cysts featuring high signals (Fig 1B). DW images of both GEM models are free of respiratory motion artifacts even at the highest b value, leading to good quality ADC and KI maps (Fig 2A-B). ADC values of CKS tumors are significantly higher than KPC tumors with almost no overlap (Fig 2C), while KI (non-gaussian diffusion) values are significantly lower in CKS model (Fig 2D) – MRI metrics are summarized in Table-1.We identified several cellular architecture and histological features which may underlie the distinct DWI metrics between the two GEM models (Table-2). H&E stains suggest that the KPC model has an abrupt invasive adenocarcinoma tumor formation without intra-ductal growth (Fig 3A-B with magnified region in Fig 3C-D). In contrast, CKS tumors are initiated from multifocal epithelial proliferation within ducts; the growth pattern shows folding and papillary architecture resembling the human IPMN; the multi-focal CKS tumors are relatively small with residual, mucin-containing pancreatic acinar parenchyma (Fig 2E-F with magnified region in Fig 2G-H). The KPC adenocarcinoma formation is much smaller than the intra-ductal gland architecture in the CKS model (Fig 3C-D vs. Fig 3E-F). Features corroborating high ADC and low KI in CKS tumors include: 1. Intraductal cystic growth; 2. Less dense tumor bed as the result of multiple colonies as opposed to abrupt tumor formation from a single colony for KPC. Cell density was shown to be significantly higher in the KPC specimens when entire sections were compared (Table-2).
The SOS protocol results in DCE series without respiratory motion blurring. Fig 3A and B reveal high resolution Ktrans maps of a KPC and CKS tumor respectively. A poorly perfused center surrounded by a well-perfused rim is typical for KPC tumors, which is consistent with CD31 staining distribution (data not shown), whereas Ktrans of CKS tumors is more uniform. Group-wise, CKS tumors higher Ve (p = 0.09) and significantly lower T1 values than KPC model (Table-1). Compared to CKS, KPC exhibits a trend of significantly lower Ktrans values accompanied by a significantly higher microvascular density (Table-2).
Discussion
Quantitative DCE- and DW-MRI combined with detailed immunohistochemistry elucidate histopathological bases of imaging metrics. The paradoxical finding between high microvascular density vs. low Ktrans values in KPC might be explained by its high interstitial fluid pressure [11], which would reduce or shutdown vascular perfusion and/or permeability in KPC tumors.Conclusion
CKS model resembles key features of human IPMN. Cystic growth of CKS underlies their distinctly higher ADC values, thereby not overlapping with the KPC tumor’s ADCs, and therefore, this metric might be used to distinguish IPMN from malignant PDAC.Acknowledgements
Funding support from NIH : U24-CA-231858References
[1] S.R. Hingorani, L. Wang, A.S. Multani, C. Combs, T.B. Deramaudt, R.H. Hruban, A.K. Rustgi, S. Chang, D.A. Tuveson, Cancer Cell, 7 (2005) 469-483.
[2] S.R. Hingorani, E.F. Petricoin, A. Maitra, V. Rajapakse, C. King, M.A. Jacobetz, S. Ross, T.P. Conrads, T.D. Veenstra, B.A. Hitt, Y. Kawaguchi, D. Johann, L.A. Liotta, H.C. Crawford, M.E. Putt, T. Jacks, C.V. Wright, R.H. Hruban, A.M. Lowy, D.A. Tuveson, Cancer Cell, 4 (2003) 437-450.
[3] N. Bardeesy, K.H. Cheng, J.H. Berger, G.C. Chu, J. Pahler, P. Olson, A.F. Hezel, J. Horner, G.Y. Lauwers, D. Hanahan, R.A. DePinho, Genes & development, 20 (2006) 3130-3146.
[4] P. Bagga, S. Pickup, R. Crescenzi, D. Martinez, A. Borthakur, K. D'Aquilla, A. Singh, G. Verma, J.A. Detre, J. Greenberg, H. Hariharan, R. Reddy, Scientific reports, 8 (2018) 2883.
[5] J. Cao, S. Pickup, C. Clendenin, B. Blouw, H. Choi, D. Kang, M. Rosen, P.J. O'Dwyer, R. Zhou, Clin Cancer Res, 25 (2019) 2314-2322.
[6] J. Cao, H.K. Song, H. Yang, V. Castillo, J. Chen, C. Clendenin, M. Rosen, R. Zhou, S. Pickup, Tomography : a journal for imaging research, 7 (2021) 66-79.
[7] H.K. Song, L. Dougherty, Magn Reson Med, 44 (2000) 825-832.
[8] T.E. Yankeelov, J.J. Luci, M. Lepage, R. Li, L. Debusk, P.C. Lin, R.R. Price, J.C. Gore, Magnetic Resonance Imaging, 23 (2005) 519-529.
[9] J. Cárdenas-Rodríguez, C.M. Howison, M.D. Pagel, Magn Reson Imaging, 31 (2013) 497-507.
[10] P. Bankhead, M.B. Loughrey, J.A. Fernández, Y. Dombrowski, D.G. McArt, P.D. Dunne, S. McQuaid, R.T. Gray, L.J. Murray, H.G. Coleman, J.A. James, M. Salto-Tellez, P.W. Hamilton, Scientific reports, 7 (2017) 16878.
[11] P.P. Provenzano, C. Cuevas, A.E. Chang, V.K. Goel, D.D. Von Hoff, S.R. Hingorani, Cancer Cell, 21 (2012) 418-429.
Figures
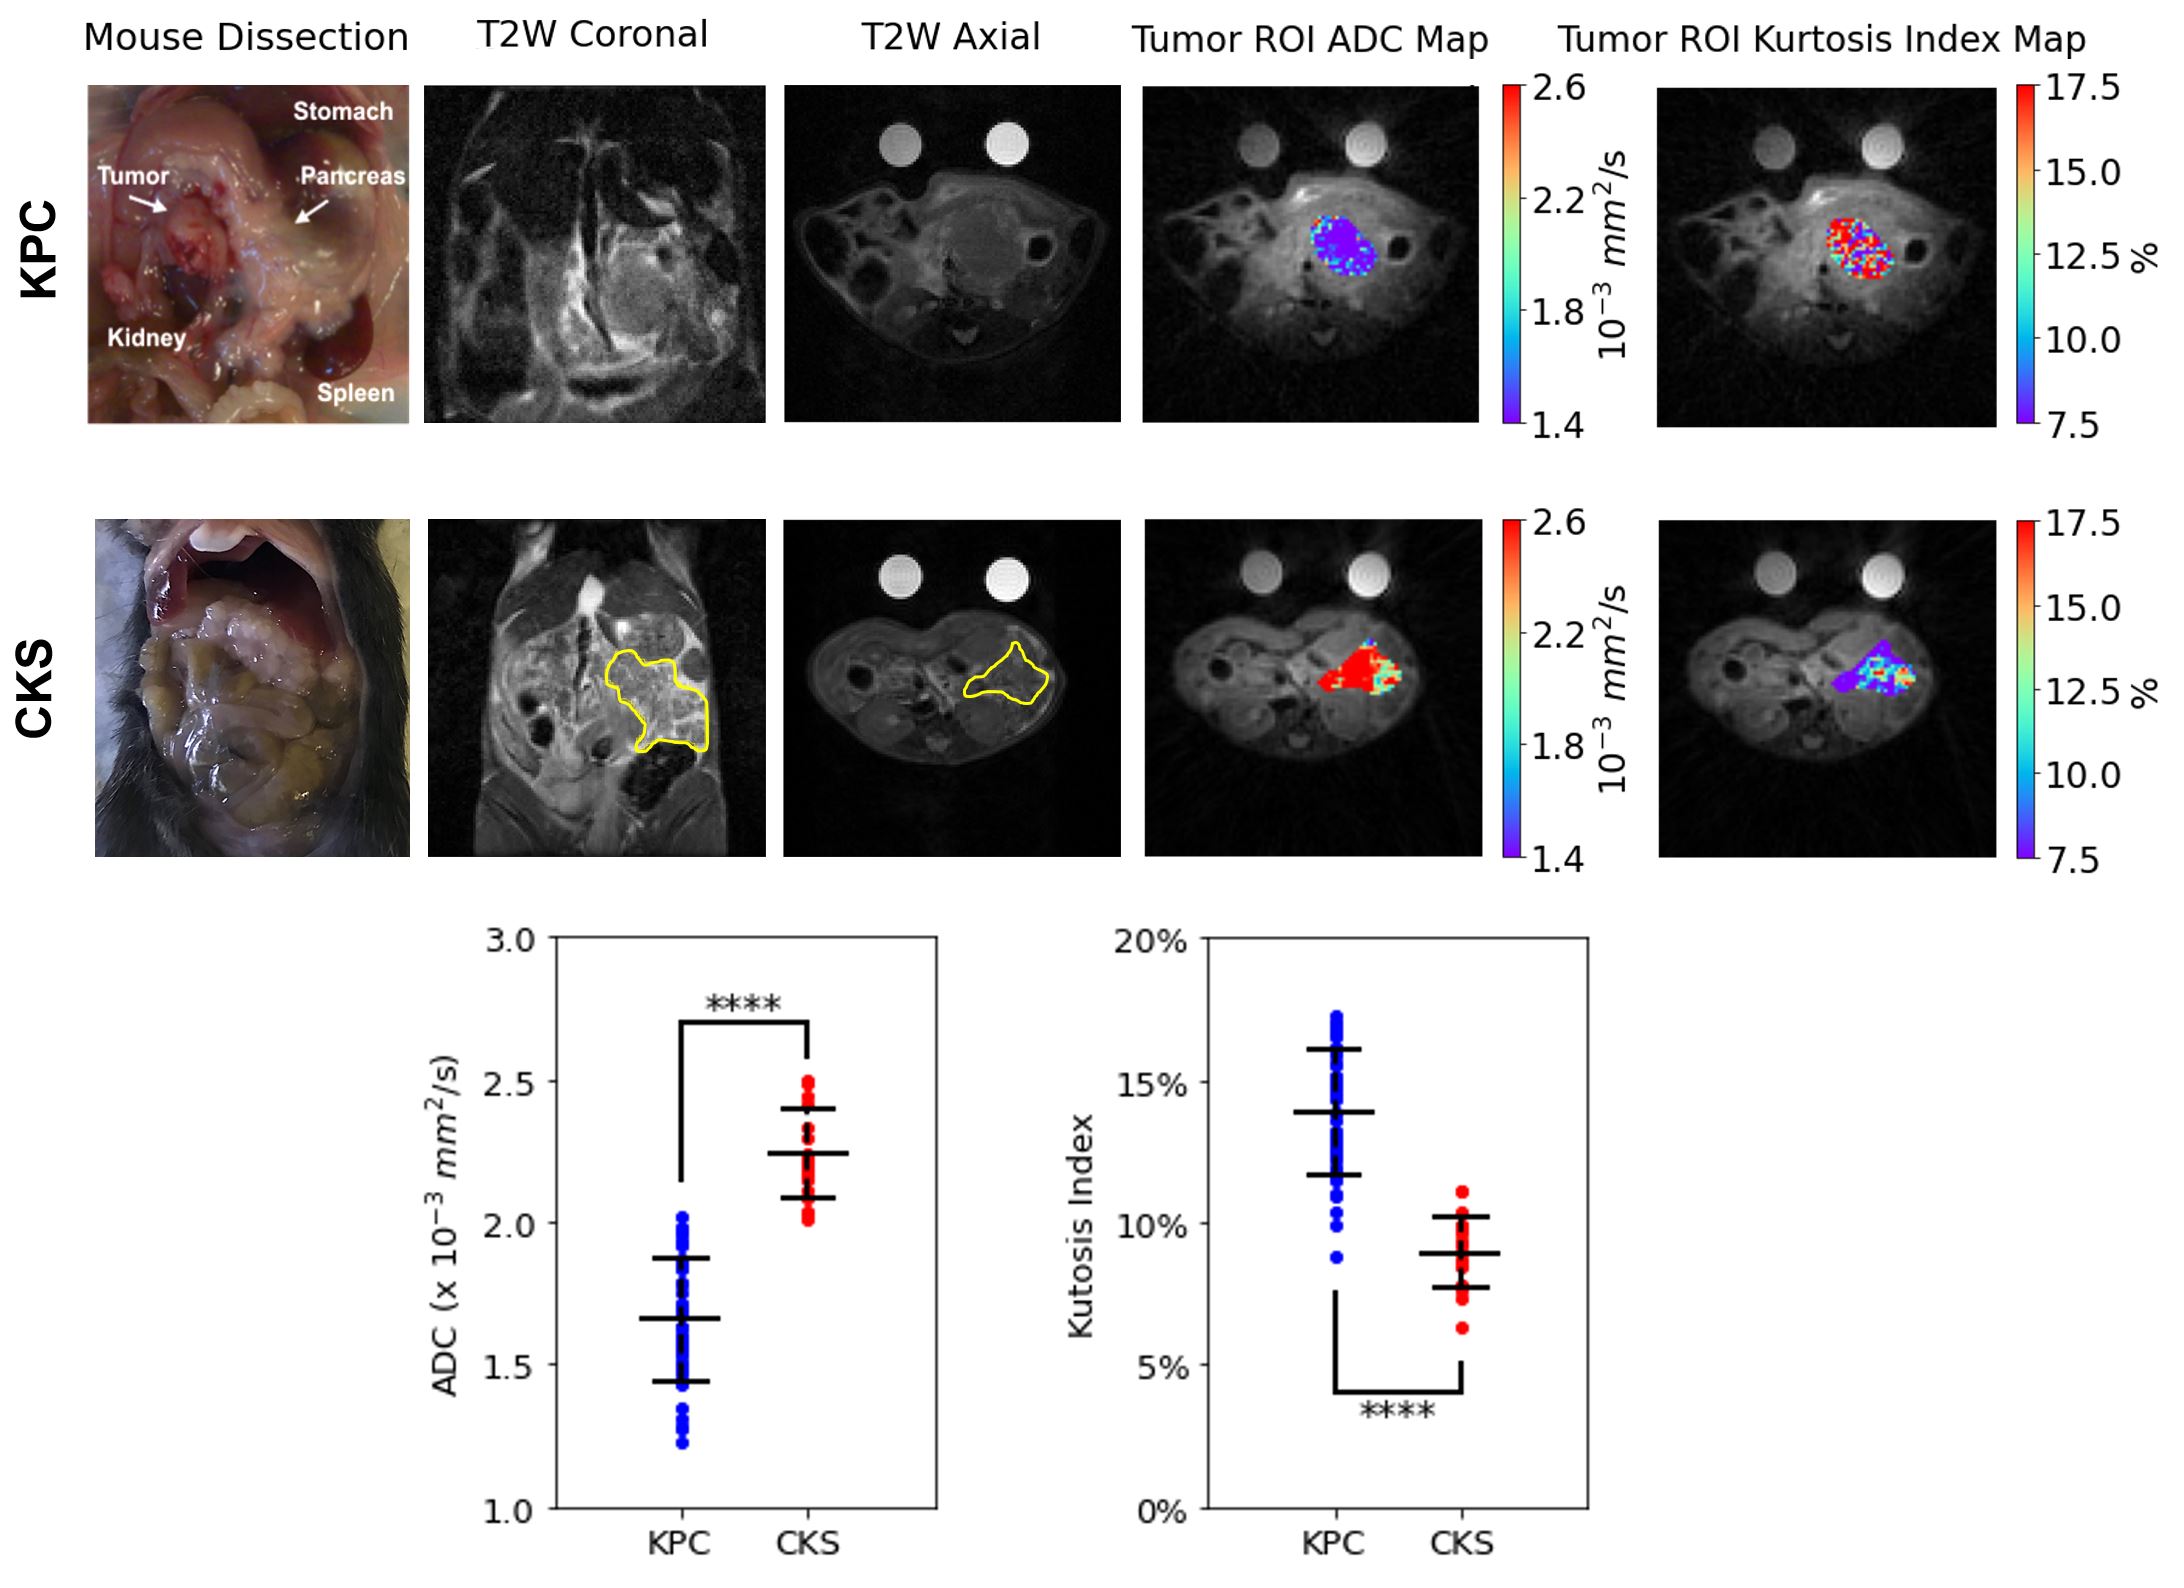
Figure 1: T2-Weighted MRI, and gross dissection of KPC and CKS mice and DW-MRI metrics comparison.
Pictures of gross dissection (post-mortem) for KPC and CKS mice shown with coronal and axial views of T2W MR images, ADC and KI maps. ADC values are plotted for all tumors with mean and standard deviation (error bars). p-values are obtained from student’s t-test with alpha set at 0.05.
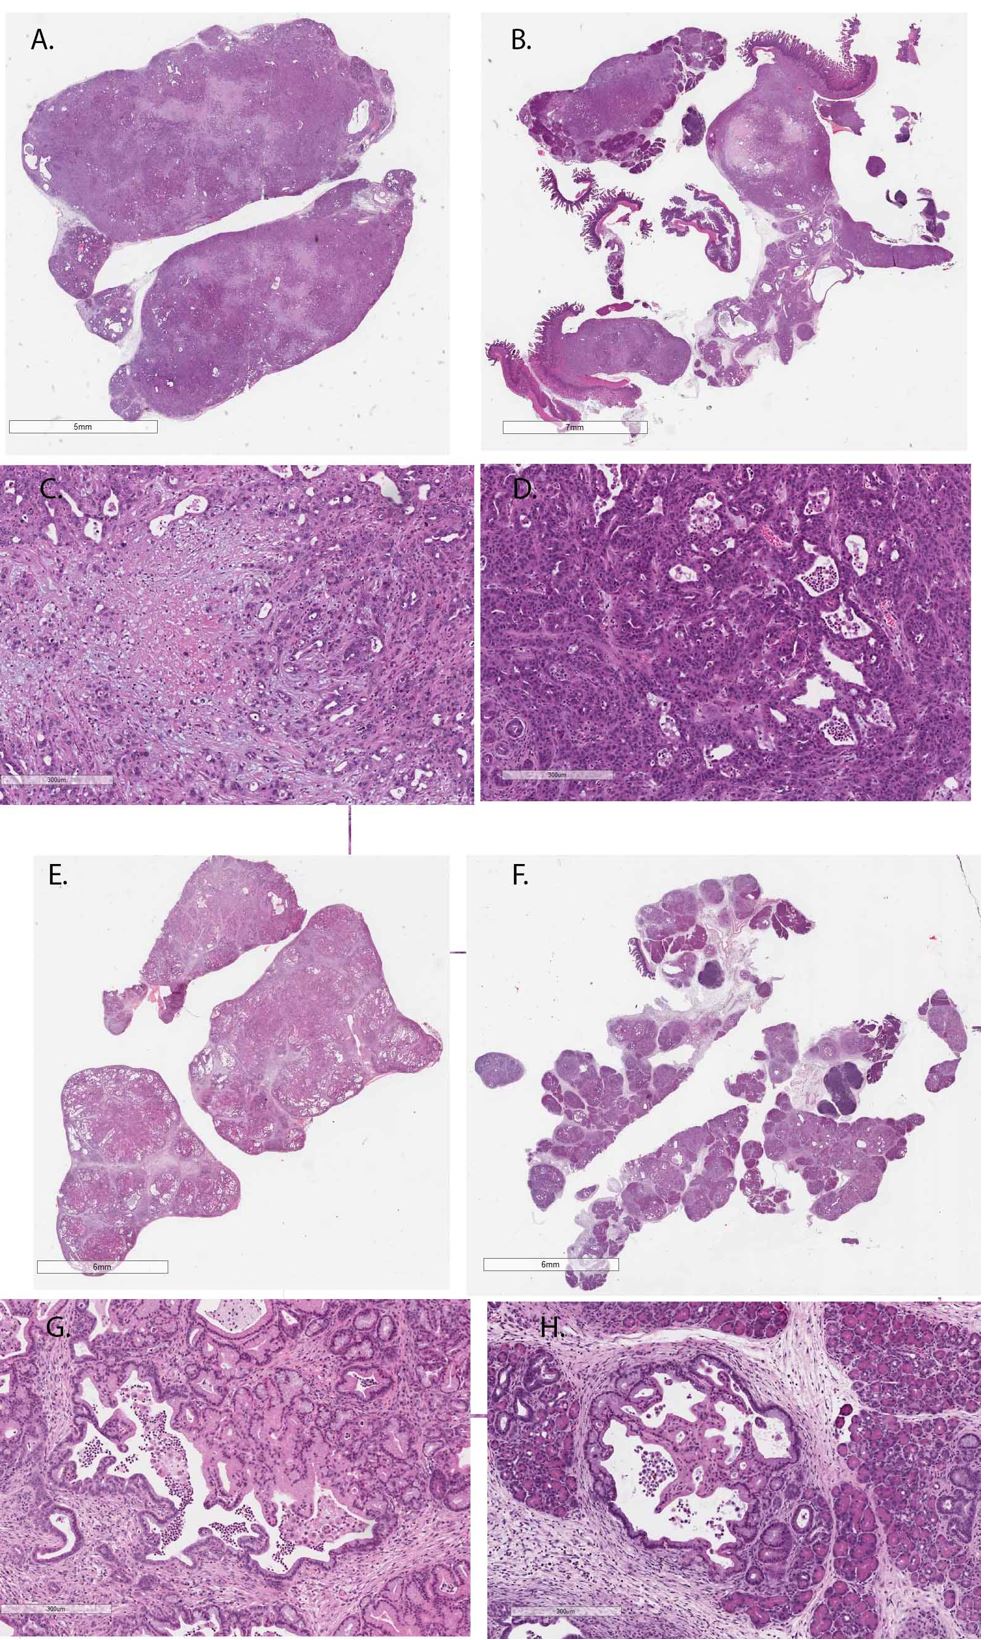
Figure 2: Pathological features of KPC and CKS tumors based on H&E stain.
A-B: Two KPC tumors of different size; magnified area from A and B are displayed in C and D, respectively.
E-F: two CKS tumors of different size; magnified area from E and F are displayed in G and H, respectively.
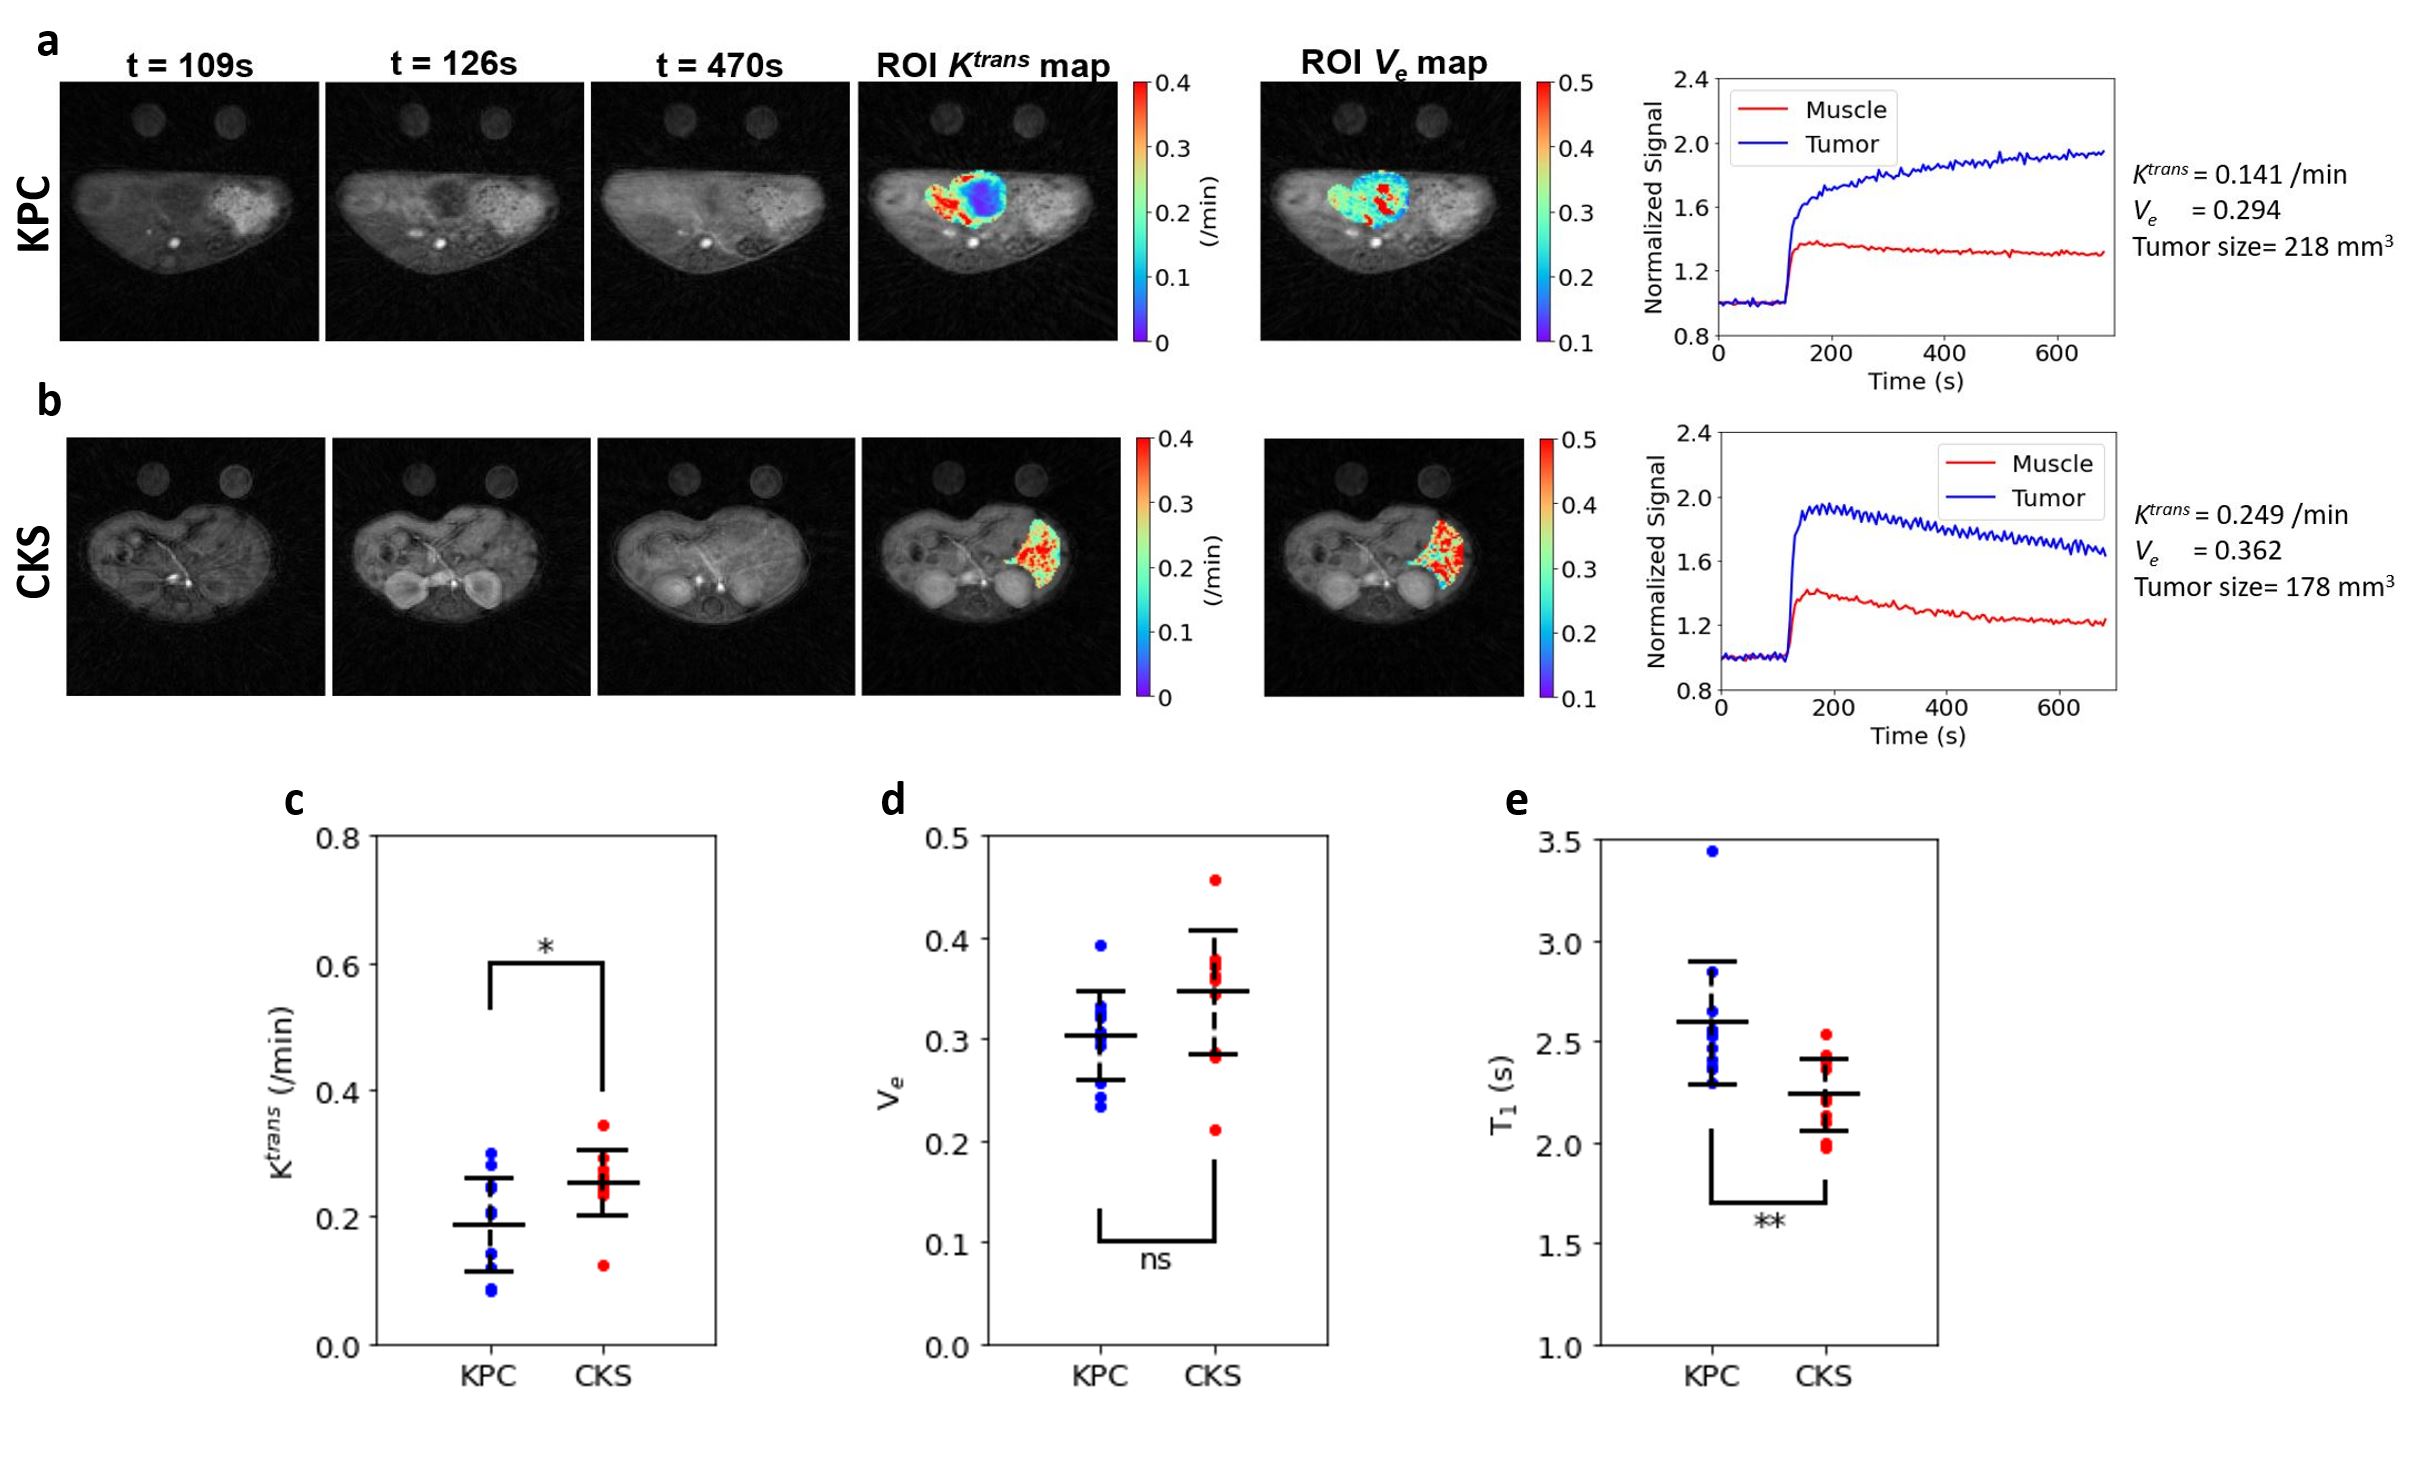
Figure 2: Pathological features of KPC and CKS tumors based on H&E stain.
A-B: Representative DCE series (pre and post contrast agent injection), tumor Ktrans and Ve maps, tissue (tumor and muscle) ROI time course of KPC and CKS tumors. Gd-contrast agent (ProHance) was diluted to 10 mM in PBS and injected (0.2 mL) into tail vein of the mouse via a catheter tubin extended outside the magnet bore.
C, D, E: Tumor Ktrans, Ve and T1 are compared between KPC and CKS (n=11 for each).
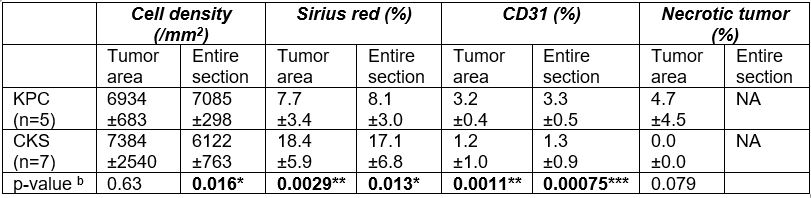
Table-1 Summary of immunohistochemistry analyses of KPC and CKS tumorsa.
a: Data are presented as mean +/- SD.
b: The p-values were obtained from two-tail student t-test with alpha set at 0.05.
*, **, *** Statistically significant comparing CKS vs. KPC groups.
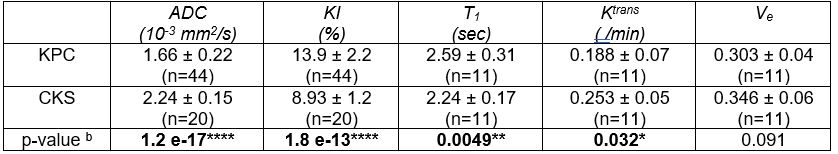
Table-2 Metrics obtained from quantitative DW- and DCE-MRIa.
a: Data are presented as mean +/- SD.
b: The p-values were obtained from two-tail student t-test with alpha set at 0.05.
*, **, *** Statistically significant comparing CKS vs. KPC groups.