3429
Multimodal molecular imaging assessment of tumor microenvironment. Hyaluronan depletion induces tumor reoxygenation and radiosensitization1NCI, Bethesda, MD, United States, 2Josai University, Sakado, Japan, 3Medical and Dental Hospital, Niigata University, Niigata, Japan
Synopsis
PEGPH20 is a PEGylated form of recombinant human hyaluronidase PH20. The purpose of this study is to investigate physiologic changes in pancreatic adenocarcinoma xenograft after PEGPH20 treatment using multi-modal imaging and further determine the utility of PEGPH20 as radiosensitizer. PEGPH20 treatment significantly increased intratumor pO2, blood perfusion and volume, and decreased glycolytic flux assessed by EPR, MRI with USPIO or Gd, and 13C DNP MRI, respectively. PEGPH20 enhanced treatment effect of radiotherapy. The results validated the utility of the imaging methods to monitor the changes in the tumor microenvironment after hyaluronan depletion and to predict the radio-sensitizing effect of PEGPH20.
Purpose
Pancreatic ductal adenocarcinoma (PDAC) is characterized by intense desmoplastic components which can significantly influence the physiology in tumor microenvironment. High expression of hyaluronan (HA), a major component of the extracellular matrix (ECM), is associated with elevated interstitial fluid pressure (IFP). The elevated pressure can cause vascular collapse and decreased perfusion in the tumor microenvironment, which can lead to local hypoxia(1,2). It is also related to poor delivery of anti-cancer drugs compromising the therapeutic effect of chemotherapy(3). Thus, depleting ECM including HA is considered a potentially viable method to improve the treatment efficacy of cancer therapies of solid tumors. The aim of this study is to comprehensively examine the changes in tumor physiology and metabolism after hyaluronan depletion therapy with PEGPH20 using multimodal imaging such as EPR oximetry, Gd and USPIO enhanced MRI, and 13C DNP MRI. Each molecular imaging provides unique biomarkers in tumor microenvironment, which are mutually correlated. The data in the current study not only provides a direct rationale for PEGPH20 use in combination with other chemotherapeutic agents or radiotherapy, but also helps optimizing the regimen and timing of its use.Methods
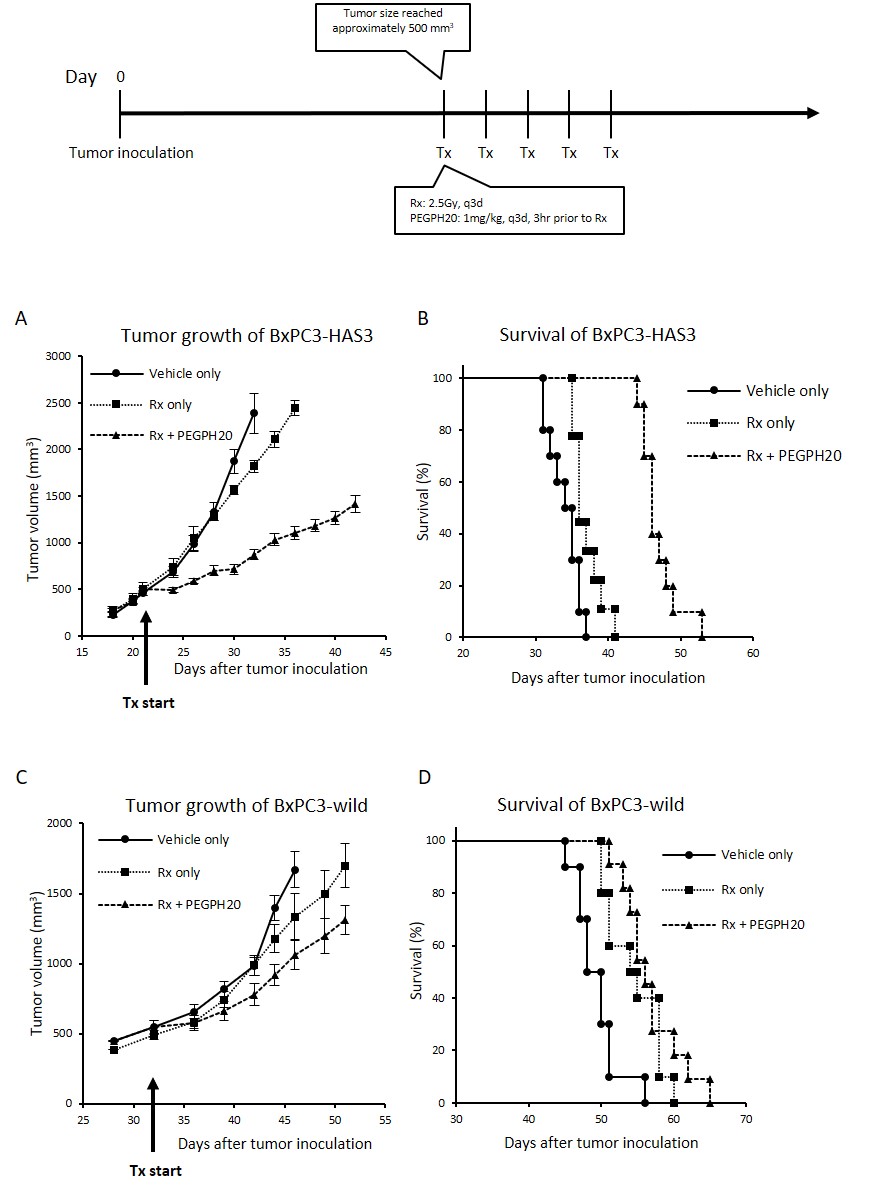
Animal Study: BxPC3 (human pancreatic adenocarcinoma) wild-type cell line and BxPC3 transduced with hyaluronan synthase 3 (HAS3) and PEGPH20 were used. Athymic nude mice were inoculated with 2 x 10⁶ BxPC3-HAS3 tumor cells adjacent to the right tibial periosteum. For imaging experiments, approximately 600 mm3 tumor bearing mice were injected i.v. with 1 mg/kg of PEGPH20 on day 0 and day 3. Tumor bearing mice in the control group were injected with same amount of API buffer. All imaging experiments were performed at the timing of pre-treatment (before the first injection on day 0) and post-treatment (3 h after the 2nd PEGPH20 injection on day 3). Approximately 600 mm3 tumors wwrw irradiated at 2.5Gy. PEGPH20 was administrated 3 hours prior to radiotherapy. EPRI: Sub-microsecond recovery resonators tuned to 300 MHz were used. Oxo63 (1.125 mmol/kg) was injected i.v. to a mouse. FID signals were collected following the radiofrequency excitation pulses (60 ns) with a nested looping of the x, y, and z gradients, and each time point in the FID underwent phase modulation, enabling 3D spatial encoding. The repetition time was 8.0 µs. The number of averages was 4,000. After EPRI measurement, corresponding anatomic T2-weighted MR images were collected with a 1T scanner (Bruker). Blood volume imaging: MRI scanning was conducted on a 3T scanner controlled with ParaVision 6.0 (Bruker). For blood volume (BV) calculation, spoiled gradient echo sequence images were collected before and 5 minutes after injection of ultra-small superparamagnetic iron oxide (USPIO) contrast (1.2 μL/g of body weight). The imaging parameters included the following: TE = 3.5 ms; and TR = 200 ms; FOV = 28 x 28 mm; matrix = 192 x 192. Hyperpolarized 13C MRI: [1-13C1] pyruvic acid (30 μL) containing 15 mmol/L Oxo63 and 2.5 mmol/L of the gadolinium, ProHance (BraccoDiagnostics) was polarized in HyperSense DNP polarizer (Oxford Instruments). Hyperpolarized solution was rapidly injected i.v. to a mouse. MRI scanning was performed on a 3 T scanner (MR SOLUTIONS) using a 17 mm home-built 13C solenoid coil placed inside of a saddle coil tuned to 1H frequency. 13C spectra was acquired every 1 s for 240 s from the whole leg with a tumor. TR, spectral width, flip angle, and number of average were 1000 ms, 3300 Hz, 10°, and 1, respectively.Results
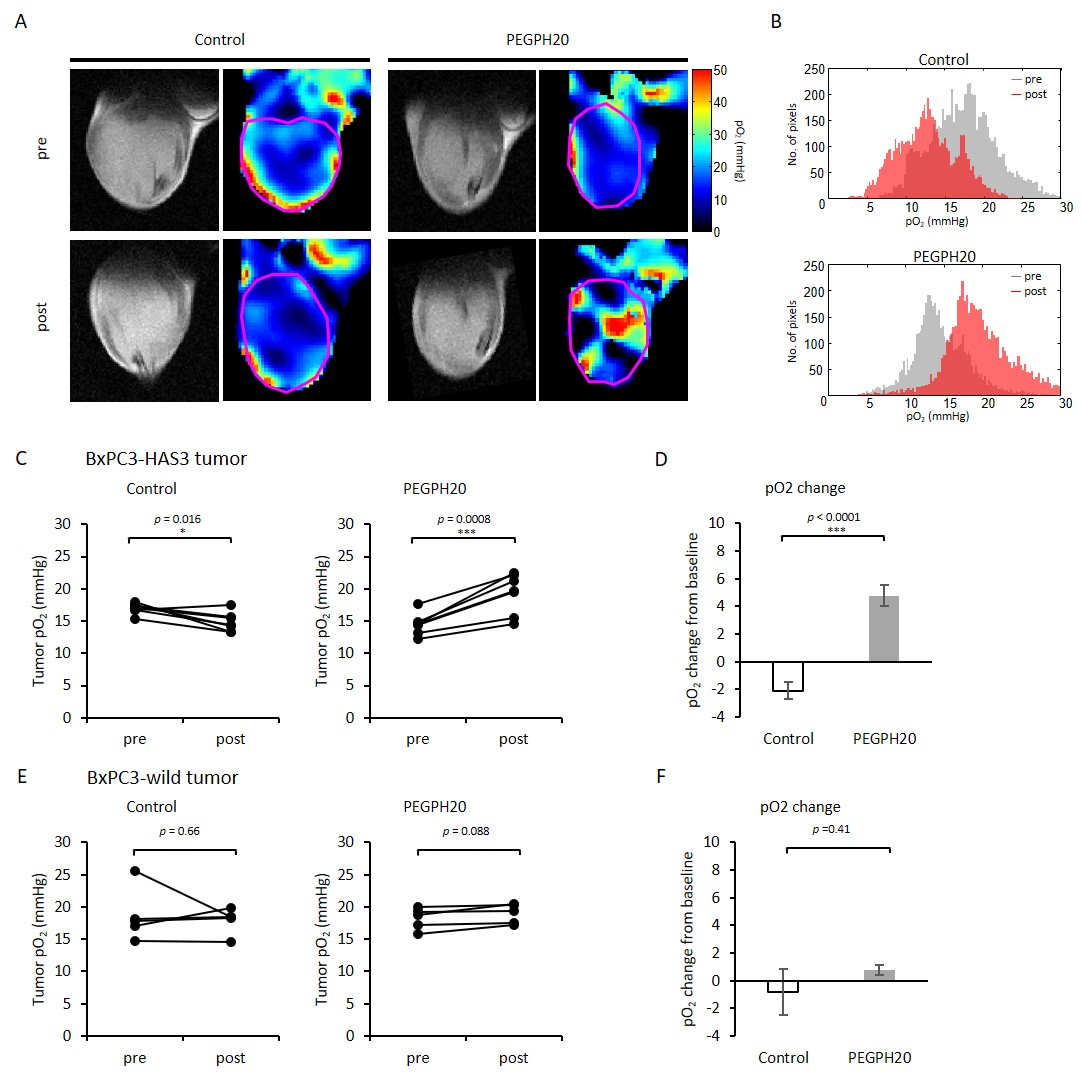
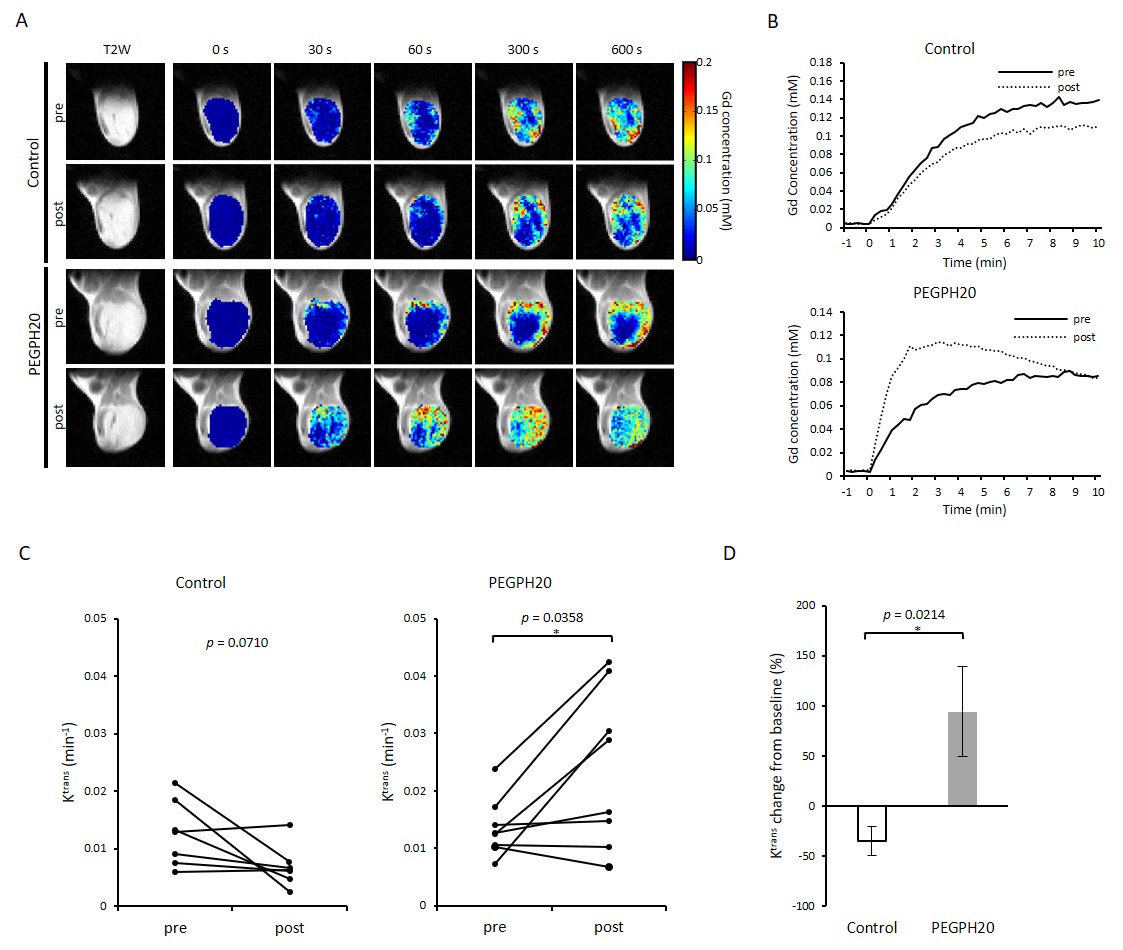
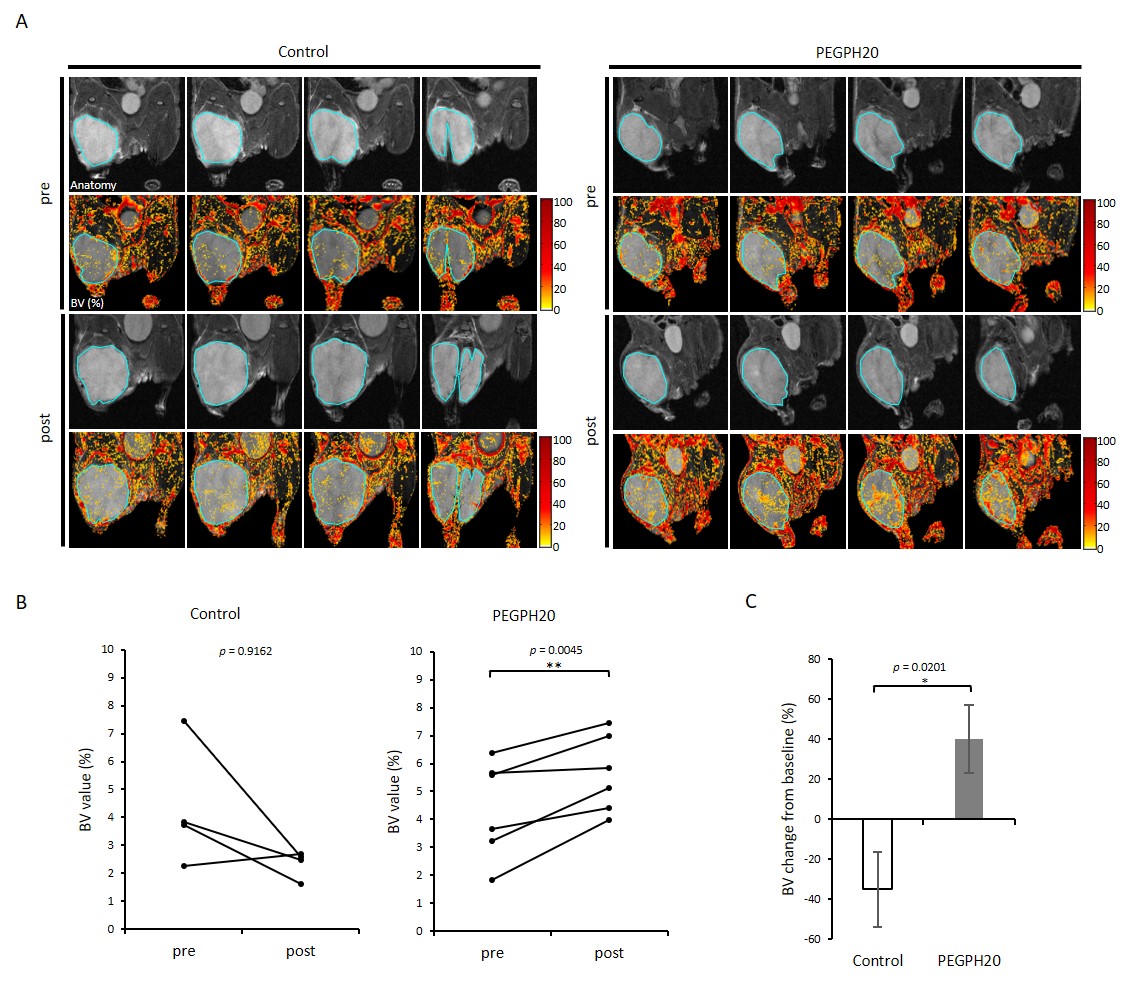
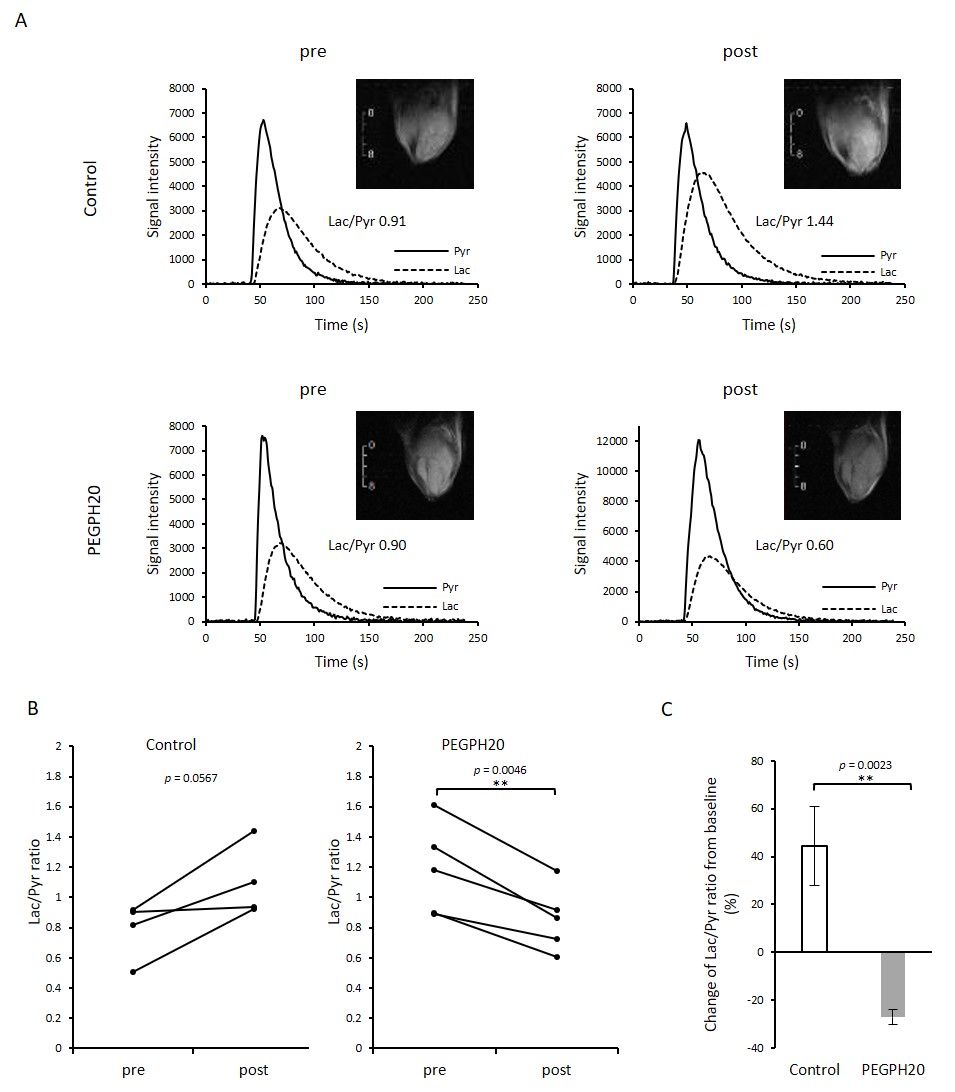
PEGPH20 treatment significantly increased pO2 not in BxPC3-wild group but in BxPC3-HAS3 group (p = 0.088 vs 0.0008 (Fig. 1)). The increase in pO2 was correlated with significantly increased intratumor blood perfusion (p = 0.0358 (Fig. 2)) and blood volume (p = 0.0045 (Fig. 3)). Hyperpolarized 13C-MRI with [1-13C1] pyruvate showed significantly decreased lactate–to-pyruvate ratio in PEGPH20 treated tumors (p = 0.0046) (Fig. 4). PEGPH20 treatment in combination with radiotherapy synergistically delayed tumor progression and prolonged the survival in BxPC3-HAS3 tumors (Fig. 5).Conslusion
This study examined the effect of PEGPH20 on tumor microenvironment in xenograft model by using non-invasive multimodal imaging techniques. The results showed that depleting stromal HA by PEGPH20 improved blood perfusion, leading to improved oxygenation and the decreased pyruvate to lactate flux in the tumor. PEGPH20 enhanced treatment effect of radiation therapy.Acknowledgements
No acknowledgement found.References
1. Jacobetz MA, Chan DS, Neesse A, Bapiro TE, Cook N, Frese KK, et al. Hyaluronan impairs vascular function and drug delivery in a mouse model of pancreatic cancer. Gut 2013;62:112-20
2. Li X, Shepard HM, Cowell JA, Zhao C, Osgood RJ, Rosengren S, et al. Parallel Accumulation of Tumor Hyaluronan, Collagen, and Other Drivers of Tumor Progression. Clin Cancer Res 2018;24:4798-807
3. Liu H, Ma Q, Xu Q, Lei J, Li X, Wang Z, et al. Therapeutic potential of perineural invasion, hypoxia and desmoplasia in pancreatic cancer. Curr Pharm Des 2012;18:2395-403
Figures