3428
Detection of Metabolic Biomarkers of Response to BRAF and MEK Inhibitor Therapy of Melanoma1Department of Radiology, Perelman School of Medicine, University of Pennsylvania, Philadelphia, PA, United States, 2Department of Biostatistics and Epidemiology, Perelman School of Medicine, University of Pennsylvania, Philadelphia, PA, United States, 3Department of Radiation Oncology, Thomas Jefferson University, Philadelphia, PA, United States
Synopsis
In vivo 1H and 31P MRS were used to monitor the effects of BRAF and MEK inhibitors therapy in two metabolically different melanoma xenograft models. Our approach is to combine BRAF inhibitor with MEK inhibitor in melanoma xenograft models. Combination of BRAF and MEK inhibitors has been shown to be more effective than the use of either drug alone. Differences in relative levels of glycolysis between two melanoma xenograft models may produce differential therapeutic responses to BRAF and MEK inhibitors . In melanoma, metabolic changes in response to targeted kinase inhibitor therapy occur rapidly and are related to subsequent tumor response.
INTRODUCTION:
Kinase inhibitors are at the forefront of advances in melanoma therapy. Studies have suggested that concurrent inhibition of the BRAF kinases and MEK of the MAPK pathway could decrease MAPK-driven acquired resistance, resulting in a longer duration of responses observed from paradoxical MAPK pathway activation with BRAF inhibitor monotherapy.1 Both BRAF and MEK genes are closely related, so drugs that are targeted to BRAF can also help treat melanoma with MEK mutations.1 Our approach is to combine a BRAF inhibitor (dabrafenib) with a MEK inhibitor (trametinib) in two metabolically different melanoma xenograft models, DB-1 and WM983B. This combination has been shown to be more effective than the use of either drug alone.1 Our fundamental hypothesis is that 1H and 31P MRS will lead to much earlier reliable detection of therapeutic response, recurrence, or resistance, independent of changes in tumor volume. Differences in relative levels of glycolysis may produce differential therapeutic responses to BRAF and MEK inhibitors in melanomas.2METHODS:
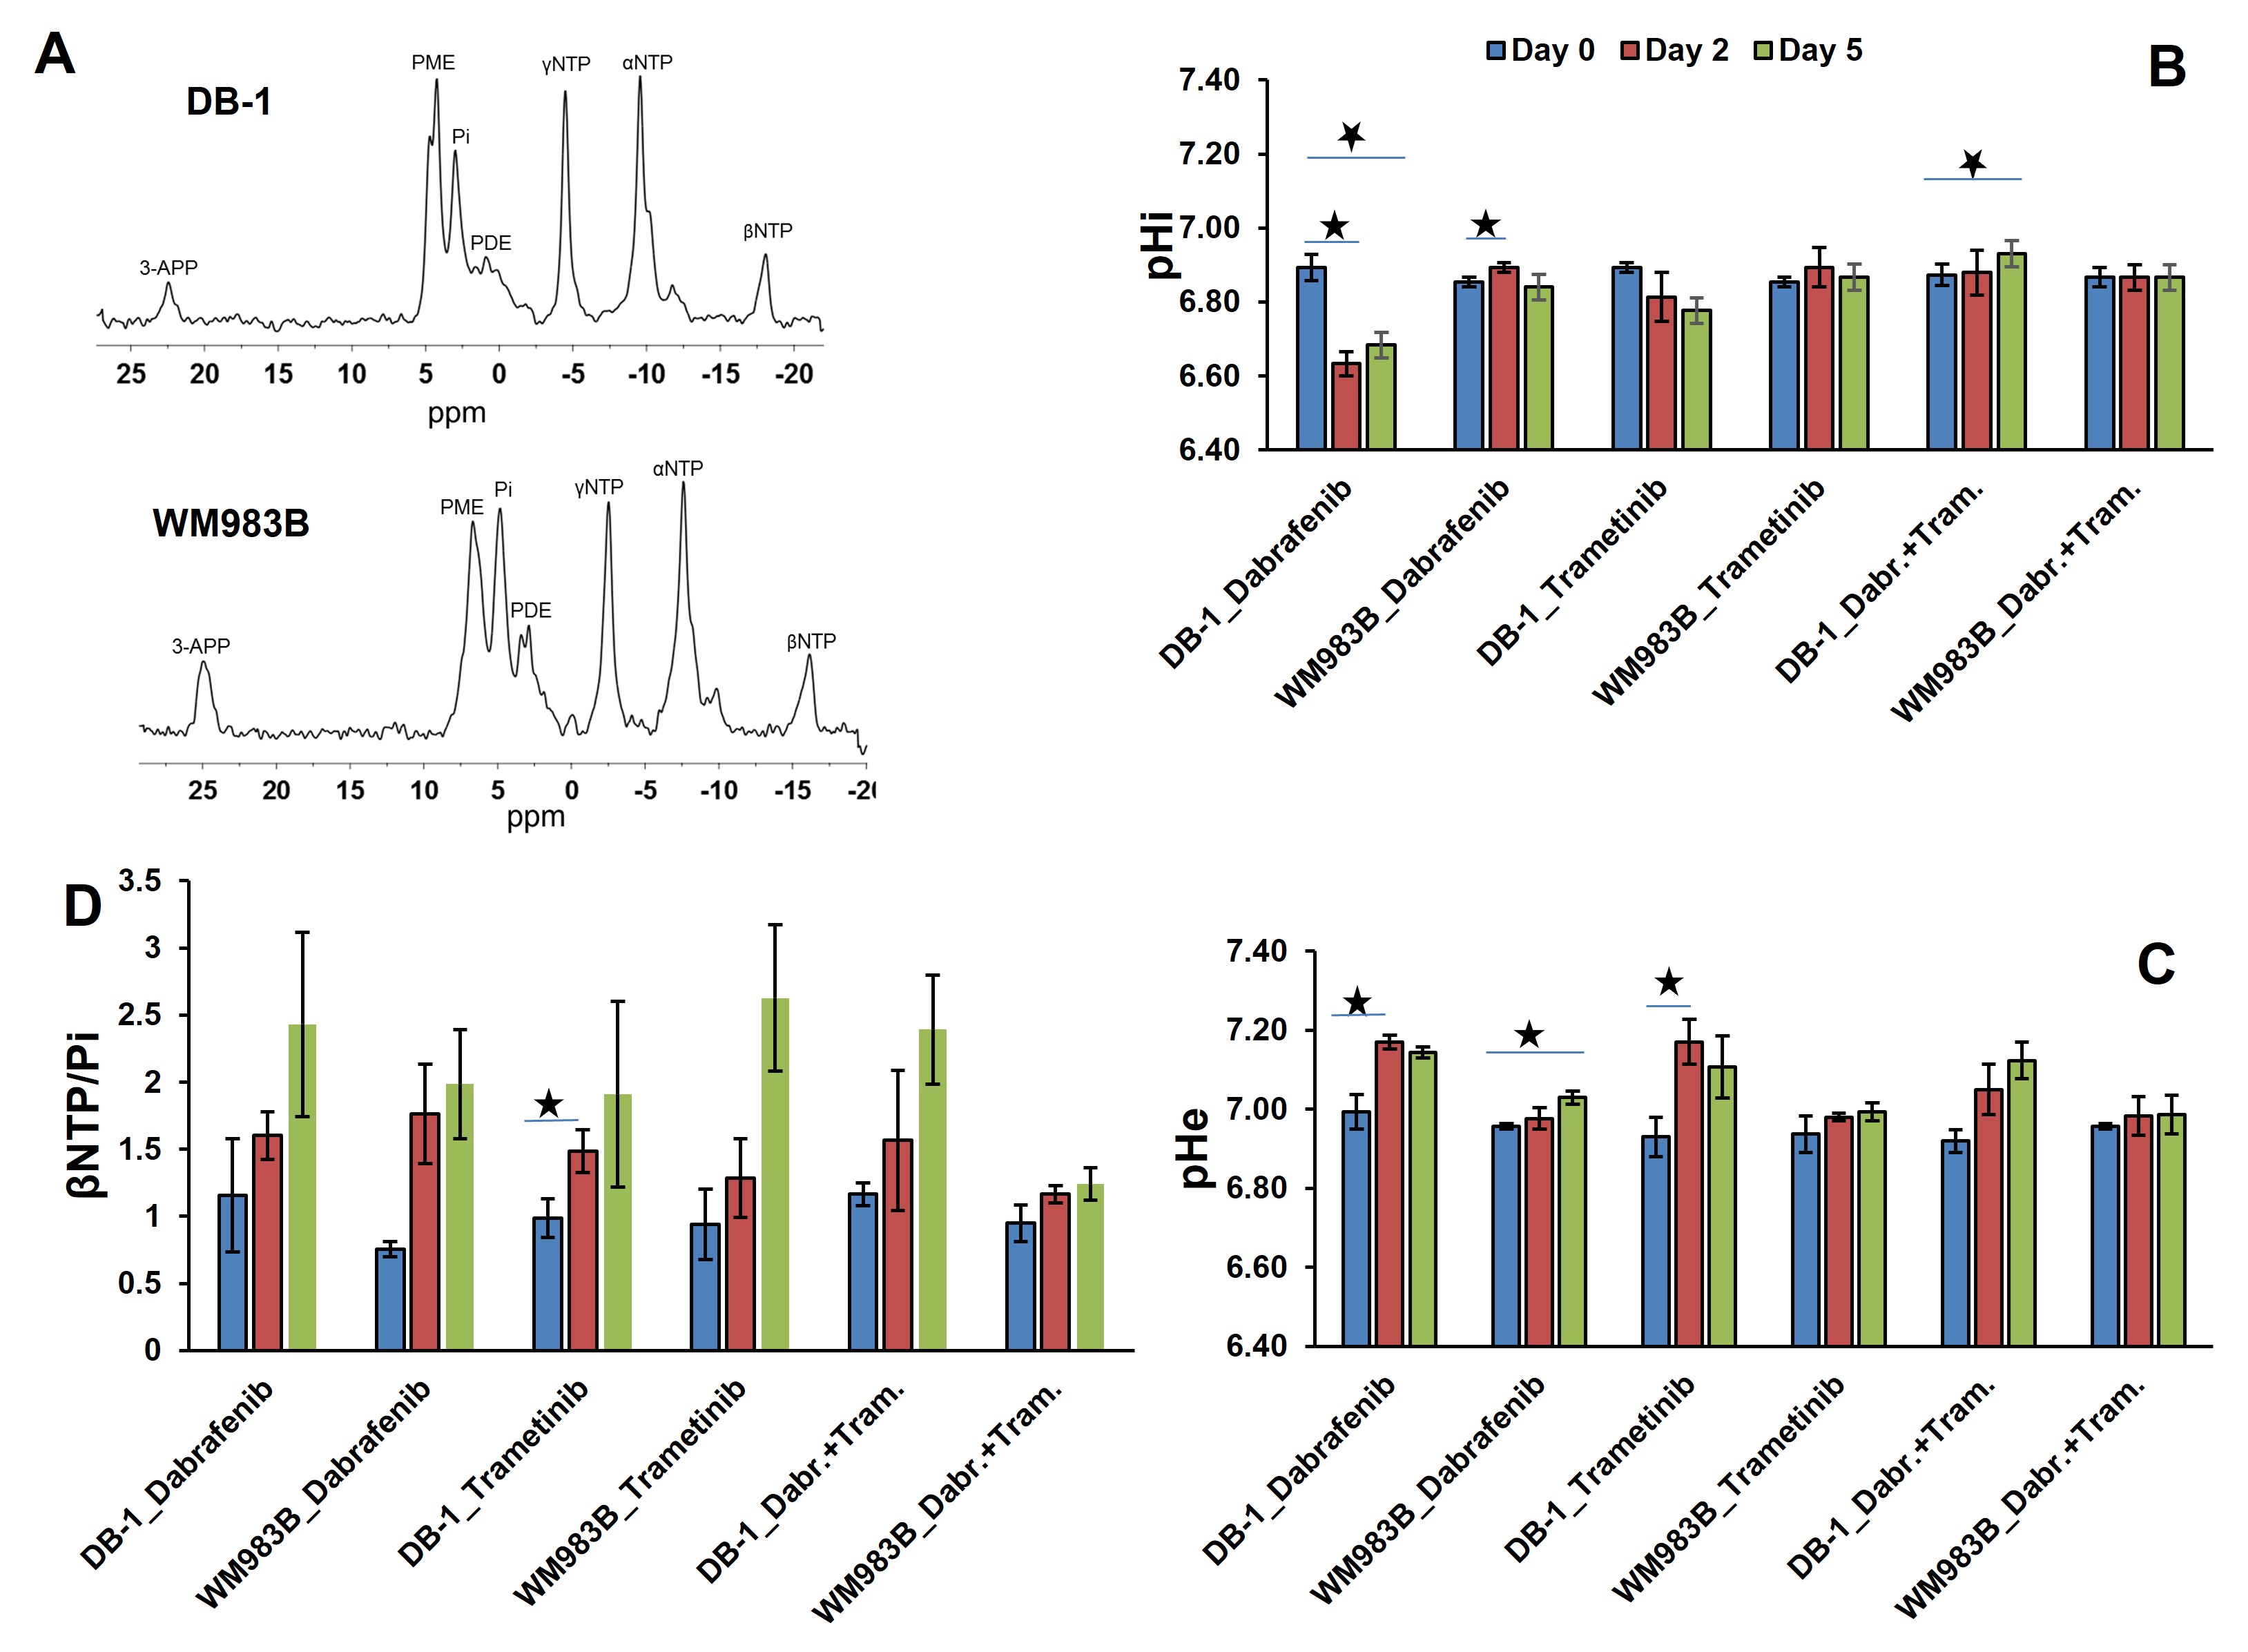
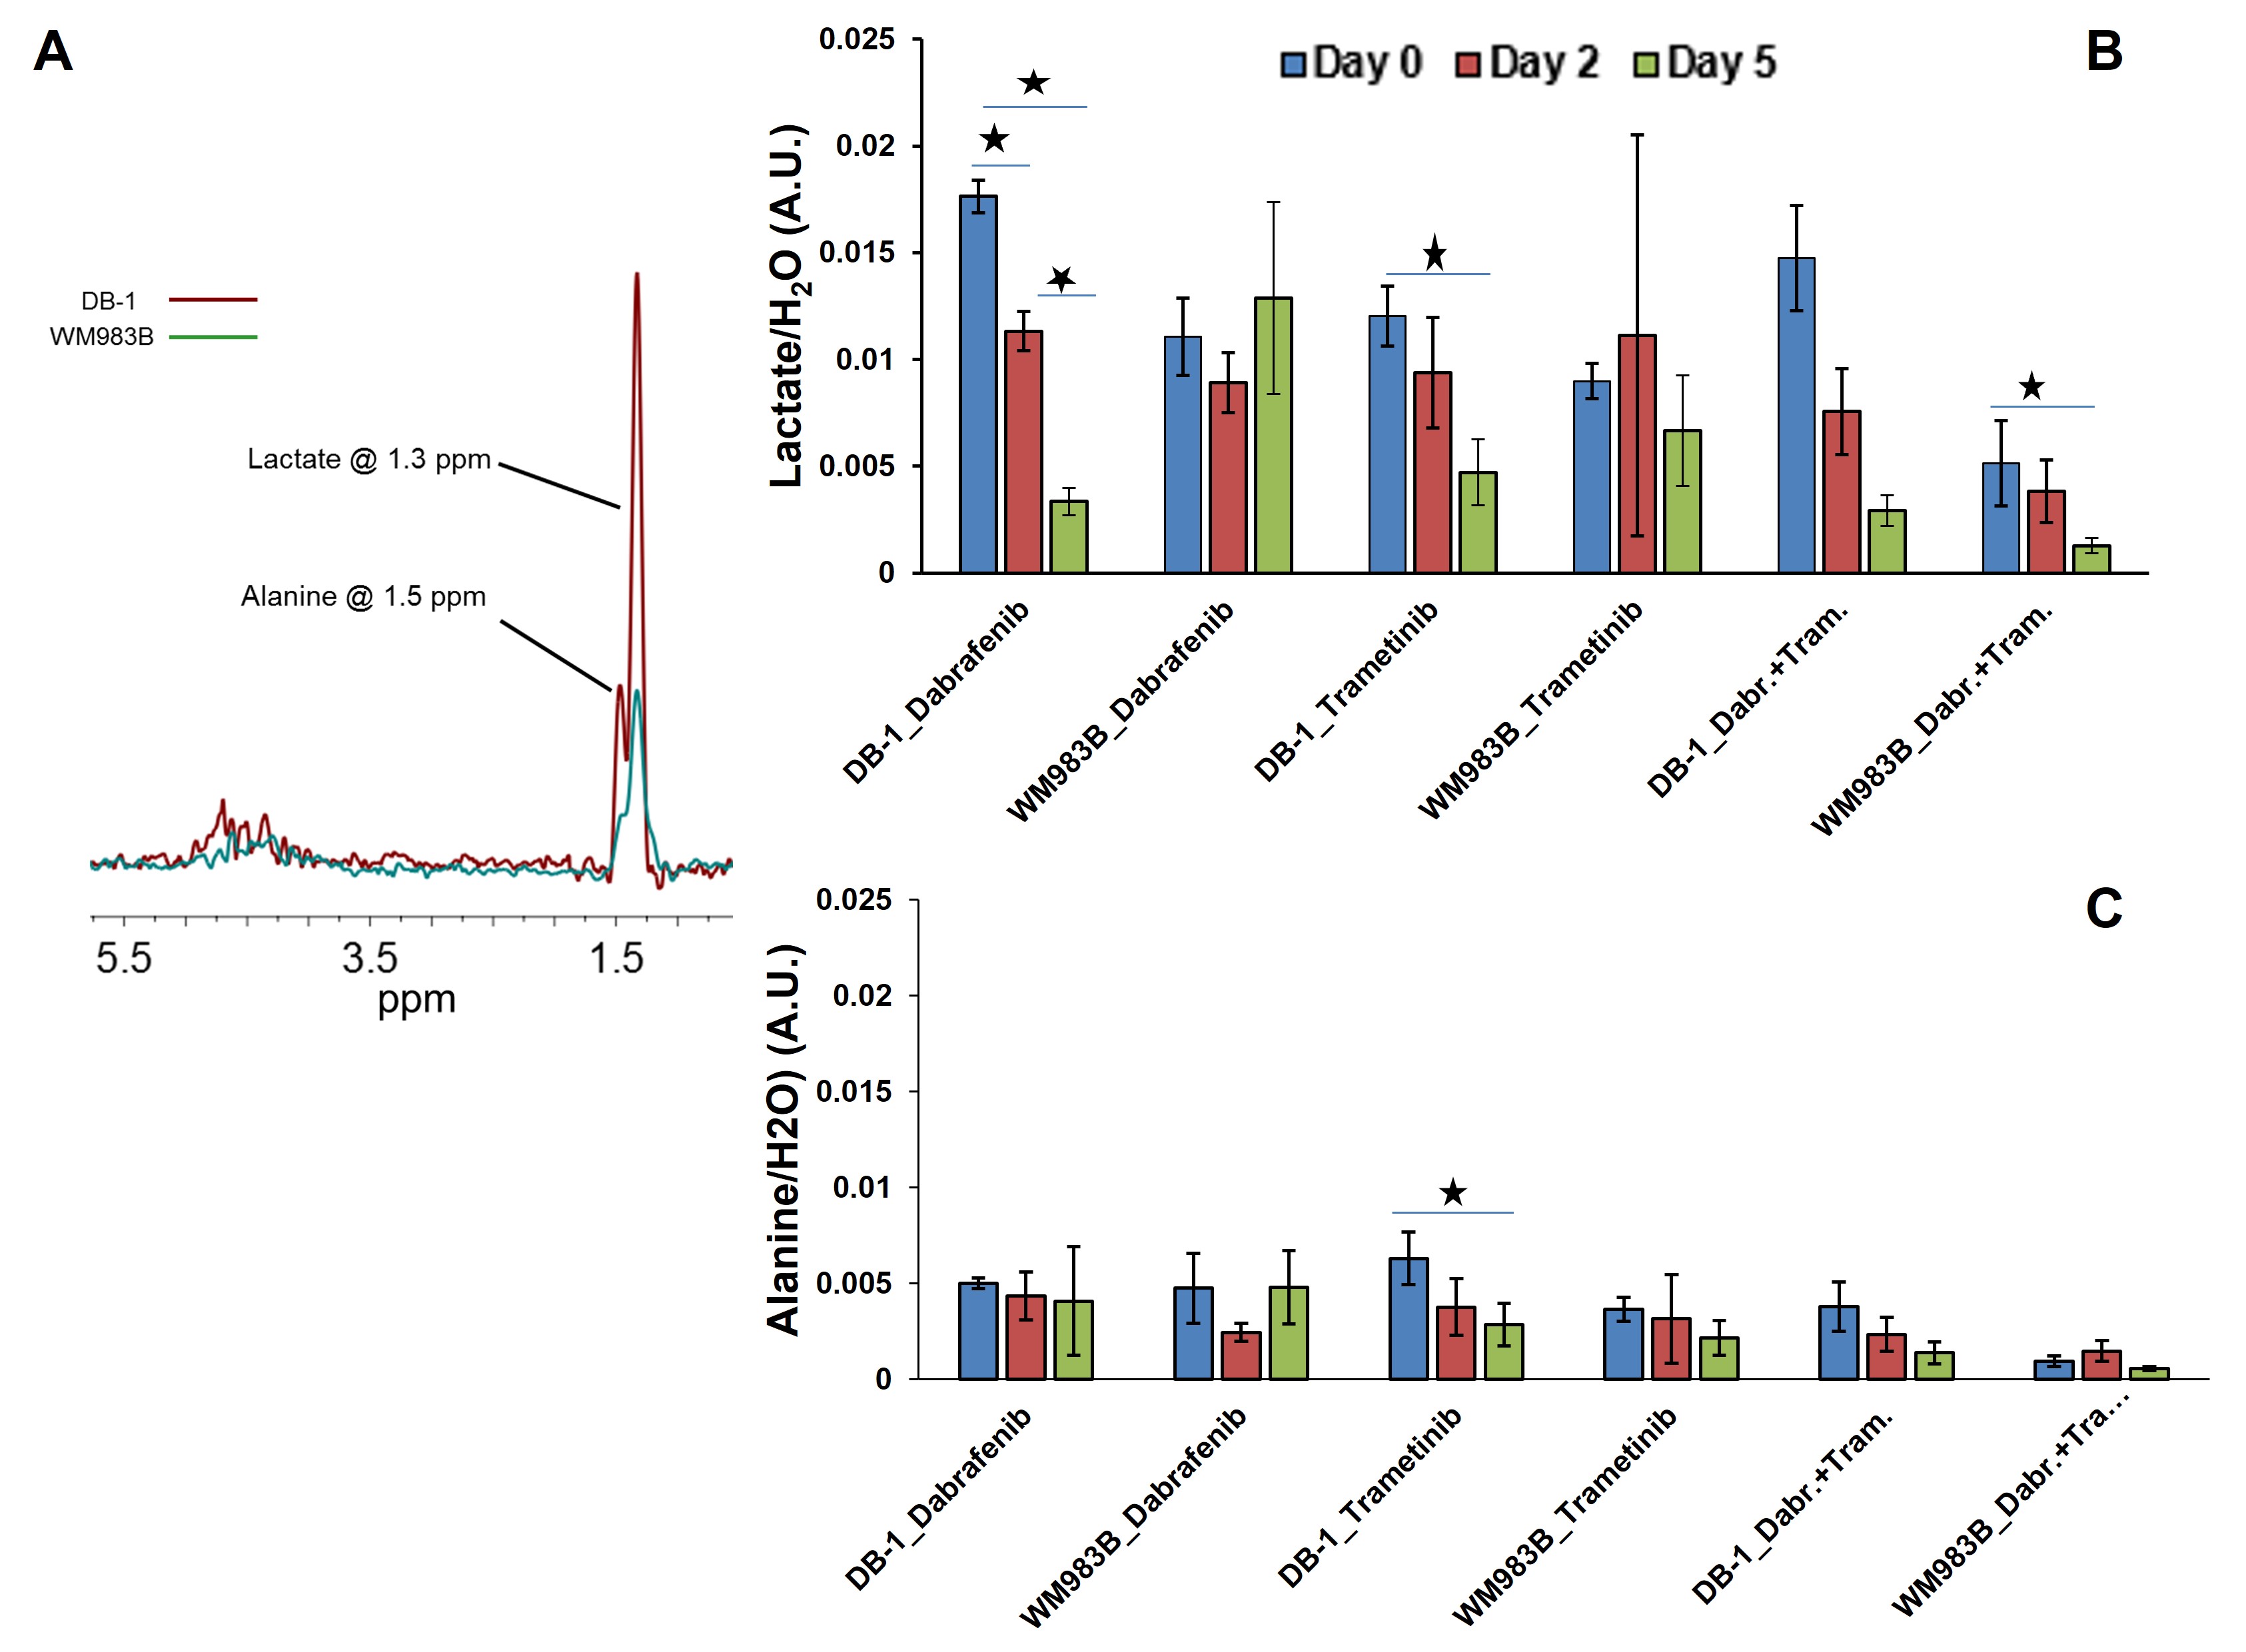
DB-1 and WM983B human melanoma cells were grown with DMEM supplemented to 25 mM glucose, 2 mM glutamine, 10 mM HEPES, 100 Units/mL penicillin, 100 µg/mL streptomycin, and 10% FBS. 10 x 106 cells/ml and inoculated subcutaneously in each mouse with 0.1mL suspension. 31P and 1H MRS experiments were performed on DB-1 (n=3) and WM983B (n=3) melanoma xenografts after treatment with dabrafenib and trametinib alone and in combination. MRS experiments were performed on a 9.4 T Bruker magnet using a homemade 1H/31P dual tuned coil. To prepare tumor-bearing mice for MRS experiments, 1% isoflurane in 1 L/min oxygen was used to anesthetize the mice. To monitor respiration and core temperature, a respiration pillow and a rectal thermistor were used, respectively. Mouse core temperature was maintained at 37 ± 1°C by blowing warmed air into the bore of the magnet with heating controlled by a thermal regulator system. (3-Aminopropyl)phosphonate (3-APP) (300 mg/mL solution in water) was injected exogenously into the peritoneum of the mouse before putting the animal in the magnet to measure the extracellular pH (pHe).3 For 1H MRS, a slice-selective, double-frequency, Hadamard-selective, multiple quantum coherence transfer pulse sequence was used to detect lactate and to filter out overlapping lipid signals.4 Intracellular pH (pHi), pHe, bioenergetics (βNTP/Pi), lactate and alanine concentration were measured using 31P and 1H MRS, respectively, on Day 0 (pre-), Day 2 and Day 5 (post-) treated with dabrafenib (30 mg/kg; oral), trametinib (10 mg/kg; oral) and dabrafenib plus trametinib (similar dose) using methods described elsewhere.3 Tumor volumes were measured using calipers. An independent paired t-test was performed for statistical analysis using SPSS 20. A p-value ≤ 0.05 was considered significant.RESULTS:
Dabrafenib treatment produced a sustained significant change in pHi at Day 2 (p=0.031) and Day 5 (p=0.024) compared to Day 0 (baseline) in DB-1 melanoma xenografts (Figure 1). We observed a significant change in pHi at Day 2 (p<0.001) only compared to baseline in WM983B xenografts (Figure 1). However, pHe produced significant change at Day 2 (p=0.032) and Day 5 (p=0.017) compared to baseline in DB-1 and WM983B, respectively (Figure 1). We did not observe any significant change in bioenergetics (βNTP/Pi) after treatment with dabrafenib in either of the melanoma models (Figure 1). Furthermore, we observed a significant change in the level of total lactate at Day 2 (p=0.027), Day 5 (p=0.012) compared to baseline, and between Day 2 and Day 5 (p=0.018) (Figure 2).Trametinib treatment produced a sustained significant change in pHe at Day 2 (p=0.018) compared to baseline in DB-1 melanoma xenografts only (Figure 1). We observed a significant change in bioenergetics (βNTP/Pi) after treatment with trametinib in DB-1 melanoma model at Day 2 (p=0.017) compared to baseline (Figure 1). We observed a significant change in the level of total lactate (p=0.003) and alanine (p=0.048) at Day 5 compared to baseline in DB-1 (Figure 2).
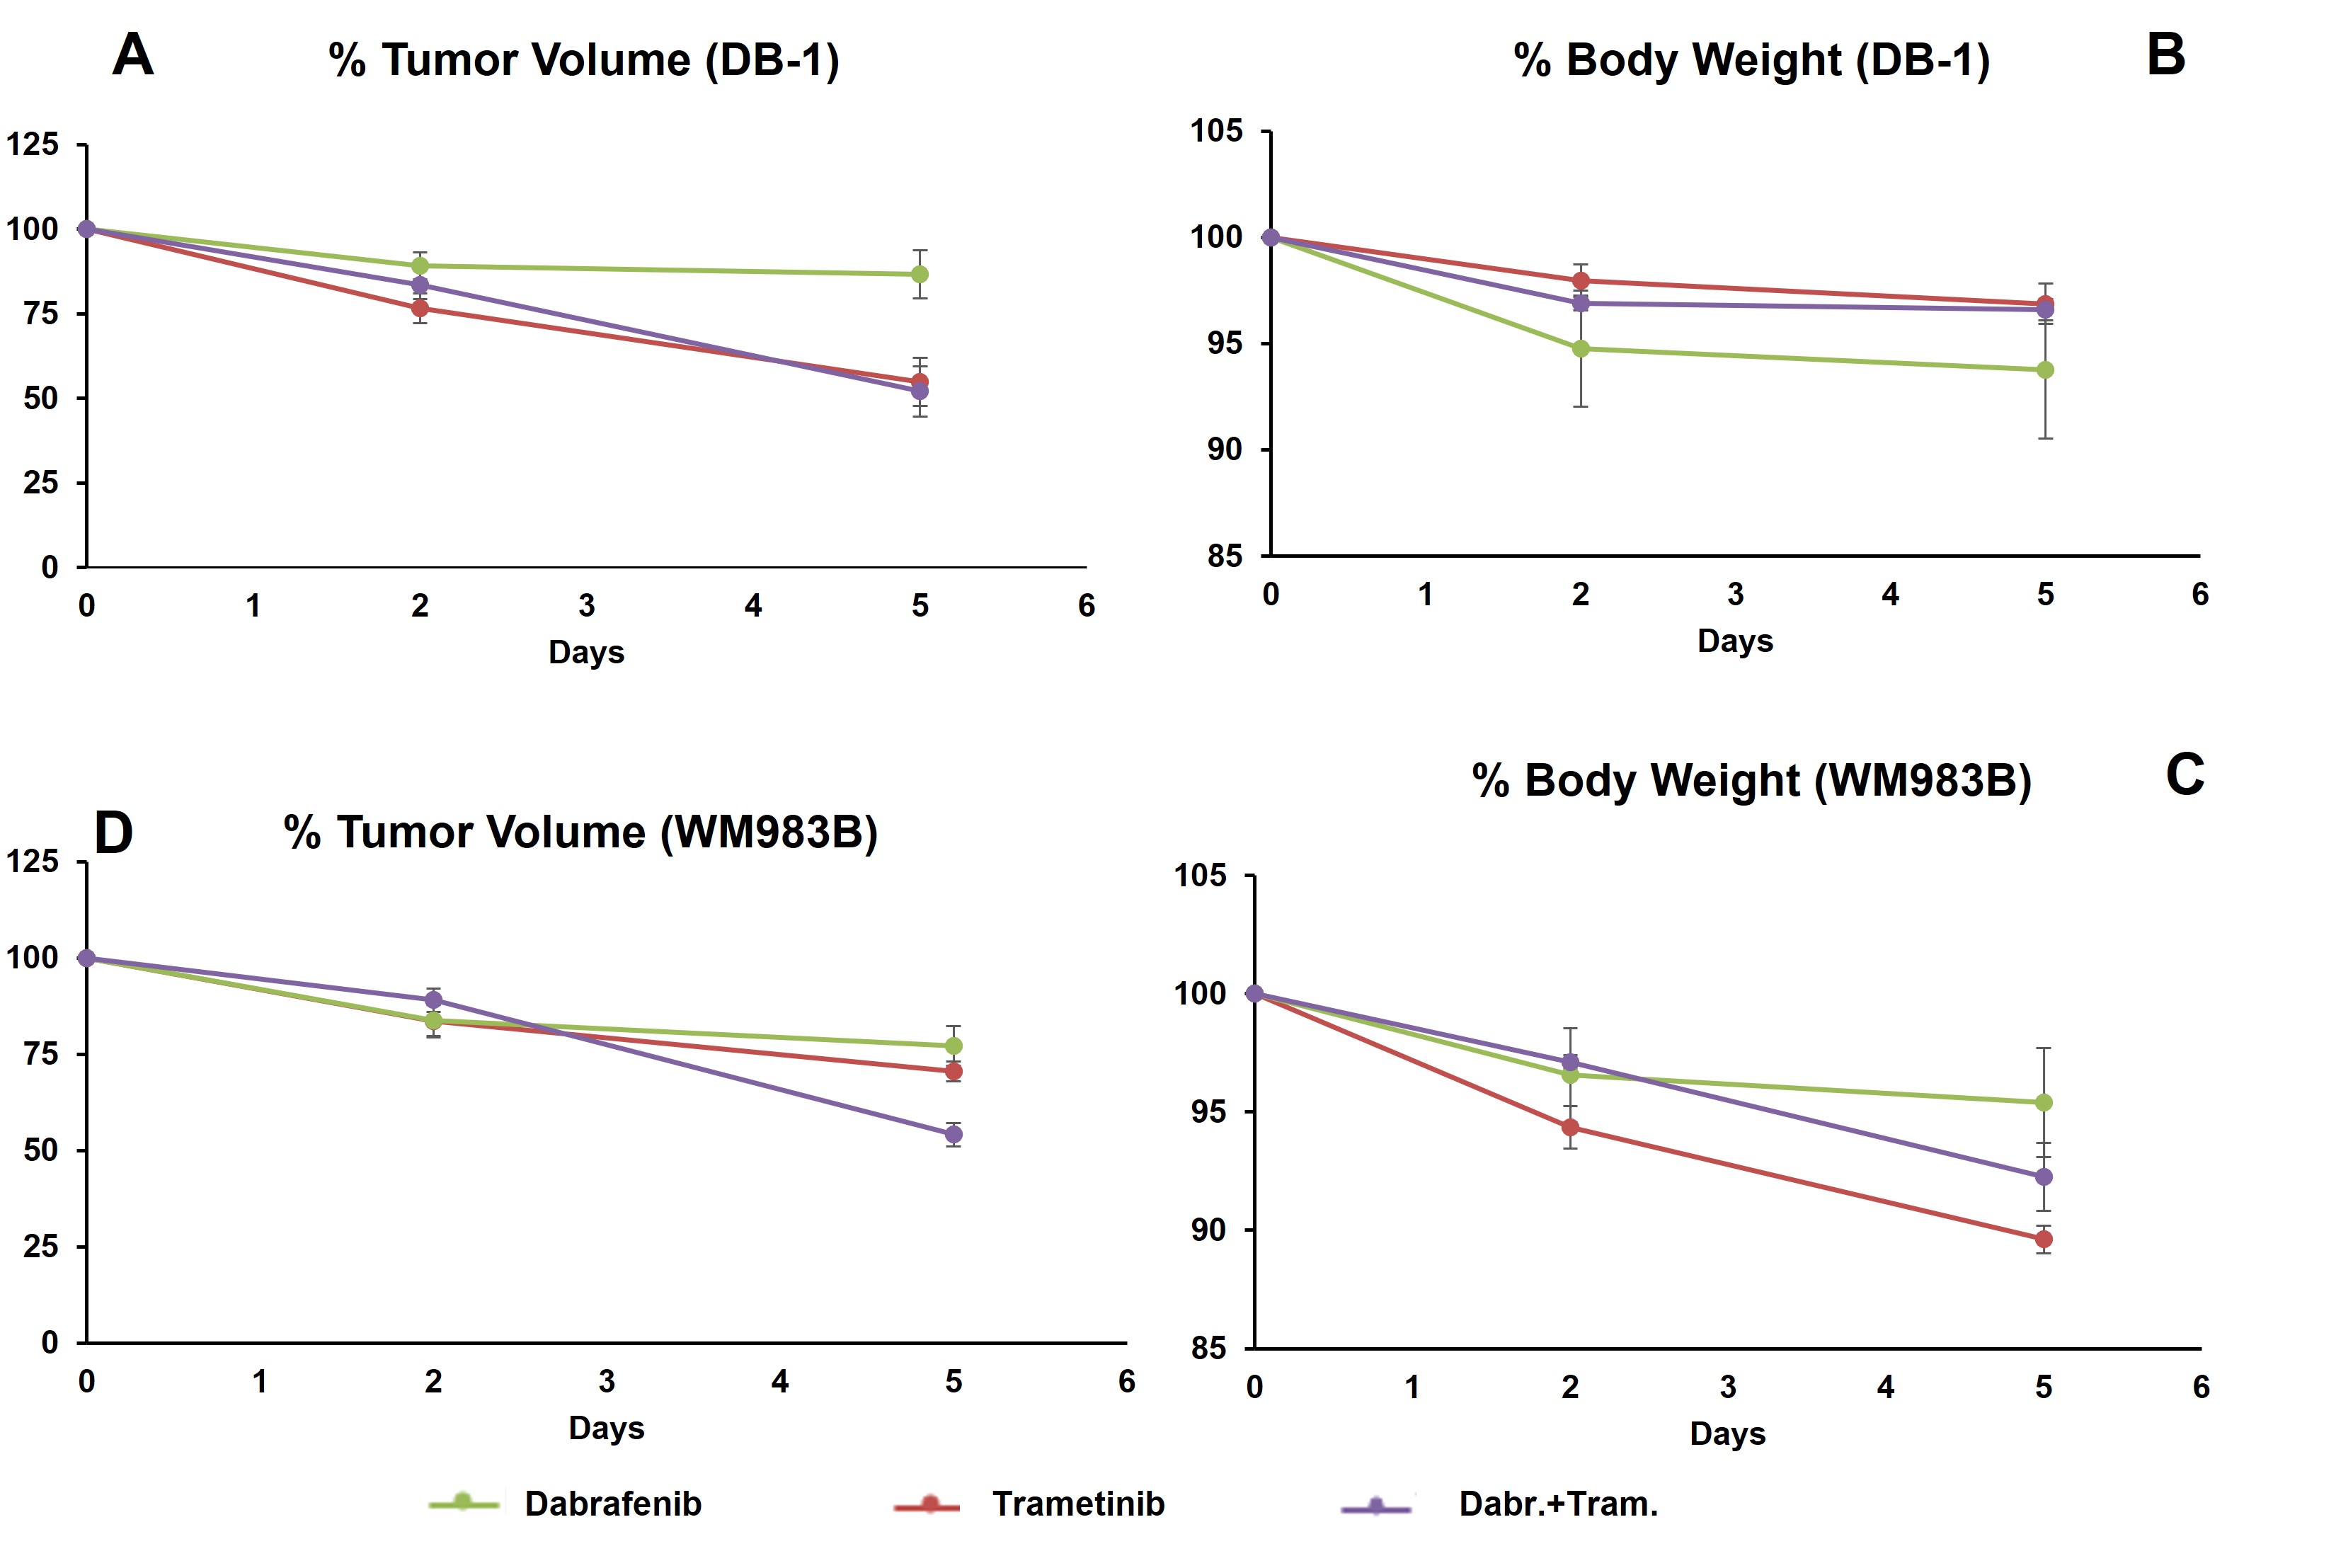
Dabrafenib plus Trametinib treatment produced a significant change in pHi at Day 2 compared to Day 5 (p=0.006) in DB-1 (Figure 1); however, we observed a significant change in the level of total lactate (p=0.018) at Day 5 compared to baseline in DB-1 (Figure 2). We observed a decrease in tumor volume after treatment with dabrafenib, trametinib and dabrafenib plus trametinib in both melanoma models (Figure 3).
DISCUSSION:
Because DB-1 melanoma models are inherently more glycolytic than WM983B, as evident from lactate levels (Figure 2 A), we predict that BRAF and MEK inhibitors should induce more response in DB-1 compared to WM983B. This is indeed what we observed. At least conceptually, this model has the potential for translation to clinical settings. Notably, we now have instruments and methodologies to monitor tumor metabolism and energetics non-invasively. Bioenergetics measurements could form the basis of predictions about the response of the tumor to an energetically demanding treatment. It is reasonable to think that information about metabolism could also be highly useful in monitoring and predicting response to other modalities, such as BRAF and MEK inhibitors and immunotherapy. Future studies are needed to illuminate the nature of the link between the observed changes with a bigger sample size.CONCLUSION:
Differences in the predominance of glycolysis may explain differential therapeutic responses between DB-1 and WM983B melanomas.Acknowledgements
NIH 1R01CA250102-01, 1R01CA228457-01A1References
1. Eroglu Z & Ribas A. Combination therapy with BRAF and MEK inhibitors for melanoma: latest evidence and place in therapy. Therapeutic advances in medical oncology. 2016;8(1):48-56.
2. Nath K, Roman J, Nelson DS, et al. Effect of Differences in Metabolic Activity of Melanoma Models on Response to Lonidamine plus Doxorubicin. Scientific reports. 2018;8(1):14654.
3. Nath K, Nelson DS, Ho AM, et al. 31P and 1H MRS of DB-1 melanoma xenografts: lonidamine selectively decreases tumor intracellular pH and energy status and sensitizes tumors to melphalan. NMR Biomed. 2013;26(1):98-105.
4. Pickup S, Lee SC, Mancuso A, et al. Lactate imaging with Hadamard-encoded slice-selective multiple quantum coherence chemical-shift imaging. Magnetic Resonance in Medicine. 2008;60(2):299-305.
Figures