3427
Deuterium (2H) MR Spectroscopy Distinguishes Tumor (Glioblastoma) from Radiation Necrosis in Mouse Brain1Department of Radiology, Washington University, St. Louis, MO, United States, 2Department of Neurosurgery, Washington University, St. Louis, MO, United States, 3Department of Radiation Oncology, Washington University, St. Louis, MO, United States, 4Department of Chemistry, Washington University, St. Louis, MO, United States, 5Department of Internal Medicine, Washington University, St. Louis, MO, United States, 6Alvin J. Siteman Cancer Center, Washington University School of Medicine, St. Louis, MO, United States
Synopsis
Employing mouse models of radiation necrosis (one that displays the histologic hallmarks of the clinical condition) and glioblastoma (GL261), deuterium (2H) MR spectroscopy, in concert with infusion of 2H-labelled glucose, was employed to ascertain whether the 2H MRS signatures could differentiate the two lesions, an unmet clinical need. The 2H MR metabolic profiles of the two lesions were markedly different. In the tumor, the Warburg effect (aerobic glycolysis, fermentation) converted glucose nearly exclusively to lactate. In radiation necrosis, oxidative phosphorylation (respiration) dominated, with glucose converting to TCA cycle intermediates glutamate and glutamine. Thus, 2H MR distinguishes glioblastoma vs. radiation necrosis.
Introduction
The majority of neuro-oncology patients, including those with primary or secondary malignant brain tumors, are treated with radiation as an early therapeutic modality. Post-radiation changes or recurrent tumors may result in biologic changes in tissue structure manifest on follow-up neuro-MRI scans that are indeterminate and unable to consistently distinguish radiation necrosis (RN) from recurrent tumor. The Warburg effect 1,2, a hallmark of malignant cancer cells distinct from normally respiring (oxidative phosphorylation) cells, describes an altered metabolic milieu in which glucose is avidly taken up and principally metabolized to lactate (fermentation) in the presence of O2, a process known as aerobic glycolysis. By monitoring the metabolic fate of 2H-labelled glucose, specifically [6,6-2H2] glucose (Glc), 2H MRS can distinguish normally respiring tissue from tumor undergoing aerobic glycolysis 3. Herein, employing mouse models, we determine whether 2H MRS can distinguish tumor (glioblastoma) from RN.Materials and Methods
Animal models. Models of tumor and RN (n = 4, each) employed female C57BL/6 mice. Tumor model: GL261 glioblastoma cells (~50,000 cells suspended in 10 μl) were implanted 2 mm posterior to the striatum, 3 mm to the left of the bregma, and 2 mm below the cortical surface. RN model: Single fraction 50-Gy Gamma Knife (Leksell) radiation (50% isodose) was targeted to the left cortex, 3 mm posterior to bregma, as described previously 4. This model of radiation necrosis displays all the histologic hallmarks of RN seen in the clinic.In vivo spectroscopy. Experiments were performed on an 11.74-T Agilent/Varian DirectDrive small-animal scanner. 2H MR RF transmission and reception employed a one-turn 21-mm inner diameter 2H surface coil tuned to 76.65 MHz. Prior to 2H MR, 1H MR experiments, used for shimming, planning, and anatomic registration of the 2H data, were performed, after ip injection of Gd-based contrast agent, using a 50-mm inner diameter volume coil tuned to 499.3 MHz. 2H MR spectra were acquired from a SPin-ECho full-Intensity Acquired Localized (SPECIAL) voxel 5 positioned about the lesion region with outer volume suppression. Acquisition parameters include: TR 450 ms, TE 4.27 ms, averages 1400 (10 min), complex data points 1024, bandwidth 1500 Hz, voxel size 3 × 3 × 3 mm3 to 4 × 4 × 4 mm3, hyperbolic secant adiabatic excitation and inversion pulses, saturation-band thickness 10 mm. An initial 10-min acquisition block occurred before administration of Glc and allowed quantification of the natural abundance “semi-heavy water” (1HO2H = HOD) signal, an internal concentration (mM) reference 6. During the second 10-min acquisition block, Glc (2 g/kg body weight) in 200-μl saline was administered via the tail vein, and this same Glc solution was slowly infused (130 μl/hr) during eight subsequent 10-min acquisition blocks. Time-domain data (free induction decays) from all acquisition blocks were modeled jointly using Bayesian analysis methods 7 as the sum of four exponentially decaying sinusoids 3: HOD, Glc, Glx (a 50%/50% mix of [4,4-2H2] glutamate and [4-2H] glutamine, re oxidative phosphorylation), and [3,3-2H2] lactate (Lac, re aerobic glycolysis). Signal amplitudes were converted to mM concentrations via the natural abundance HOD signal and accounting for T1 and T2 effects.
Results
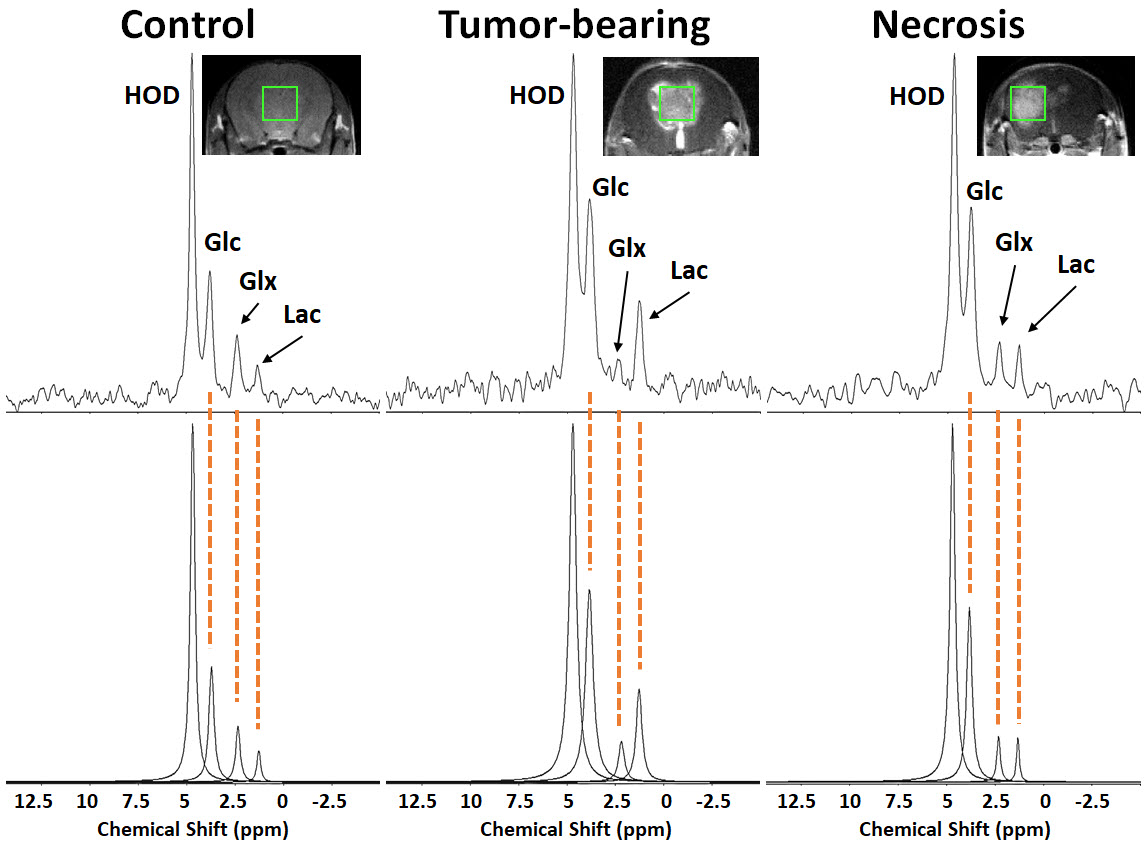
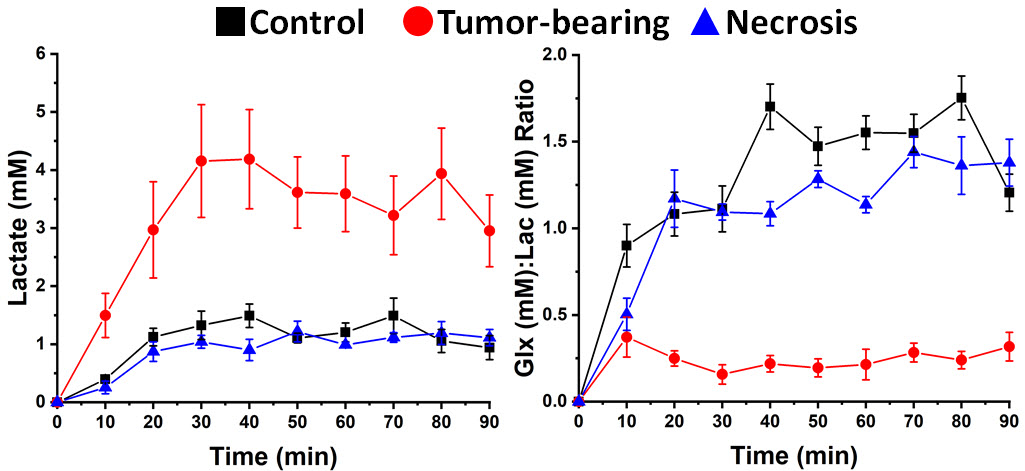
1H B0 map-based gradient shimming resulted in typical 1H water linewidths < 30 Hz (0.06 ppm) across 3 × 3 × 3 mm3 to 4 × 4 × 4 mm3 voxels placed over the lesion (tumor or RN) or at a similar position in control (no lesion) brain. 2H resonance linewidths were typically 10-15 Hz. Figure 1 shows the Fourier transformed spectra (frequency-domain) of data summed over 90 min of Glc infusion for control brain, tumor, and RN. The 2H resonances are well-separated and readily modeled. (The green boxes on the image inserts guide the eye to placement of the SPECIAL voxels.) Figure 2 displays the course of metabolite evolution over the 90-min Glc infusion. There is markedly higher Lac concentration (p = 0.002) and lower Glx:Lac concentration ratio (p < 0.001) in tumor vs. RN (or vs. control). Compared to RN, the tumor nearly exclusively converts Glc to Lac in preference to oxidative metabolism (conversion to Glx).Discussion and Conclusion
Deuterium MRS, in concert with deuterated Glc infusion, clearly distinguishes glioblastoma vs. RN (or control brain) in these mouse models. The differences are not subtle. Aerobic glycolysis (Warburg effect, fermentation) is the predominant Glc metabolic pathway in proliferating GL261 tumor, compared with oxidative phosphorylation (respiration), which is the dominant pathway in RN and control brain. We speculate that 2H MR, in concert with deuterated Glc administration, may provide a powerful metabolic approach for distinguishing malignant gliomas vs. RN in the clinic.Acknowledgements
This research was supported by pilot funding from Mallinckrodt Institute of Radiology (MIR), Washington University. The studies presented in this work were performed, in part, using the Small-Animal MR Facility of MIR, with support from the Small-Animal Cancer Imaging Shared Resource of the Siteman Cancer Center.References
1. Warburg O. On respiratory impairment in cancer cells. Science. 1956;124(3215):269-270.
2. Warburg O. On the origin of cancer cells. Science. 1956;123(3191):309-314.
3. De Feyter HM, Behar KL, Corbin ZA, Fulbright RK, Brown PB, McIntyre S, Nixon TW, Rothman DL, de Graaf RA. Deuterium metabolic imaging (DMI) for MRI-based 3D mapping of metabolism in vivo. Sci Adv. 2018;4(8):eaat7314.
4. Jiang X, Yuan L, Engelbach JA, Cates J, Perez-Torres CJ, Gao F, Thotala D, Drzymala RE, Schmidt RE, Rich KM, Hallahan DE, Ackerman JJ, Garbow JR. A Gamma-Knife-Enabled Mouse Model of Cerebral Single-Hemisphere Delayed Radiation Necrosis. PLoS One. 2015;10(10):e0139596.
5. Mlynárik V, Gambarota G, Frenkel H, Gruetter R. Localized short‐echo‐time proton MR spectroscopy with full signal‐intensity acquisition. Magn Reson Med. 2006;56(5):965-970.
6. Bowen GJ, Ehleringer JR, Chesson LA, Stange E, Cerling TE. Stable isotope ratios of tap water in the contiguous United States. Water Resour Res. 2007;43(3).
7. Quirk JD, Bretthorst GL, Garbow JR, Ackerman JJ. Magnetic resonance data modeling: the Bayesian analysis toolbox. Concept Magn Reson A. 2018;47(2):e21467.
Figures