3426
The relationship of arterial input function between abdominal aorta and hepatic artery1Michigan State University, East Lansing, MI, United States, 2Guizhou Provincial People's Hospital, Guiyang, China
Synopsis
The hepatic artery (HA) input is required in the dual-input, two-compartment model of studying liver function with dynamic gadoxetate-enhanced MRI. The dynamic contrast agent concentration in abdominal aorta (AA) is usually measured and used as the arterial input function instead of that measured in the HA because its small size. In this study, we determined the relationship between these two concentrations. We found that the measured arterial input function in AA can be reliably used as the HA input function with a suppression scaling factor taken into account.
Introduction
The standard dual-input, two-compartment model of studying liver function with dynamic gadoxetate-enhanced MRI requires the hepatic artery (HA) input for liver function measurements1,2. It is a challenge to measure the dynamic contrast agent concentration in the HA due to the small size of the HA, and instead the dynamic contrast agent concentration in abdominal aorta (AA) is measured and used as the arterial input function, assuming that the two concentrations are the same except a time delay of the former. In this study, we determined the relationship between these two concentrations.Theory
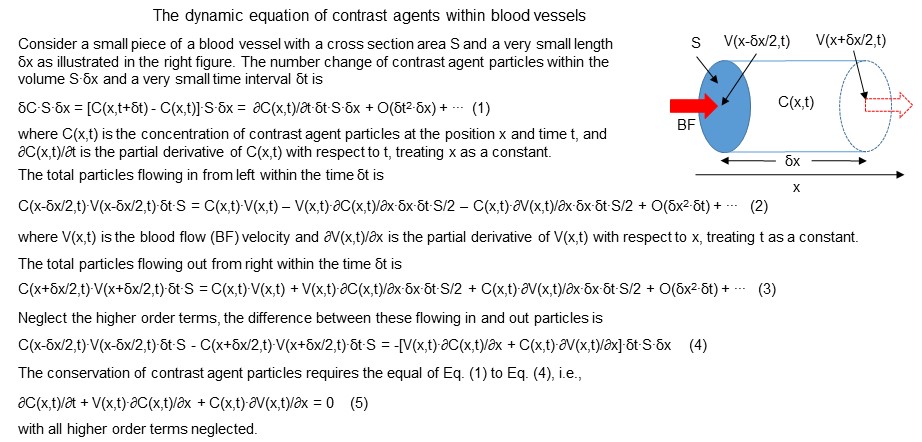
In a blood vessel at position x, the total derivative of contrast agent concentration C(x,t) with respect to time t is governed by the equation:dC(x,t)/dt = ∂C(x,t)/∂t + V(x,t)∙∂C(x,t)/∂x = -C(x,t)·∂V(x,t)/∂x (1)
where ∂C(x,t)/∂t and ∂C(x,t)/∂x are the partial derivate of C(x,t) with respect to t and x, respectively (Fig. 1). V(x,t) is the blood flow velocity. For constant blood flow V, we have dC(x,t)/dt = 0 or ∂C(x,t)/∂t = -V∙∂C(x,t)/∂x, i.e., a temporal increase in C(x,t) is accompanied with a spatial decrease in C(x,t), and vice versa. The solution is C(x2,t+ẟt) = C(x1,t) with ẟt = (x2 – x1)/V. However, for an increased blood flow, i.e., ∂V(x,t)/∂x > 0, it reduces C(x,t) as shown in Eq. (1), and this reduction in C(x,t) should result in a reduced DCE-MRI signal. The DCE-MRI time signal S(x,t) is related to C(x,t) by the FLASH equation3:
S(x,t) = ρ0sin(θ)[1 - e-TR·R1(x,t)]/[1 - cos(θ)·e-TR·R1(x,t)] (2)
where R1(x,t) = R1(x,0) + α∙C(x,t), TR is the repetition time, θ is the flip angle, R1(x,0) is the pre-contrast longitudinal relaxation rate of water, and α is the relaxivity associated with the contrast agent. For constant blood flow with assumption of R1(x2,0) = R1(x1,0), we found
S(x2,t+δt)/S(x2,0) = S(x1,t)/S(x1,0) (3)
where S(x,0) is the pre-contrast signal intensity.
Methods and Materials
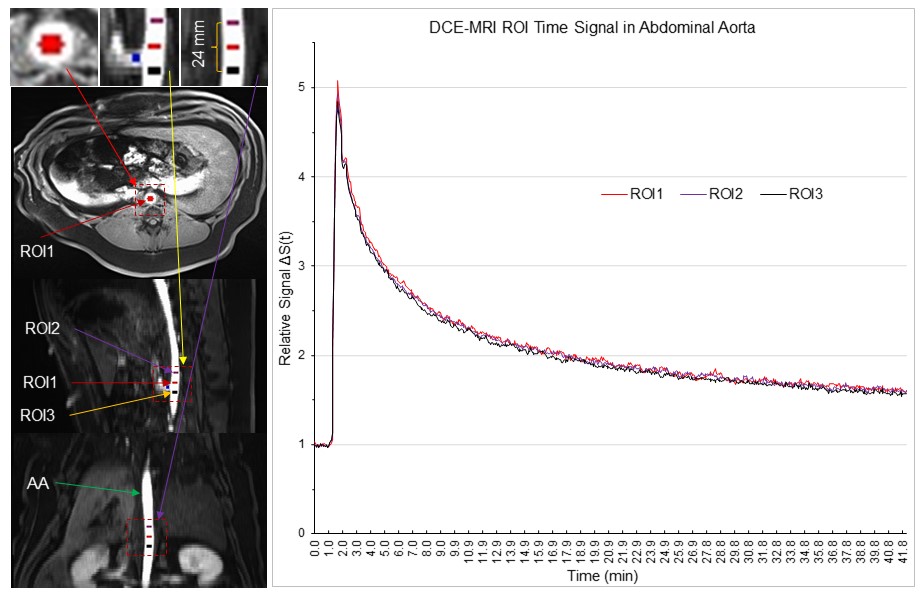
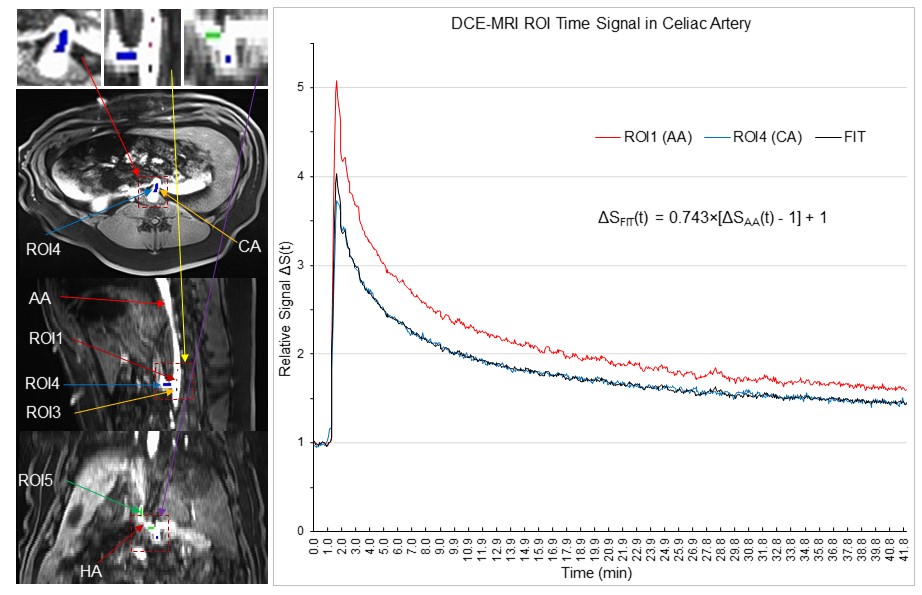
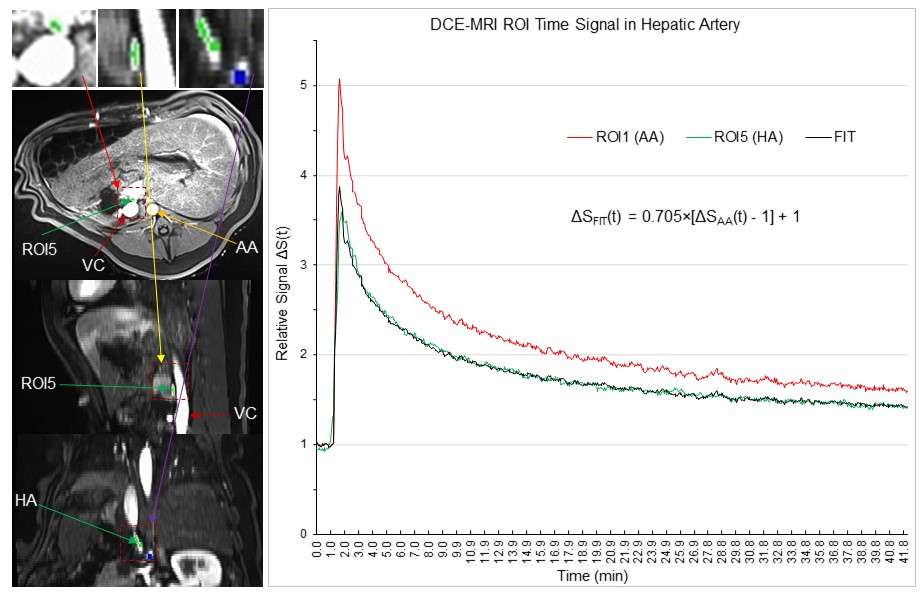
Six pigs underwent a 42.35 min DCE-MRI scan (Siemens 1.5T scanner, vibe pulse sequence, TE/TR=1.77/3.65 ms, FA=12°, FOV=320mm, matrix 256x256, 64 slices with slice thickness 3mm, 3.51s acquisition time for each image volume, and 724 volumes). Two scans were performed with Gd-EOB-DTPA injection, two were performed with Gd-DTPA injection and the other two were performed with Gd-BOPTA injection. We performed three region of interest (ROI) analyses using AFNI4. (i): To test Eq. (3), three ROIs with 27 voxels each were placed in the abdominal aorta. The 1st ROI was placed right above the celiac artery (CA), the 2nd ROI with a distance of 12 mm was placed above the 1st ROI, and the 3rd ROI with the same 12 mm distance was placed below the 1st ROI (Fig. 2). (ii): The diameter of CA is less than half of that of AA, and this substantially reduced size from AA to CA may increase V(x,t) from AA to CA, resulting in a reduced S(x,t) from AA to CA as discussed above. To test this prediction, the 4th ROI with 27 voxels was placed in the CA just outside the AA (Fig. 3). (iii): The 5th ROI with 27 voxels was placed within the HA to determine the relationship of S(x,t) between the HA and AA (Fig. 4).Results and Discussion
For each of the five ROIs in each scan, the mean signal S(t) averaged over all 27 voxels within that ROI was first computed, followed by computing its baseline mean signal S(0) averaged over the baseline period (22 time points), and then measuring their relative signal, i.e., ΔS(t)=S(t)/S(0). Then, we computed the group-mean ΔS(t) averaged over the six subjects. Fig. 2 illustrates this group-mean ΔSAA(t) for the three ROIs in the AA. These three time signals were almost identical. As the blood flow velocity in arteries is ranged from 49 – 190 mm/s, the maximum time (ẟt) it takes to pass the 24 mm distance should be 0.49s that is much smaller than the 3.51s temporal resolution of the DCE-MRI. The blood flow velocity in this part of the AA was most likely the same under the well-controlled experimental condition. Accordingly, the almost identical ΔSAA(t) in these three ROIs are consistent with Eq. (3). Fig. 3 illustrates the group-mean ΔSCA(t) in the CA and Fig. 4 illustrates ΔSHA(t) in the HA, respectively. The magnitude of ΔSCA(t) was clearly reduced relative to ΔSAA(t), consistent with our prediction. To compute this reduction rate (R), we first computed the ratio of [ΔSCA(t) - 1] to [ΔSAA(t) - 1] for each time point for the post-contrast period, and then its mean and SD, resulted in R=0.743±0.030. The magnitude of ΔSHA(t) was further reduced as shown in Fig. 4, and R=0.705±0.032. Using the mean R value, the curve ΔSFIT(t) = R∙[ΔSAA(t) - 1] +1 is almost identical to the reduced ΔS(t) for both CA and HA, showing a quantitative relationship of contrast agent concentration between AA and both CA and HA, respectively. In conclusion, the measured arterial input function in AA can be reliably used as the HA input function with the reduction factor R taken into account.Acknowledgements
No acknowledgement found.References
1 Sourbron, S., Sommer, W. H., Reiser, M. F. & Zech, C. J. Combined quantification of liver perfusion and function with dynamic gadoxetic acid-enhanced MR imaging. Radiology 263, 874-883, doi:10.1148/radiol.12110337 (2012).
2 Simeth, J. et al. Quantification of liver function by linearization of a two-compartment model of gadoxetic acid uptake using dynamic contrast-enhanced magnetic resonance imaging. NMR Biomed 31, e3913, doi:10.1002/nbm.3913 (2018).
3 Haacke, E. M. et al. New algorithm for quantifying vascular changes in dynamic contrast-enhanced MRI independent of absolute T1 values. Magn Reson Med 58, 463-472, doi:10.1002/mrm.21358 (2007).
4 Cox, R. W. AFNI: software for analysis and visualization of functional magnetic resonance neuroimages. Comput Biomed Res 29, 162-173 (1996).
Figures