3424
Free-breathing liver T1 mapping for quantitative oxygen consumption1Advanced Imaging Research Center, University of Texas Southwestern, Dallas, TX, United States
Synopsis
We introduce a dual flip angle T1 method based on respiratory triggered cine spoiled gradient echo acquisition. The method is used to assess the change in T1 of liver tissue between breathing medical air and 100% O2 in an animal model. Our results show small but significant decrease in T1 of liver due to hypoxia, indicating increased oxygen partial pressure in tissue.
Introduction
Oxygen sensitive MRI has the potential to characterize tumor hypoxia and to assess the efficacy of therapeutic interventions. Studies have shown that, hyperoxic gas breathing, affects both positively and negatively on T1 due to complex magnetic phenomena. Routinely, T1 of liver is measured using inversion recovery methods (IR-methods) that require breath holding. Free-breathing IR-methods with a double respiratory triggered acquisition (for both inversion and acquisition), can suppress motion and ensure inversion and acquisition slices are identically localized. However, due to the dependence on the breathing pattern, it cannot guarantee a knowable, constant set of inversion times, leading to errors in T1 calculations. This is especially problematic when segmented k-space acquisition is used. Thus, routinely, T1 maps of liver based on IR-methods require breath-holding; posing severe limits in clinical and pre-clinical imaging. Here we propose a dual flip angle T1 method designed for respiratory triggered Oxygen sensitive MRI. The method is used to assess the change in T1 of liver tissue between breathing medical air (21% O2) and 100% O2 in an animal model. We address the issues of B1+ inhomogeneity, motion and steady state of longitudinal magnetization, which are pertinent to the dual flip angle method.Method
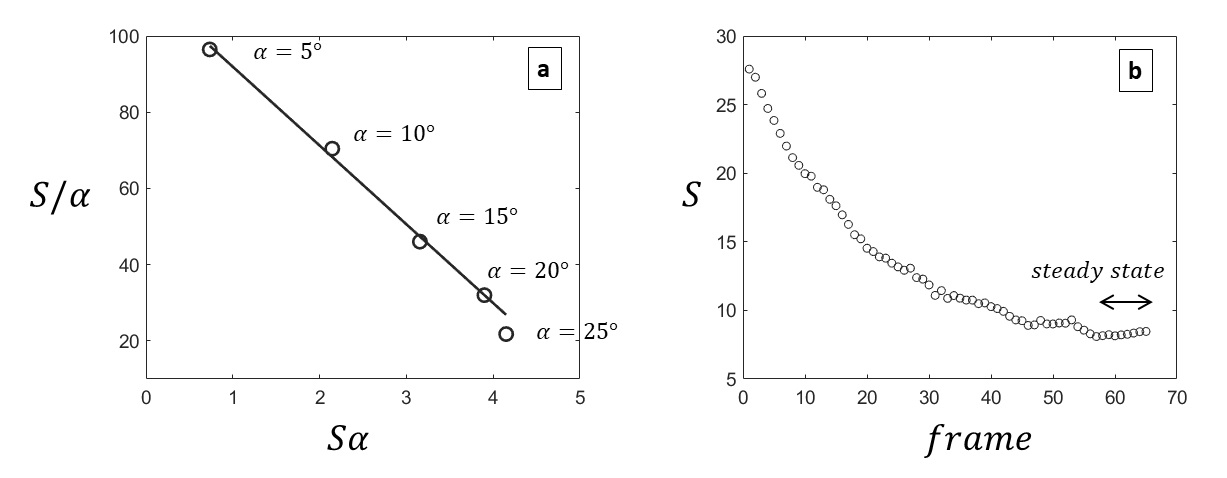
At steady state, a spoiled gradient echo signal, S can be approximated to1:$$\frac{S}{\alpha}=\frac{-T1_{app}}{2\times TR}S\alpha + const$$
Where the measured flip angle, a is different to its nominal value as:
$$\alpha=f(\bf r)\alpha_{nom} $$
due to B1 inhomogeneity, where $$$f(\bf r)$$$ is a spatially dependent factor. The apparent T1 can be calculated, using the steady state signal at two different flip angles. Substituting a in equation 1, it can be shown that $$$T1_{actual}=f(r)^{2}T1_{app}$$$. Therefore, any ratios of T1app calculated using equation 1 is identical to the ratios of T1actual.
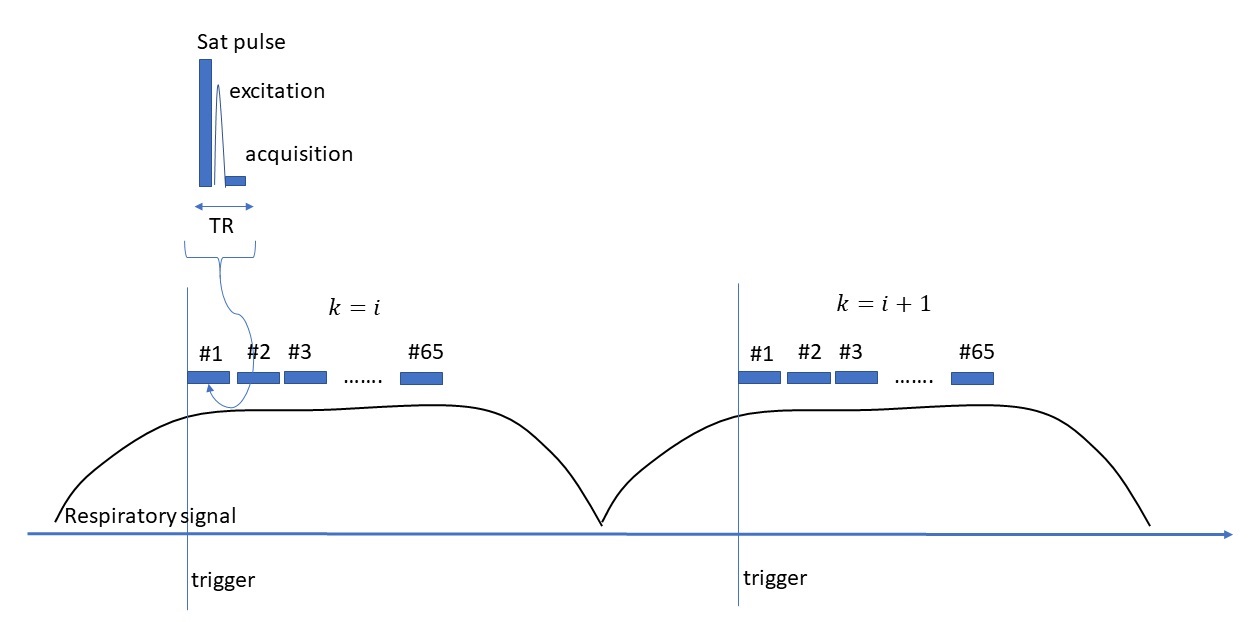
The steady state is disturbed when excitations pauses between respiratory cycles in respiratory triggered acquisitions. Continuous pulsing too does not help because of the through plane motion during the adjacent respiratory triggers. One solution to this is to bring the magnetization into a steady at each trigger by acquiring a movie of images. The proposed pulse sequence (Figure 1) is a respiratory triggered, radio frequency spoiled, flow compensated cine gradient echo method (FLASH). To suppress the motion artifacts from cardiac motion, a saturation pulse was applied to the thoracic region. Two cine images were acquired with two flip angles (α1, α2). Following averaging of cine frames during the motionless steady state region (Figure 2b); apparent T1 maps were calculated according to equation 1.
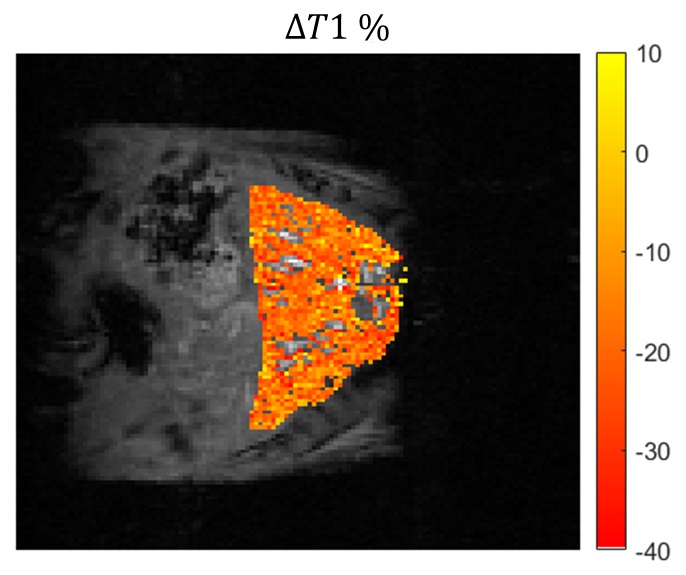
A map of percentage difference in T1 between the gas challenges was calculated as: $$$\triangle T1 = 100\times\frac{T1_{O2}-T1_{air}}{T1_{air}}$$$. The $$$\triangle T1$$$% map is free of B1 inhomogeneity effects due its relationship to the apparent T1 and represents the actual T1 difference between the gas challenges.
Five liver $$$\triangle T1$$$% maps were generated using wild type mice on a 7T scanner (Bruker Biospec, Germany) with the approval of the Institutional Animal Care and Use Committee. Mice were anesthetized with 1.5-2.5% Isoflurane. Mice breathed medical air (21% O2) in the baseline acquisition and then the gas was switched to 100% O2. The gas flow rate was 400 ml/min. A pneumonic sensor (SA Instruments, Stony Brook, NY) placed on the abdomen was used for prospective triggering. The ambient temperature was maintained at 28 °C. The breathing rate was 30-35 bpm. A 40 mm Millipede RF coil was used for transmitting and receiving. Cine FLASH parameters were: TE/TR=10ms/2.3ms, FOV=40x40mm2, NEX =1, slice thickness =1mm, # segments=1, # frames=65.
Prior to the breathing challenge, experiments were carried out with the same sequence to determine the optimum flip angles and the frame limits for the steady state.
Results
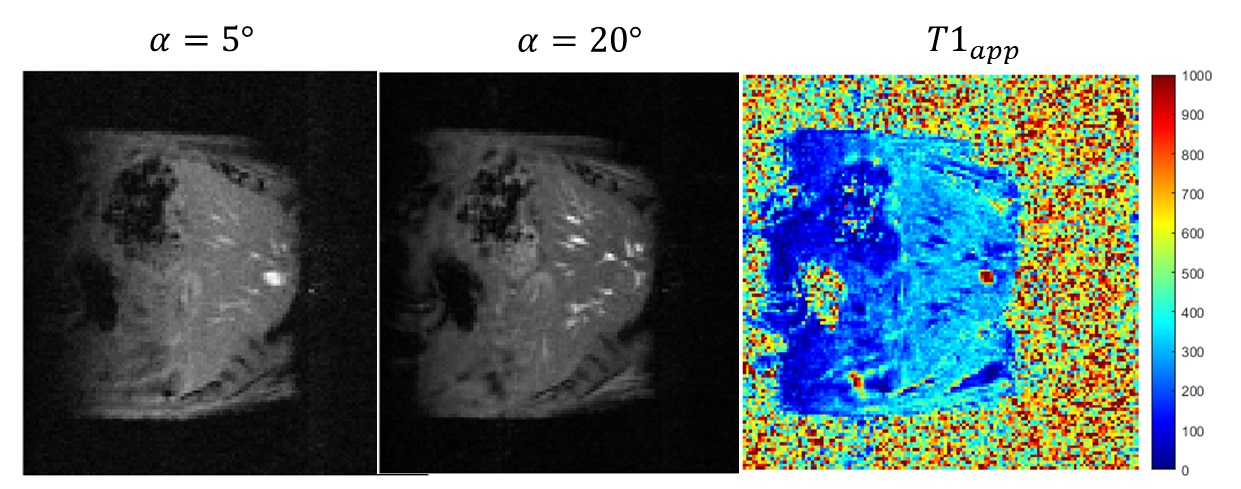
Steady state signal at varying flip angles showed that the linearity of equation 1 is maintained up to 20 degrees (Figure 2a). Therefore we chose α1=5° and α2=20°. A steady state signal was achieved after 55 excitations (Figure 2b), hence frames 55 to 65 were averaged to improve the SNR by a factor of 3.2. Figure 3 shows an example of base images and the calculated apparent T1 map. The average apparent T1 (uncorrected for B1 inhomogeneity) when breathing medical air was 300+/- 22 ms. All mice showed overall negative change in T1. The mean $$$\triangle T1$$$% was -3.1 ± 1.2%. The mean Fisher's moment coefficient of skewness of the $$$\triangle T1$$$% maps was 0.27, confirming the small but significant trend towards negative change in T1.Discussion
Our results show that the liver T1 decreased after switching to 100% O2 from breathing medical air. This is consistent with the studies done in O2 solutions and cerebrospinal fluid. T1 is expected to decrease in response to hyperoxic gas breathing due to the increased presence of paramagnetic oxygen in tissue2. However, there has also been reports of increasing or minimal change in T1 with hypoxic gas challenge. The reason for this could be the increased oxyhemoglobin in vascular regions3,4. It is clear that the combination of positive and negative changes causes the overall change in T1 of liver to be very small. The method presented here proves to be a robust technique to detect such small changes in the liver under free-breathing conditions.Acknowledgements
We thank Dr. Mishra Prashant for his valuable input on the interpretation of the results.References
1. Helms G, Dathe H, Dechent P. Quantitative FLASH MRI at 3T using a rational approximation of the Ernst equation. Magn Reson Med. 2008 Mar;59(3):667-72.
2. Beeman SC, Shui YB, Perez‐Torres CJ, Engelbach JA, Ackerman JJH, Garbow JR. O2‐sensitive MRI distinguishes brain tumor versus radiation necrosis inmurine models. Magnet Reson Med. 2016;75:2442‐2447.
3. O'Connor JPB, Boult JKR, Jamin Y, et al. Oxygen‐enhanced MRI accurately identifies, quantifies, and maps tumor Hypoxia in preclinical Cancer models. Cancer Res. 2016;76:787‐795.
4. Grgac K, van Zijl PC, Qin Q. Hematocrit and oxygenation dependence of blood 1H2O T1 at 7 tesla. Magn Reson Med. 2013;70:1153‐1159.
Figures