3420
Pre-clinical Fast Field-Cycling NMR for the detection and classification of breast cancer1Institute of Medical Sciences, School of Medicine, Medical Sciences and Nutrition, University of Aberdeen, Aberdeen, Scotland, 2Department of Pathology, Aberdeen Royal Infirmary, Aberdeen, Scotland, 3Breast Unit, Aberdeen Royal Infirmary, Aberdeen, Scotland, 4Institute of Dentistry, School of Medicine, Medical Sciences and Nutrition, University of Aberdeen, Aberdeen, Scotland, 5Aberdeen Biomedical Imaging Centre, University of Aberdeen, Aberdeen, Scotland
Synopsis
This study aims to explore novel biomarkers of breast cancer using FFC-NMR. NMR dispersion profiles were generated by analysing patient-matched tumour, peritumoral zone and distant normal fixed tissue samples from twenty breast cancer patients. These profiles were analysed using piecewise power models and the numerical parameters derived from these models could significantly classify the different regions of breast tissue and distinguish patients from different prognostic categories. The numerical parameters investigated in this study may have potential as quantitative biomarkers for breast cancer detection and risk stratification.
Introduction
Fast field-cycling nuclear magnetic resonance (FFC-NMR) relaxometry is a low-field technique that can provide unique insights into molecular dynamics of biological samples, with potential translation to in vivo applications.1 FFC relaxometers can rapidly switch between different strengths of an applied magnetic field to facilitate the measurement of the longitudinal relaxation time, T1, or rate, R1 (1/T1), as a function of magnetic field strength, which is plotted as a NMR dispersion (NMRD) curve. This curve is sensitive to changes in tissue architecture, which is one of the key events that lead to cancer development and metastatic progression. Therefore, the physical information contained within the NMRD curve may prove to be a rich source of diagnostic and prognostic information. The aim of this study is to describe the physical features of R1 dispersion curves from human breast tissue samples (cancerous and normal) and use mathematical models to investigate how numerical parameters, derived from these curves, could potentially serve as biomarkers for breast cancer detection and relapse risk stratification.Methods
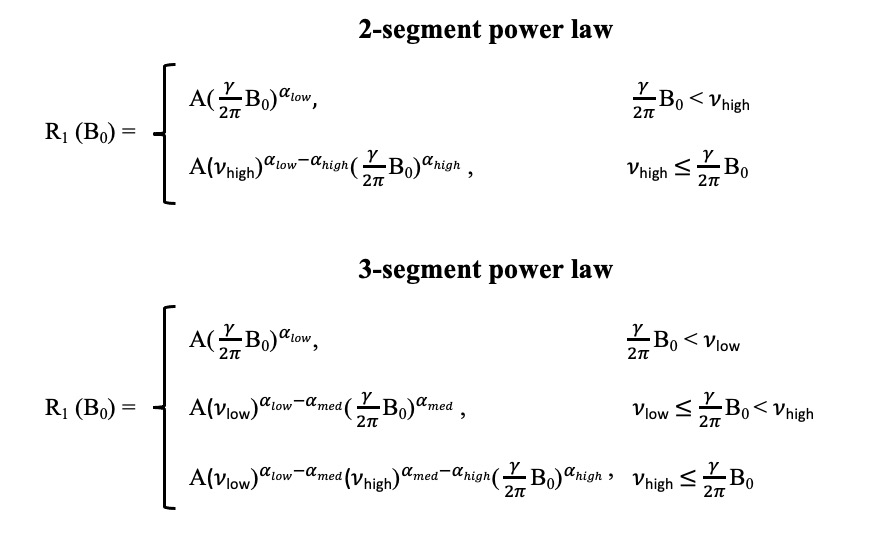
A total of 148 fixed tissue samples were acquired, with ethical approval, from the tumour, peritumoral zone and distant normal regions (non-adipose and adipose) from twenty female breast cancer patients at the Aberdeen Royal Infirmary, Scotland. The pathology reported included Nottingham Prognostic Index (NPI) scores for each patient. The NPI is an internationally validated clinicopathological tool that is used for risk stratification in breast cancer; based on the score, patients can be grouped into one of five prognostic categories: excellent, good, moderate I, moderate II and poor. The patients in our study belonged to the latter three categories. NMRD curves were acquired from each tissue sample using the benchtop relaxometer (SMARtracer; Stelar S.r.l., Mede, Italy). Each sample was scanned with 30 different evolution fields in the 0.001-8 MHz proton Larmor frequency range. The analysis of R1-dispersion curves was achieved using the software, Fitlike2.2 R1-dispersion curves were analysed by curve fitting, using piece-wise power laws (Figure 1) and the following model parameters were exported: slope at low (αlow), medium (αmed) and high (αhigh) fields, the low (νlow) and high (νhigh) field transition frequency between the segments and the vertical off-set of the whole dispersion curve (A). All statistical analysis was performed using IBM SPSS Statistics 27 and model parameters were evaluated between different regions of breast tissue and different NPI categories using either an independent T-test/Mann-Whitney U or a One-way ANOVA/Kruskal-Wallis test (significance p<0.05, 95% confidence interval).Results and discussion
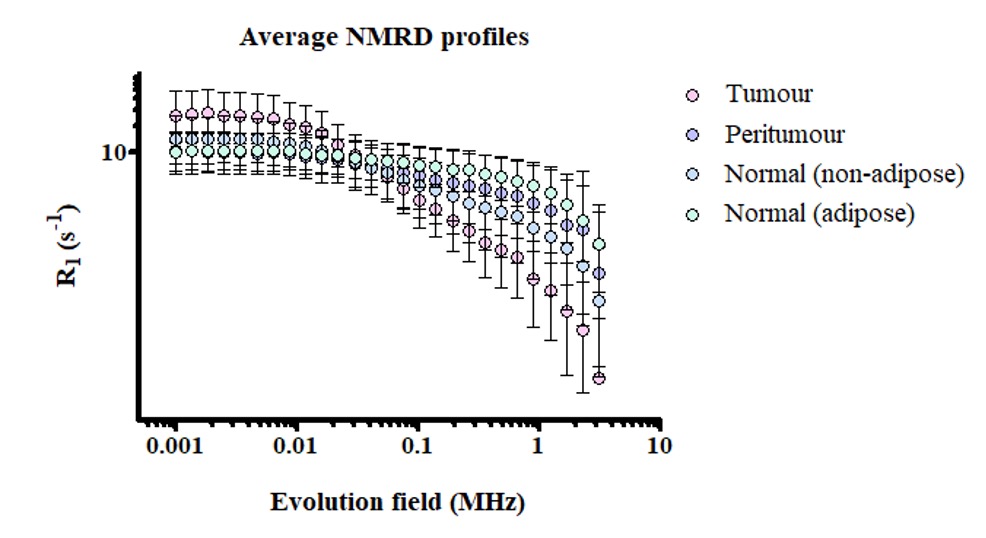
On visual inspection, clear and distinct dispersion curves were observed when sampling each of the individual regions of breast tissue (Figure 2). The numerical parameters that were statistically relevant in distinguishing the different regions of breast tissue included: A, αlow, αmed, αhigh, νlow and νhigh. Tumour tissue could be significantly distinguished from that of the peritumoral zone by αlow (p<0.05) and αhigh (p<0.005) and from the distant normal tissue by A (p<0.005), αmed (p<0.005) and αhigh (p<0.05). Our findings, that differences exist between the physical NMR dispersion curve of cancerous and non-cancerous breast tissue, agrees with previous work carried out by our group and others.3-6 We also investigated the potential of these numerical parameters to distinguish breast cancer patients based on their prognosis by grouping the curve fit parameters, from each individual NMRD curve, into one of the three NPI categories and analysed these per each individual region of breast tissue. We were able to quantify differences between the dispersion curves of these prognostic categories when we sampled the distant normal tissue. For the non-adipose normal tissue, moderate I and moderate II patients could be significantly distinguished by αhigh (p<0.05) and νhigh (p<0.05). For the normal adipose tissue, moderate I and poor patients could be significantly distinguished by A (p<0.05) and αlow (p<0.005) and moderate II and poor patients by αlow (p<0.05). With regards to the distant normal adipose tissue, the reduction in both A and αlow appeared to correspond to a worse prognosis. These findings suggest that the earliest biophysical changes related to disease progression may occur in the periphery rather than the tumour itself.Conclusion
This study is the first step to systematically establish quantification of differences in the NMRD profiles obtained from breast cancer tissue samples. Overall, we have shown that NMRD curves may house novel quantitative diagnostic and prognostic biomarkers of breast cancer. Whilst our study has employed the benchtop relaxometer to study ex vivo tissue samples, our findings may have translational potential when combined with Field-cycling imaging that has been developed at the University of Aberdeen. Indeed, the first in vivo T1 measurements from breast cancer patients may be presented by another member of our team.7Acknowledgements
No acknowledgement found.References
1. Broche LM, Ross PJ, Davies GR, et al. A whole-body Fast Field-Cycling scanner for clinical molecular imaging studies. Sci. Rep. 2019;9(1):10402.
2. Fitlike2 code freely available from GitHub: https://github.com/ManuIdentiFY/FitLike2.
3. Wang Y, Cooperman H, Rao V, et al. A nuclear magnetic relaxation dispersion profile of normal breast and tumor tissues. Magn. Reson. Imaging. 1984;2(3):235.
4. Broche LM, Zampetoulas V, Ross PJ, et al. Detection of tissue remodelling by fast field-cycling methods. Magn. Reson. Mater. Physics. Biol. Med. 2015;28(S1):s43-s44.
5. Ruggiero MR, Baroni S, Pezzana S, et al. Evidence for the Role of Intracellular Water Lifetime as a Tumour Biomarker Obtained by In Vivo Field-Cycling Relaxometry. Angew. Chemie – Int. Ed. 2018;57(25):7468-7472.
6. Bitonto V, Ruggiero M, Pittaro A, et al. Low-field nmr relaxometry for intraoperative tumour margin assessment in breast-conserving surgery. Cancers (Basel). 2021;13(16):4141.
7. Mallikourti V, Maier O, Ross PJ, et al. Field-Cycling imaging identifies breast cancer at low magnetic field strengths. ISMRM 31st Annual Meeting. 2022.
Figures