3419
R1 and R2* Mismatch on Ferumoxytol-Enhanced MRI Predicts Response of Breast Cancer Brain Metastases to Liposomal Irinotecan1Department of Cancer Physiology, Moffitti Cancer Center and Research Institute, Tampa,, FL, United States, 2Department of Radiology, Moffitti Cancer Center and Research Institute, Tampa, FL, United States, 3Department of Breast Oncology, Moffitti Cancer Center and Research Institute, Tampa, FL, United States, 4Ipsen Bioscience,, Cambridge,, MA, United States, 5Honor Health Research Institute, Scottsdale,, AZ, United States, 6Imaging Endpoints Core Lab, Scottsdale,, AZ, United States, 7Department of Oncologic Sciences, University of South Florida, Tampa, FL, United States
Synopsis
Phagocytosis of ferumoxytol (FMX) by tumor-associated macrophages (TAMs) results in intracellular compartmentation, which has opposing effects on longitudinal (R1) and transverse (R2*) relaxivity of FMX. Pixelwise mismatch between apparent ferumoxytol concentration (FMXc) computed from post-FMX R1 and R2* maps can be exploited to identify pixels with high concentrations of phagocytosed (compartmentalized) FMX. Here we show mismatch on MRI, acquired 24 h post-FMX, measured in terms of compartmentation index (CI) greater than 1 and hypothesized to be indicative of FMX intracellular compartmentation, was predictive of the response of breast cancer brain metastases to liposomal irinotecan (nal-IRI) at the individual tumor level.
Introduction
Irinotecan (IRI) is used as salvage treatment in advanced metastatic breast cancer (mBC) patients to prolong the survival1. Liposomal formulation of irinotecan (nal-IRI) is used to increase tumor exposure to IRI2. Ferumoxytol (FMX) is an ultra-small iron oxide nanoparticle (USPIO) with unique temporal biodistribution producing in varied MRI enhancement. During the first few hours after infusion, FMX resides in the vascular space producing vascular enhancement. After approximately 24 hours, most of the FMX that extravasates from leaky vasculature is phagocytosed by local macrophages, resulting in delayed enhancement on MRI 3,4. FMX has previously been demonstrated to colocalize with tumor-associated macrophages (TAMs) in tumors5-7, which can modulate lesion permeability characteristic and may be mechanistically relevant to nal-IRI anti-tumor activity. Phagocytosis of FMX by TAMs results in intracellular compartmentation, which has opposing effects on longitudinal $$$(R_1)$$$ and transverse relaxivity $$$(R_2^*)$$$of FMX8. Mismatch between apparent ferumoxytol concentration ($$$FMX_C$$$) computed from changes in pixelwise $$$R_1$$$ and $$$R_2^*$$$ post-FMX can be exploited to identify pixels with high concentrations of phagocytosed (compartmentalized) FMX. Here we investigate such a measure of FMX compartmentation, such as may result from phagocytosis of the FMX, as a companion imaging biomarker for predicting response of breast cancer brain metastases to nal-IRI taking advantage of robust co-registration across imaging sessions.Methods and Materials:
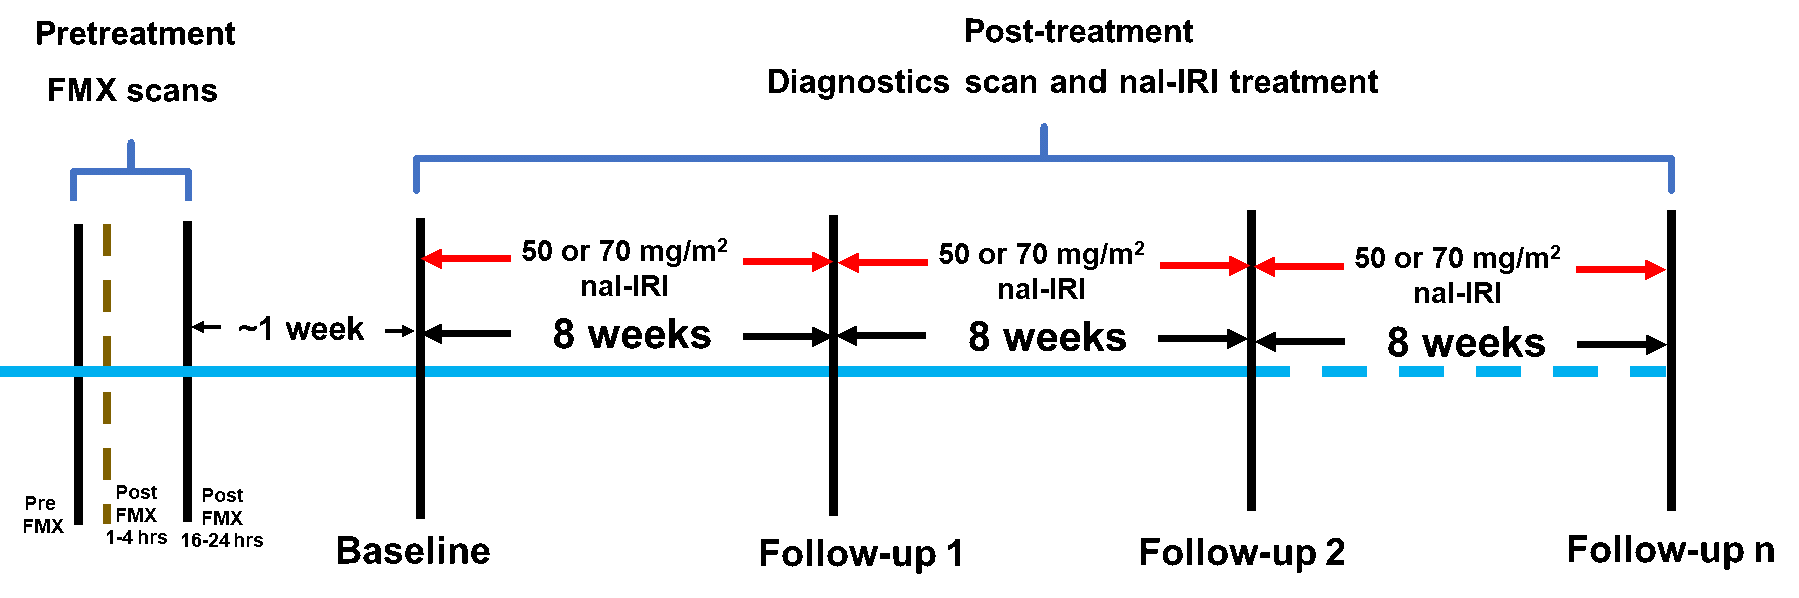
The study schema is shown in Figure 1. A series of 6 fat suppressed spoiled gradient echo (SPGRE) scans were acquired at 1.5 T (or 3.0 T) using the following parameters: TE = 1.5(2.2), 3.0(4.5), 4.5(6.8), 6.0(9.0), 9.0(11.3), and 13.2(13.5) milliseconds, slice thickness/slice gap = 5/0 mm, and matrix size = 256 X 256 with a field-of-view to cover the whole head along with two phantom tubes containing known concentrations of FMX.Quantification of FMX compartmentation:
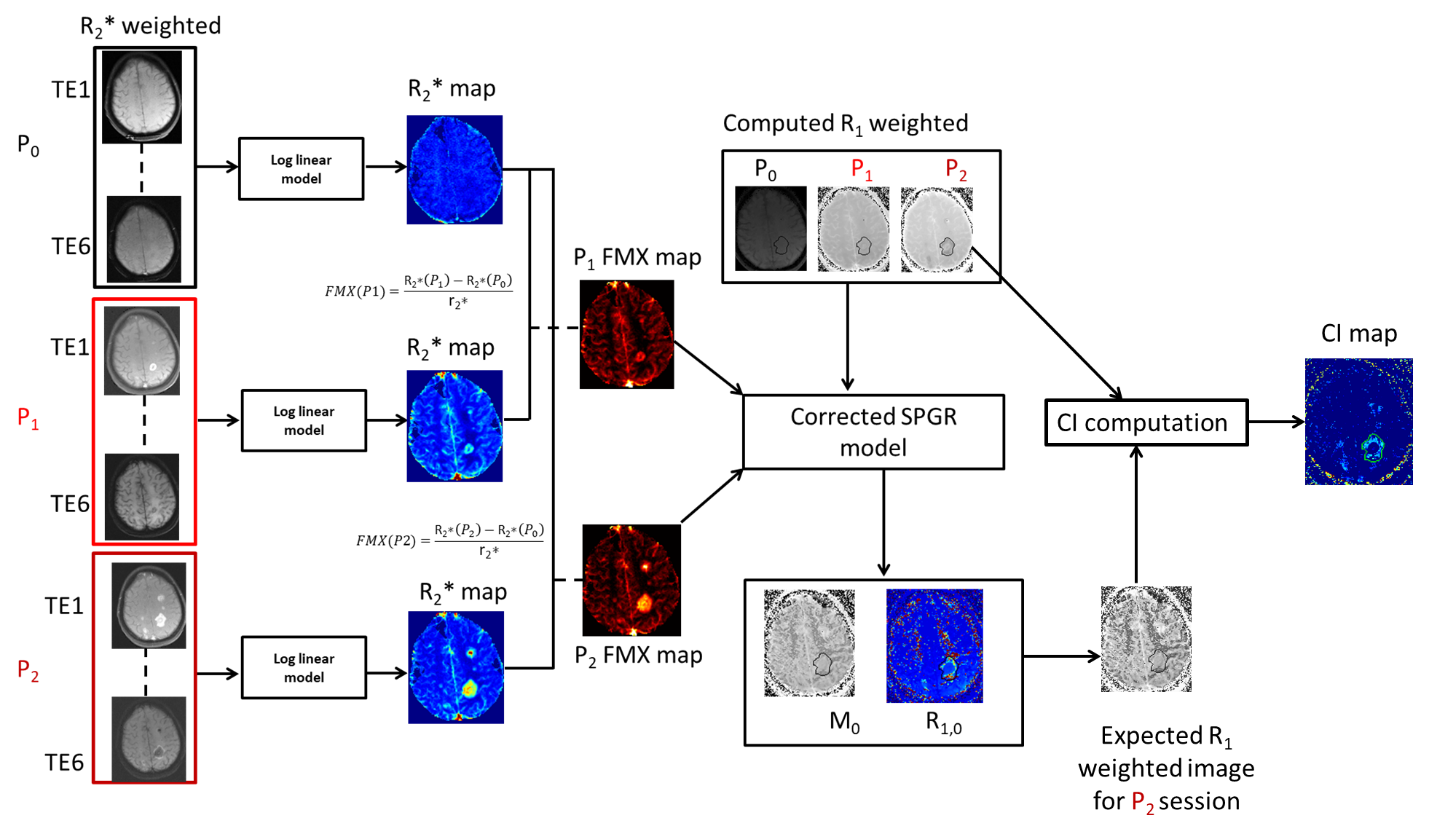
In our study, we did not acquire $$$R_1$$$ maps to limit the total scan duration for reasons of patient comfort. Instead, for each patient, we used a modified SPGRE signal equation to calculate the R1-weighed post-FMX image that would be expected for a given $$$FMX_C$$$ (eq. [3]) and compared that to the R1-weighted component that was computed from the shortest TE post-FMX image that was acquired. This approach is described in equations 1-7 and Figure 2, as follows:
$$$S\;=\;M_0*\frac{(1-e^{-TR*R_1})}{(1-cos(α)*e^{-TR*R_1})}*sin(α)*e^{-TR*R_2^*}[1]$$$
$$$R_1\;=\;R_{1,0} +FMX_{c,brain}*r_{1,FMX}\;[2] $$$
$$$FMX_C\;=\;\frac{R_{2,postFMX}^* - R_{2,preFMX}^*}{r_{2,postFMX}^*}\;[3]$$$
Combining eq. [1] and [2], the signal equation can be written in terms of $$$R_1$$$ as in eq. [4]:
$$$S_{Computed,i}\;=\;\frac{S}{sin(α)*e^{-TE*R_2^*}} = M_0 * \frac{(1-e^{-TR*(R_{1,0}+FMX_{C,i}*r_{1,FMX})})}{(1-cos(α)*e^{-TR*(R_{1,0}+FMX_{C,i}*r_{1,FMX})})}\; [4]$$$
The subscript ‘i’ in the eq. [4] corresponds to the P0, P1, and P2 imaging sessions (details in Figure 2). Receiver gain differences between FMX sessions were corrected by linear scaling correction to signal intensities from the two phantom tubes that were present on all scans.
Our model requires a pre-FMX and two post-FMX imaging scans to properly resolve FMX enhancement from the vasculature and intracellular compartmentation. Non-linear regression is used to fit for the parameters $$$R_{1,0}$$$ and $$$M_0$$$ in eq. [4]. The fitted parameters are then used to calculate fitted R1, and expected R1 weighted signal as shown in eq. [5] and [6].
$$$R_{1,I,fitted}\;=\;R_{1,0,fitted} + FMX_{c,i}*r_{1,FMX}\;[5]$$$
$$$S_{Expected,i}\;=\;M_{0,fitted}*\frac{(1-e^{-TR*R_{1,I,fitted}})}{(1-cos(α)*e^{-TR*R_{1,I,fitted}})}\;[6]$$$
A compartmentation index (CI) was computed as the ratio of $$$S_Expected,i$$$ and $$$S_Computed,i$$$ as shown in eq. [7]: values above unity would indicate some degree of extravascular intracellular compartmentation.
$$$CI = (\frac{S_{Expected,16-24 hrs PostFMX}}{S_{Computed,16-24 hrs PostFMX}})\;[7]$$$
Imaging data from a total of 19 tumors in 7 patients were analyzed. A tumor was classified as non-responding tumor (NRT; 10 tumors) if it did not exhibit PR (diameter decrease less than 30%) or exhibited progression (change from nadir is greater than 20 %9), and classified as responding tumor (RT; 9 tumors) otherwise.
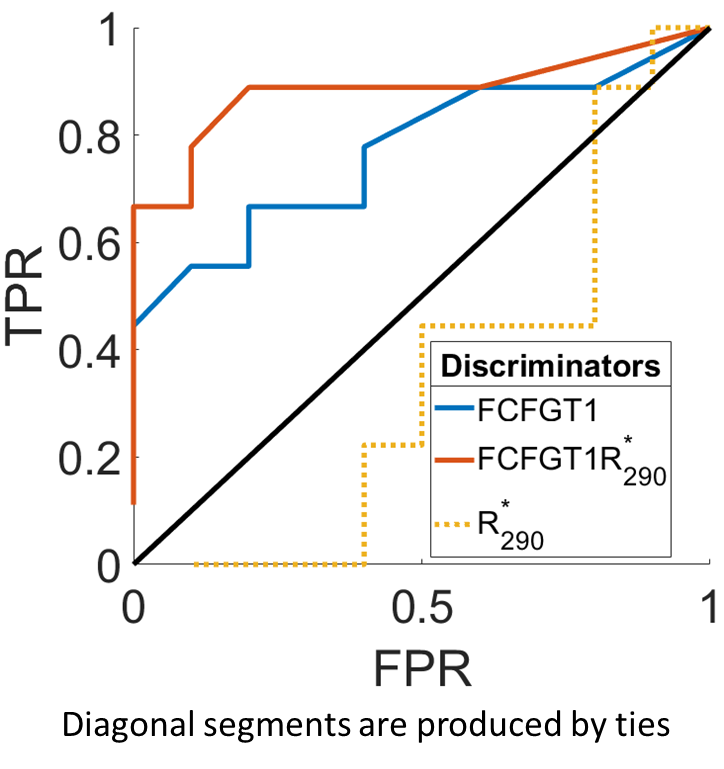
From the CI maps, we computed two metrics for each brain tumor: (i) the fraction of pixels within a tumor VOI with CI greater than 1 $$$(FCIGT1)$$$, and, (ii) the fraction of pixels within a tumor VOI with CI greater than 1 and $$$R_2^*$$$ in 90th and higher percentile $$$(FCIGT1R_{2,90}^*)$$$. Area-under-the-receiver-operator-curve (AUROC) for the task of discriminating RT and NRT tumors was computed. Leave-one-out-cross-validation (LOOCV) was performed.
Results and Discussion:
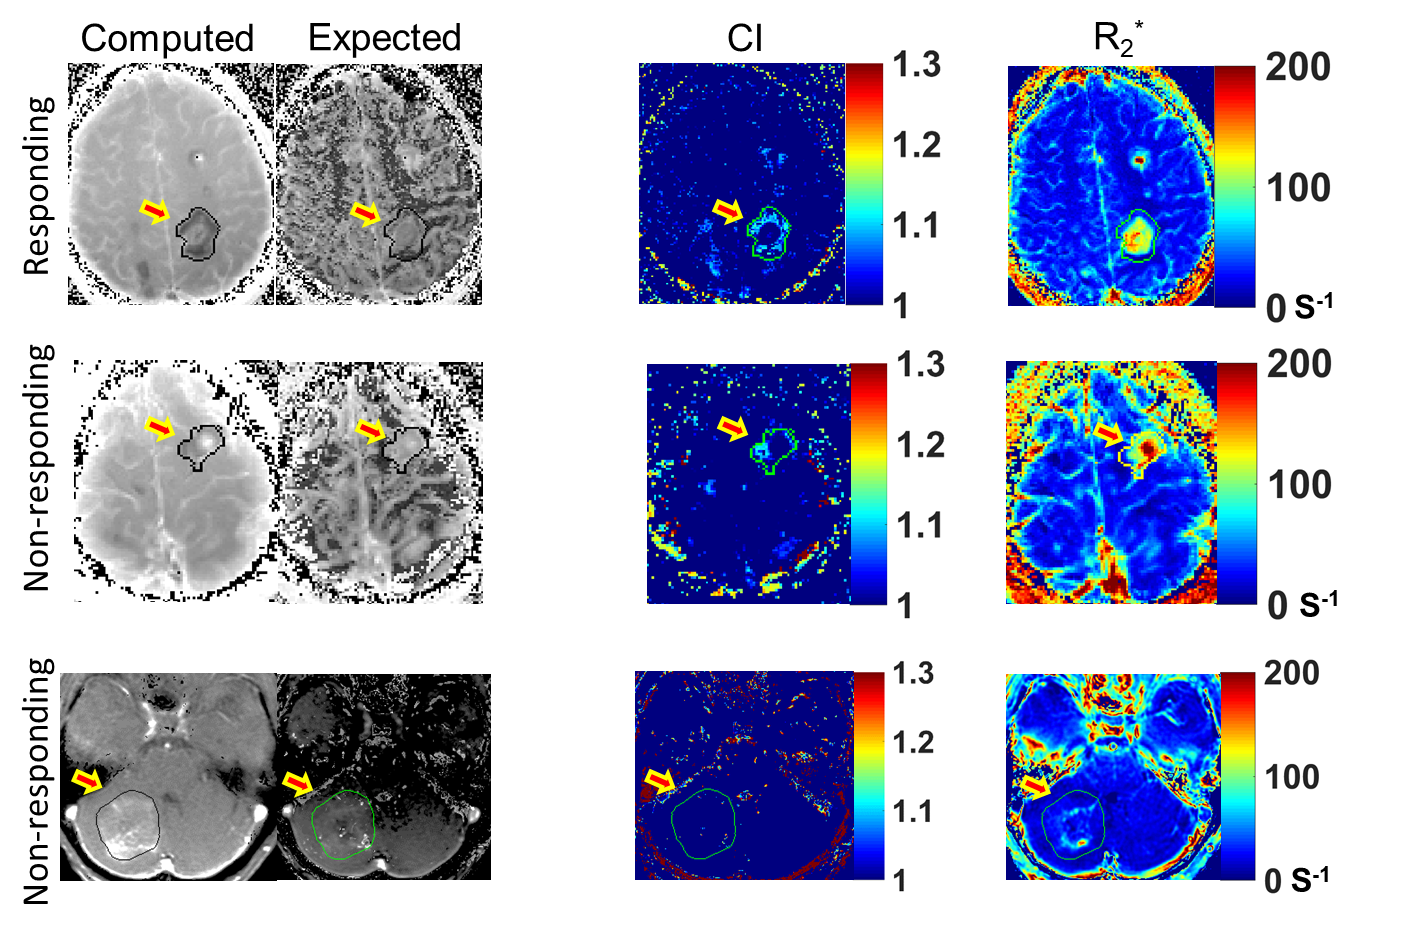
Figure 3 illustrates the computed and expected $$$R_1$$$ weighted maps, CI, and $$$R_2^*$$$ maps for three example tumors (rows). Qualitatively, on the CI maps, the responding tumor (top row) had a higher distribution of $$$FCIGT1$$$ voxels than a tumor that initially responded but re-grew (middle row) and a progressing tumor (middle row), and these differences were less obvious on $$$R_2^*$$$ maps. The ROC curves for the 3 putative discriminators are plotted in Figure 4, and corresponding AUROC values are tabulated in Table 1. The CI metrics provided good discrimination of RT vs. NRT tumors with RT tumors having higher pre-treatment values of $$$(FCIGT1R_{2,90}^*)$$$ than NRT tumors. AUROC of $$$FCIGT1$$$, and $$$(FCIGT1R_{2,90}^*)$$$ 0.75 and 0.86 respectively. $$$(FCIGT1R_{2,90}^*)$$$ had good accuracy on both training (84%) and LOOCV (79%).Conclusion:
$$$R_1$$$ and $$$R_2^*$$$ mismatch on MRI acquired 24 h post-FMX, measured in terms of CI greater than 1 and hypothesized to be indicative of FMX intracellular compartmentation, was predictive of the response of breast cancer brain metastases to nal-IRI at the individual tumor level. In particular, the metric FCIGT1 is highly predictive of response in both training and LOOCV.Acknowledgements
No acknowledgement found.References
1 Sachdev, J. C. et al. Phase I study of liposomal irinotecan in patients with metastatic breast cancer: findings from the expansion phase. Breast Cancer Res Treat, doi:10.1007/s10549-020-05995-7 (2020).
2 Golombek, S. K. et al. Tumor targeting via EPR: Strategies to enhance patient responses. Adv Drug Deliv Rev 130, 17-38, doi:10.1016/j.addr.2018.07.007 (2018).
3 Kordbacheh, H. et al. Pictorial review on abdominal applications of ferumoxytol in MR imaging. Abdom Radiol (NY) 44, 3273-3284, doi:10.1007/s00261-019-02163-4 (2019).
4 Dousset, V. et al. Comparison of ultrasmall particles of iron oxide (USPIO)-enhanced T2-weighted, conventional T2-weighted, and gadolinium-enhanced T1-weighted MR images in rats with experimental autoimmune encephalomyelitis. AJNR Am J Neuroradiol 20, 223-227 (1999).
5 Ramanathan, R. K. et al. Correlation between Ferumoxytol Uptake in Tumor Lesions by MRI and Response to Nanoliposomal Irinotecan in Patients with Advanced Solid Tumors: A Pilot Study. Clinical Cancer Research 23, 3638-3648, doi:10.1158/1078-0432.Ccr-16-1990 (2017).
6 Iv, M. et al. Quantification of Macrophages in High-Grade Gliomas by Using Ferumoxytol-enhanced MRI: A Pilot Study. Radiology 290, 198-206, doi:10.1148/radiol.2018181204 (2019).
7 Aghighi, M. et al. Magnetic Resonance Imaging of Tumor-Associated Macrophages: Clinical Translation. Clinical cancer research : an official journal of the American Association for Cancer Research 24, 4110-4118, doi:10.1158/1078-0432.Ccr-18-0673 (2018).
8 Brisset, J. C. et al. Quantitative effects of cell internalization of two types of ultrasmall superparamagnetic iron oxide nanoparticles at 4.7 T and 7 T. European radiology 20, 275-285, doi:10.1007/s00330-009-1572-6 (2010).
9 Ruchalski, K. et al. A Primer on RECIST 1.1 for Oncologic Imaging in Clinical Drug Trials. Radiol Imaging Cancer 3, e210008, doi:10.1148/rycan.2021210008 (2021).
Figures