3418
Pre-Therapy Ferumoxytol-Enhanced Magnetic Resonance Imaging (MRI) Predicts Response of Metastatic Breast Cancer to Liposomal Irinotecan1Department of Cancer Physiology, Moffitt Cancer Center and Research Institute, Tampa,, FL, United States, 2Department of Radiology, Moffitt Cancer Center and Research Institute, Tampa,, FL, United States, 3Department of Breast Oncology, Moffitt Cancer Center and Research Institute, Tampa,, FL, United States, 4Ipsen Bioscience, Cambridge, MA, United States, 5HonorHealth Research Institute, Scottsdale, AZ, United States, 6Imaging Endpoints Core Lab, Scottsdale, AZ, United States, 7Department of Oncologic Sciences, University of South Florida, Tampa,, FL, United States
Synopsis
R*2 and the apparent concentration of FMX in the tumor (FMXC) are considered biomarkers of liposomal irinotecan (nal-IRI) drug uptake into that tumor lesion, which in turn would determine response of that tumor to nal-IRI. Historically, quantification of R*2 and FMXC had been implemented by using a calibration phantom and acquiring patient scans both pre-FMX and post-FMX. Here we have demonstrated a pre-treatment FMX-enhanced MRI companion biomarker of response to nal-IRI in mBC patients that can be computed from a single16-24 h post-FMX MRI scan without the need for calibration phantoms or pre-FMX scans.
Introduction:
Despite continued improvements in available treatments, the 5-year survival rate of metastatic breast cancer (mBC) remains low at 27%1. Irinotecan (IRI) is a topoisomerase I inhibitor used as a salvage treatment in heavily-pretreated mBC patients due to reduced risk of cross-tolerance with other drugs2. Liposomal formulation of irinotecan (nal-IRI) is used to increase tumor exposure to IRI, and its anti-tumor mechanism of action may be dependent on the presence and activity of tumor-associated macrophages (TAMs)3.MRI studies using ferumoxytol (FMX) have demonstrated the co-localization of FMX and TAMs in tumors, and tumor $$$R_2^*$$$ measured post-FMX injection has been shown to correlate with TAM content4-8. Our study hypothesis is that $$$R_2^*$$$ and the apparent concentration of FMX $$$(FMX_C)$$$ in the tumor capture lesion permeability characteristics for nanoparticles and specifically measure of FMX deposition in each tumor; these parameters may therefore be biomarkers of nal-IRI uptake into that tumor lesion, which in turn would determine response of that tumor to nal-IRI. In a phase I expansion study of mBC patients treated with nal-IRI (NCT01770353), we have investigated tumor $$$R_2^*$$$ and $$$FMX_C$$$ as pretreatment predictors of tumor response to nal-IRI. We describe here an alternative MRI signal analysis approach yielding a companion pre-therapy predictor of mBC tumor response to nal-IRI that is computed from tumor $$$R_2^*$$$ normalized to spleen $$$R_2^*$$$ measured solely by MRI 16-24 h post-administration of ferumoxytol.
Methods and Materials:
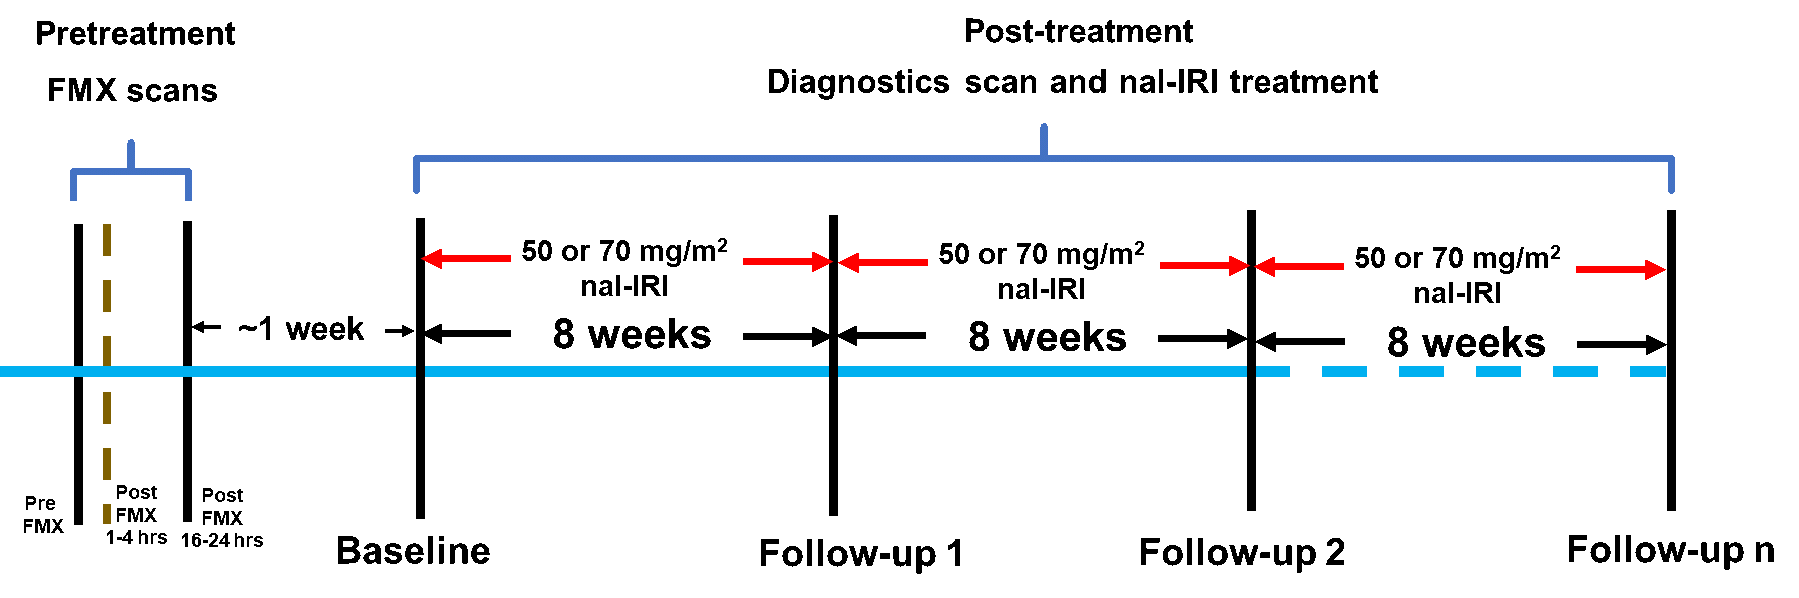
The study schema is shown in Figure 1. A series of 6 FSPGR scans were acquired at 1.5 T using the following parameters: TE = 1.5, 3.0, 4.5, 6.0, 9.0, and 13.2 milliseconds, slice thickness/slice gap = 6/1 mm, and matrix size = 256 X 256 with a field-of-view to match the size of the patient along with phantom tubes containing known concentrations of FMX.Image analysis:
$$$R^*_2$$$ and $$$FMX_C$$$ are calculated as follows:
$$$logs\;=\;logS_0 -TE*R_2^*\;[1] $$$
$$$R^*_{2,tube}\;=\;R^*_{2,tube,0}+[c] * r^*_{2,FMX}\;[2]$$$
$$$FMX_c\;=\;\frac{R^*_{2,\; post-FMX}-R^*_{2,tube,0}}{r^*_{2,FMX}}\;[3] $$$
Where S and S0 signal at TE≠0 and TE=0 respectively. $$$\;R^*_2\;$$$, $$$\;R^*_{2,tube}\;$$$, and $$$\;R^*_{2,tube,0}\;$$$ are transverse relaxation rates of tissue, phantom tube with and without FMX. $$$\;[c]\;$$$ and $$$\;r^*_{2,FMX}\;$$$ is FMX concentration and transverse relaxivity.
Tumor $$$\;R^*_2\;$$$ was normalized to the mean $$$\;R^*_2\;$$$ in spleen $$$\;(rR^*_2)\;$$$. Tumor histogram metrics $$$\;rR^*_{2,N}(rFMX_{C,N})\;$$$ given as average of $$$\;rR^*_{2}(rFMX_{C})$$$ voxel values above the Nth percentile were investigated as tumor response predictors.
Coefficient of variation (COV) and reproducibility index across was calculated for each percentile (N) as follows:
$$$Ratio_{j,N} = \frac{tumor\;rR^*_{2,N}\;for\;ROI_j}{tumor\;rR^*_{2,N}\;for\;ROI} \; [4] $$$
where j = Erosion or Dilation operation and N=81,82,83,...99
$$$COV_{j,N} = \frac {standard\;deviation\;of\;Ratio_{j,N}\;across\;all\;the\;tumors}{mean\;of\;Ratio_{j,N} \;across\;all\;the\;tumors}\;[5]$$$
$$$COV_{Index,N}\;=\;COV_{erosion,N}+COV_{dilation,N}\;[6]$$$
$$$Reproducibility_{Index,N}=\frac{1}{COV_{Index,N}}\;[7]$$$
Imaging data from a total of 49 tumors in 19 patients were analyzed. A tumor was labeled ‘responding tumor’ (RT) if it exhibited partial response (PR; diameter decrease less than 30 %9), and labeled ‘non-responding tumor’ (NRT) otherwise. Area-under-the-receiver-operating-curve (AUROC) was used both to choose optimal histogram metrics and evaluate the performance of the metrics. Leave-one-out-cross-validation (LOOCV) was performed.
Results and Discussion:
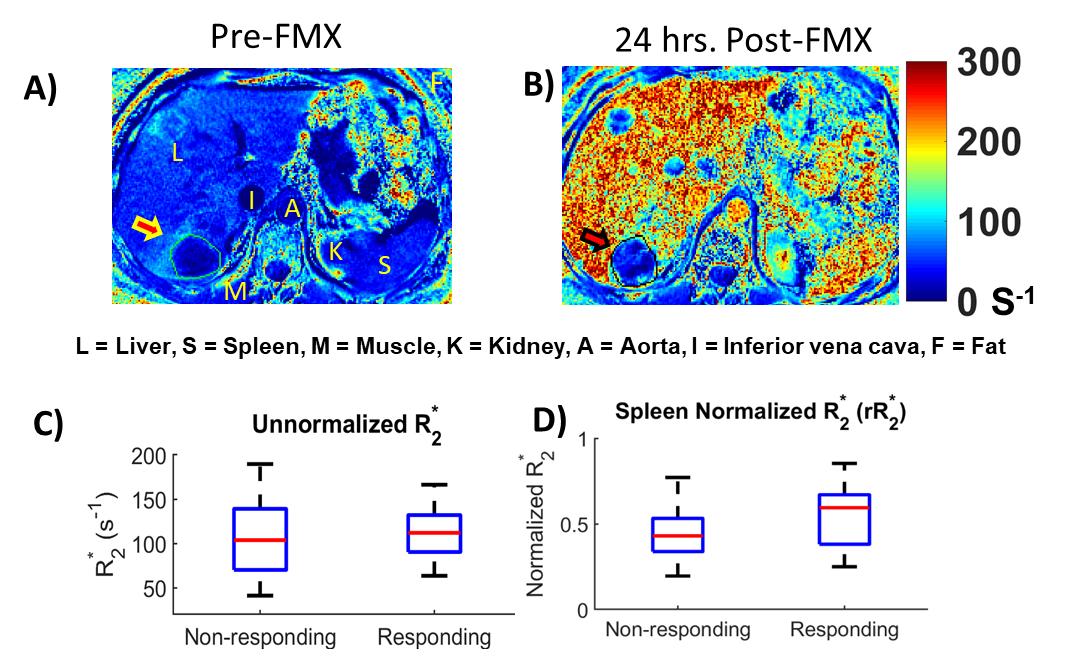
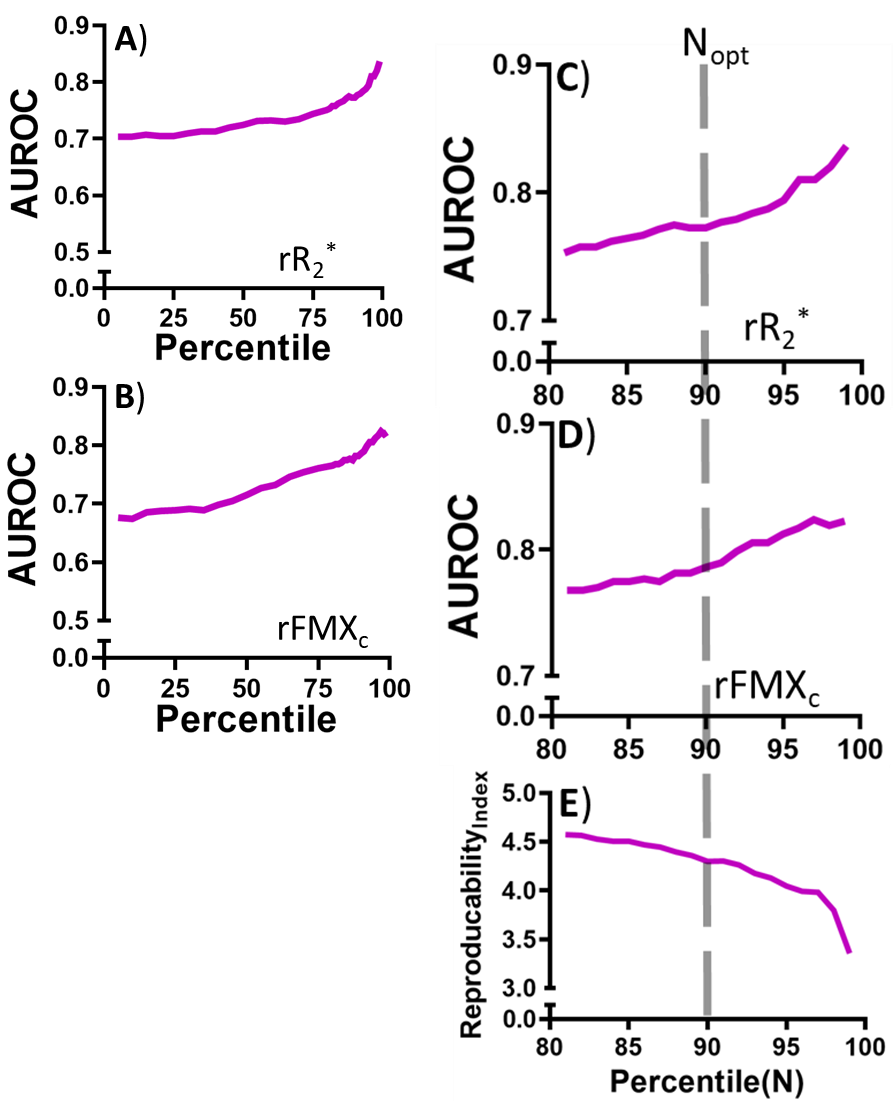
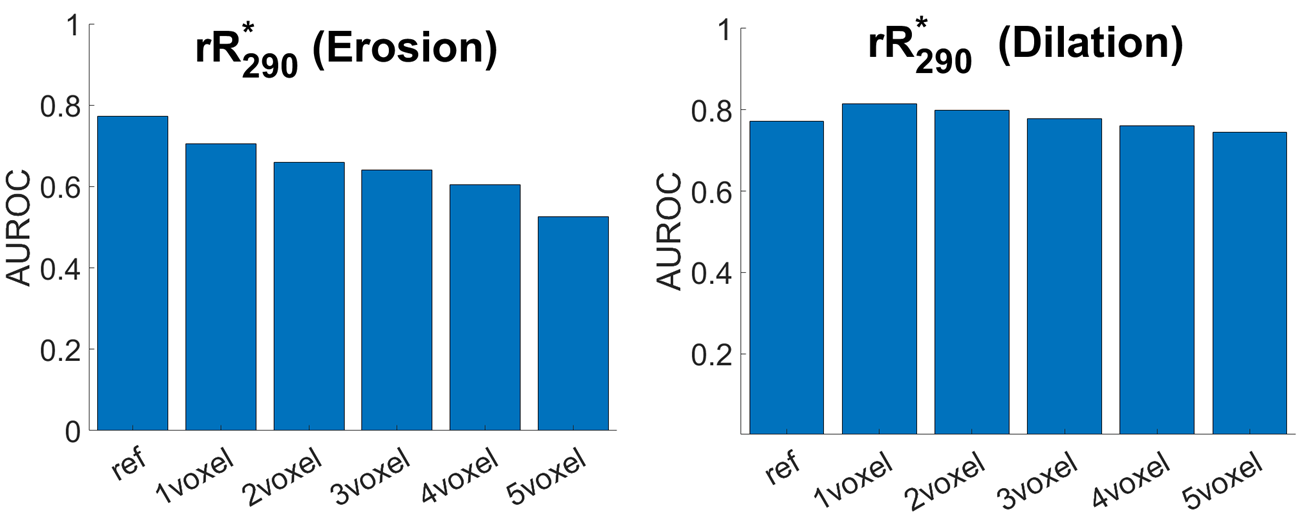
Figures 2A and 2B depict $$$\;R^*_2\;$$$ maps computed pre-FMX and 24 h post-FMX in an example patient with liver metastases. Qualitatively, a significant increase in $$$\;R^*_2\;$$$ can be observed in organs of the mononuclear phagocyte system (MPS; liver and spleen), in blood vessels, and in highly vascular tissues. Tumor $$$\;R^*_2\;$$$ is also seen to be heterogeneously higher post-FMX relative to pre-FMX. Whole tumor $$$\;rR^*_2\;$$$ had a higher predictive power for distinguishing between RT and NRT compared to $$$\;R^*_2\;$$$ (Figure 2C and 2D). Although all patients received a fixed dose, normalization will compensate for small patient-to-patient differences in FMX pharmacokinetics due to differences in blood volume10 and activity of the mononuclear phagocyte system11, resulting in higher predictive power. AUROC of $$$\;rR^*_2\;$$$ (Figure 3C) and $$$\;rFMX_{C}\;$$$ (Figure 3D) indicate that discriminator performance increases as the percentile threshold (N) increases. However, although a high $$$\;Reproducibility_{Index}\;$$$ with respect to ROI dilation and erosion was preferable, $$$\;Reproducibility_{Index}\;$$$ decreased indicating decreased robustness of the discriminator performance with increasing N (Figure 3E). An optimal threshold percentile ($$$\; N_{opt}\;$$$) was selected that provides good discriminator performance for $$$\;rR^*_2\;$$$ (C) and $$$\;rFMX_{C}\;$$$ (D) AUROC, and good $$$\;Reproducibility_{Index}\;$$$ (E). Analysis of the effects of ROI dilation and shrinkage on the predictive power of $$$\;rR^*_{2,90}\;$$$ and $$$\;rFMX_{C,90}\;$$$ indicates that erring on the side of including more peritumoral tissue within the ROI may yield more robust tumor response assessment by FMX-MRI (Figure 4). This may reflect the fact that most of the FMX nanoparticles are deposited in the tumor periphery. For the task of discriminating between RT and NRT, the AUROC of $$$\;rR^*_{2,90}\;$$$ was 0.77 and of $$$\;rFMX_{C,90}\;$$$ was 0.79 (Table 1). The optimal value of $$$\;rR^*_{2,90}\;$$$ was 1.07, and that of $$$\;rFMX_{C,90}\;$$$ was 1.09 (Table 1), based on the distance-to-corner criterion. For these optimum thresholds, the training accuracy of both discriminators was 76%, and LOOCV accuracy of both discriminators was 74% (Table 1).Conclusion:
Historically, quantification of FMX uptake into tissue had been implemented by using a calibration phantom and acquiring patient scans both pre-FMX and post-FMX. Here we have demonstrated a pre-treatment FMX-enhanced MRI biomarker of response to nal-IRI in mBC patients that can be computed from a single16-24 h post-FMX MRI scan without the need for calibration phantoms or pre-FMX scans.Acknowledgements
No acknowledgement found.References
1 Sachdev, J. C. et al. Phase I study of liposomal irinotecan in patients with metastatic breast cancer: findings from the expansion phase. Breast Cancer Res Treat, doi:10.1007/s10549-020-05995-7 (2020).
2 Shigeoka, Y. et al. Clinical effect of irinotecan in advanced and metastatic breast cancer patients previously treated with doxorubicin- and docetaxel-containing regimens. Jpn J Clin Oncol 31, 370-374, doi:10.1093/jjco/hye082 (2001).
3 Golombek, S. K. et al. Tumor targeting via EPR: Strategies to enhance patient responses. Adv Drug Deliv Rev 130, 17-38, doi:10.1016/j.addr.2018.07.007 (2018).
4 Aghighi, M. et al. Magnetic Resonance Imaging of Tumor-Associated Macrophages: Clinical Translation. Clinical cancer research : an official journal of the American Association for Cancer Research 24, 4110-4118, doi:10.1158/1078-0432.Ccr-18-0673 (2018).
5 Iv, M. et al. Quantification of Macrophages in High-Grade Gliomas by Using Ferumoxytol-enhanced MRI: A Pilot Study. Radiology 290, 198-206, doi:10.1148/radiol.2018181204 (2019).
6 Ramanathan, R. K. et al. Correlation between Ferumoxytol Uptake in Tumor Lesions by MRI and Response to Nanoliposomal Irinotecan in Patients with Advanced Solid Tumors: A Pilot Study. Clinical Cancer Research 23, 3638-3648, doi:10.1158/1078-0432.Ccr-16-1990 (2017).
7 Kalra, A. V. et al. Magnetic resonance imaging with an iron oxide nanoparticle demonstrates the preclinical feasibility of predicting intratumoral uptake and activity of MM-398, a nanoliposomal irinotecan (nal-IRI). Cancer Res 74, doi:10.1158/1538-7445.Am2014-2065 (2014).
8 Miller, M. A. et al. Predicting therapeutic nanomedicine efficacy using a companion magnetic resonance imaging nanoparticle. Science translational medicine 7, 314ra183, doi:10.1126/scitranslmed.aac6522 (2015).
9 Ruchalski, K. et al. A Primer on RECIST 1.1 for Oncologic Imaging in Clinical Drug Trials. Radiol Imaging Cancer 3, e210008, doi:10.1148/rycan.2021210008 (2021).
10 Nadler, S. B., Hidalgo, J. H. & Bloch, T. Prediction of blood volume in normal human adults. Surgery 51, 224-232 (1962).
11 Tavares, A. J. et al. Effect of removing Kupffer cells on nanoparticle tumor delivery. Proc Natl Acad Sci U S A 114, E10871-E10880, doi:10.1073/pnas.1713390114 (2017).
Figures