3417
Comparison between machine learning and radiologists’ readings for prediction of chemoradiation therapy response in rectal cancer using MRI
Yang Zhang1,2, Liming Shi3, Weiwen Zhou3, Xiaonan Sun3, Salma Jabbour1, Ning Yue1, Min-Ying Su2, and Ke Nie1
1Department of Radiation Oncology, Rutgers-Cancer Institute of New Jersey, Rutgers-Robert Wood Johnson Medical School, New Brunswick, NJ, United States, 2Department of Radiological Sciences, University of California, Irvine, CA, United States, 3Department of Radiation Oncology, Sir Run Run Shaw Hospital, Zhejiang University School of Medicine, Hangzhou, China
1Department of Radiation Oncology, Rutgers-Cancer Institute of New Jersey, Rutgers-Robert Wood Johnson Medical School, New Brunswick, NJ, United States, 2Department of Radiological Sciences, University of California, Irvine, CA, United States, 3Department of Radiation Oncology, Sir Run Run Shaw Hospital, Zhejiang University School of Medicine, Hangzhou, China
Synopsis
A radiomics model with pre-treatment MRI for pCR prediction and compared with two oncologists’ readings. Their performance with and without the model assistances was cross-compared to see the potential role of radiomics model in assisting clinical decision. A total of 203 patients receiving neoadjuvant CRT followed by total mesorectal excision (TME) were enrolled. For training set, AUC from radiomics model is 0.85 and AUC from clinical model is 0.74. For testing set, AUC from radiomics model is 0.82 and AUC from clinical model is 0.69. For oncologist’s reading, with the assistance of radiomics model, positive prediction value (PPV) and specificity increased significantly for both experienced and inexperienced oncologist.
Introduction
The standard-of-care treatment for locally advanced rectal cancer (LARC) is neoadjuvant chemoradiotherapy (nCRT) followed by total mesorectal excision (TME). Following CRT, around 15% to 27% of patients can achieve pathologic complete response (pCR). For those received pCR, people have questioned the use of TME due to complication of the morbidity and no significant approvement for clinical outcome. Organ preservation strategy as wait-and-watch or trans-nasal endoscopic microsurgery has been proposed. However, currently there is no well recognized and reliable method for pCR prediction, and a new technique is needed for supporting the organ-preserving strategy. Radiomics offers a powerful tool for extraction of clinically relevant information from radiologic imaging. Some recent studies have supported the role of radiomics in LARC restaging with the goal of providing an additional imaging biomarker, allowing for the correct management of LARC patients. However, the intuitive understanding of the “black box” natural of the radiomics features and how to use it guide clinical decision is yet to be achieved. Following the rapid developments and popularity of machine learning approach, the field took the focus toward an increase in predictive power and further away from an inherent understanding of the finding. Such a disconnect between predictor model and radiological/biological meaning inherently limited the clinical translation of research radiomics model. So in this study, we built a radiomics model with pre-treatment MRI for pCR prediction and compared with two oncologists readings. Their performance with and without the model assistances was cross-compared to see the potential role of radiomics model in assisting clinical decision. Moreover, after reviewing the omics score, the detail interpretation of selected radiomics features were reviewed by experienced oncologists to further build the connection of predictor model and the radiological meaning for gaining the transition of this research radiomics tool into real clinical decision making.Methods
The institutional review board approved our prospective study. A total of 220 consecutive LARC patients who underwent nCRT followed by TME were included. The patient cohort has been separated into 143 training and 77 testing cases. MRI was performed on 3T, using a multi-parametric protocol including T1, T2, DWI, and DCE using the LAVA sequence with 4 frames. Figure 1 shows two examples with all image sequences. All patients received standard concurrent chemo-radiation with 50 Gy delivered for 25 fractions. Patients also received capecitabine 825 mg/m2 orally, twice daily for 5 consecutive weeks and oxaliplatin 110 mg/m2 once every 3 weeks. After a recovery period of two weeks (6-8 weeks after completing radiation), TME was performed. Following surgery, the specimen was examined by an experienced gastrointestinal pathologist using the modified tumor regression grade (TRG): TRG-0 (pCR, no viable cancer cells), TRG1 (only a small cluster or isolated cancer cells remaining), and TRG 2 & 3 (with extensive residual cancer). The tumor region of interest (ROI) was manually outlined by an experienced oncologist on all image sequences. The radiomics analysis was performed using 107 imaging features including 14 shape, 18 first-order, 24 gray-level co-occurrence matrix (GLCM), 14 gray-level dependence matrix (GLDM), 16 gray-level run length matrix (GLRLM), 16 gray-level size zone matrix (GLSZM), and 5 neighboring gray tone difference matrix (NGTDM) features, For each case, a total of 428 parameters were calculated. The feature selection was done using SVM (support vector machine), with 10-fold cross-validation. After a final model was developed and , the overall classification performance was evaluated using receiver operating characteristic (ROC) analysis in the training and testing dataset. The clinical data, including T-stages and N-stages, were also utilized to establish the prediction models. The whole radiomics prediction process was shown in Figure 2. The testing dataset were read independently by two radiologists with different experience levels (12 years and 3 years respectively). They gave their assessment of treatment response for each patient twice with a month apart. Additionally, the readings with and without the radiomics model assistance were also compared.Results
The analysis was done to differentiate pCR (TRG 0) vs. non-pCR (TRG 1+2+3). Table 1 shows the prediction results from training and validation datasets. For training set, AUC from radiomics model is 0.85 and AUC from clinical model is 0.74. For testing set, AUC from radiomics model is 0.82 and AUC from clinical model is 0.69. For oncologist’s reading, with the assistance of radiomics model, positive prediction value (PPV) and specificity increased significantly for both experienced and inexperienced oncologist.For feature selection, there are a total of 14 features selected to build the final predication model. Figure 2 shows the waterfall plot of the feature weights. 8 of 14 selected features were from DCE, 3 features from ADC and 3 features from T2. Most of the selected features are texture features, including 3 from GLCM, 3 from GLRLM, 3 from GLDM and 2 from NGTDM. Fig 3 showed an example of selected features as GLRLM-LRLGLE, which showed the enhancement rate of DCE. It appears that patients who are likely to receive pCR showed higher value in GLRLM-LRLGLE compared to non-pCR. Another example showed one of the selected features as GLDM-GLV, which showed heterogeneity about ADC map on Fig. 4. The pCR patients tend to have more heterogeneous ADC map than non-pCR patients.Discussion
We have built a radiomics model with pre-treatment MRI for pCR prediction of LARC patients underwent nCRT and compared with two oncologists readings. The model itself outperformed than experienced oncologist in assessing the response. Additionally, with the assistance the radiomics model, both oncologists could achieve similar level of confidence in predicting the treatment outcome. Moreover, understanding the radiological meaning of the selected predictor might further allow the transition of radiomics model into real clinical decision making.Acknowledgements
This study was supported in part by NIH R01 CA127927, the Rutgers Cancer Institute of New Jersey (No. P30 CA072720), Chinese National Natural ScienceFoundation (No. 81441086, 81672976), Natural Science Foundation of Zhejiang Province (No. LY14H160016), Major Science and Technology Program ofZhejiang Province (No. 2013C03044-6).References
[1] Borschitz et al. Neoadjuvant chemoradiation and local excision for t2-3 rectal cancer. Annals of surgical oncology 2008;15:712-720. [2] Marijnen CA. Organ preservation in rectal cancer: Have all questions been answered? The lancet oncology 2015;16:e13-e22. [3] Renehan et al. Watch-and-wait approach versus surgical resection after chemoradiotherapy for patients with rectal cancer (the oncore project): A propensity-score matched cohort analysis. The LancetOncology 2016;17:174-183. [4] Ludwig KA. Sphincter-sparing resection for rectal cancer. Clinics in colon and rectal surgery 2007;20:203. [5] Zhang et al. Machine Learning for Prediction of Chemoradiation Therapy Response in Patients with Locally-Advanced Rectal Cancer (LARC) Using Pre- and Early-Treatment Follow-up Multiparametric MRI. Presented at the Joint Annual Meeting ISMRM-ESMRMB, Paris, France, June 16-21, 2018; Program Number: 829.Figures

Figure 1: Flowchart of the radiomics analysis process
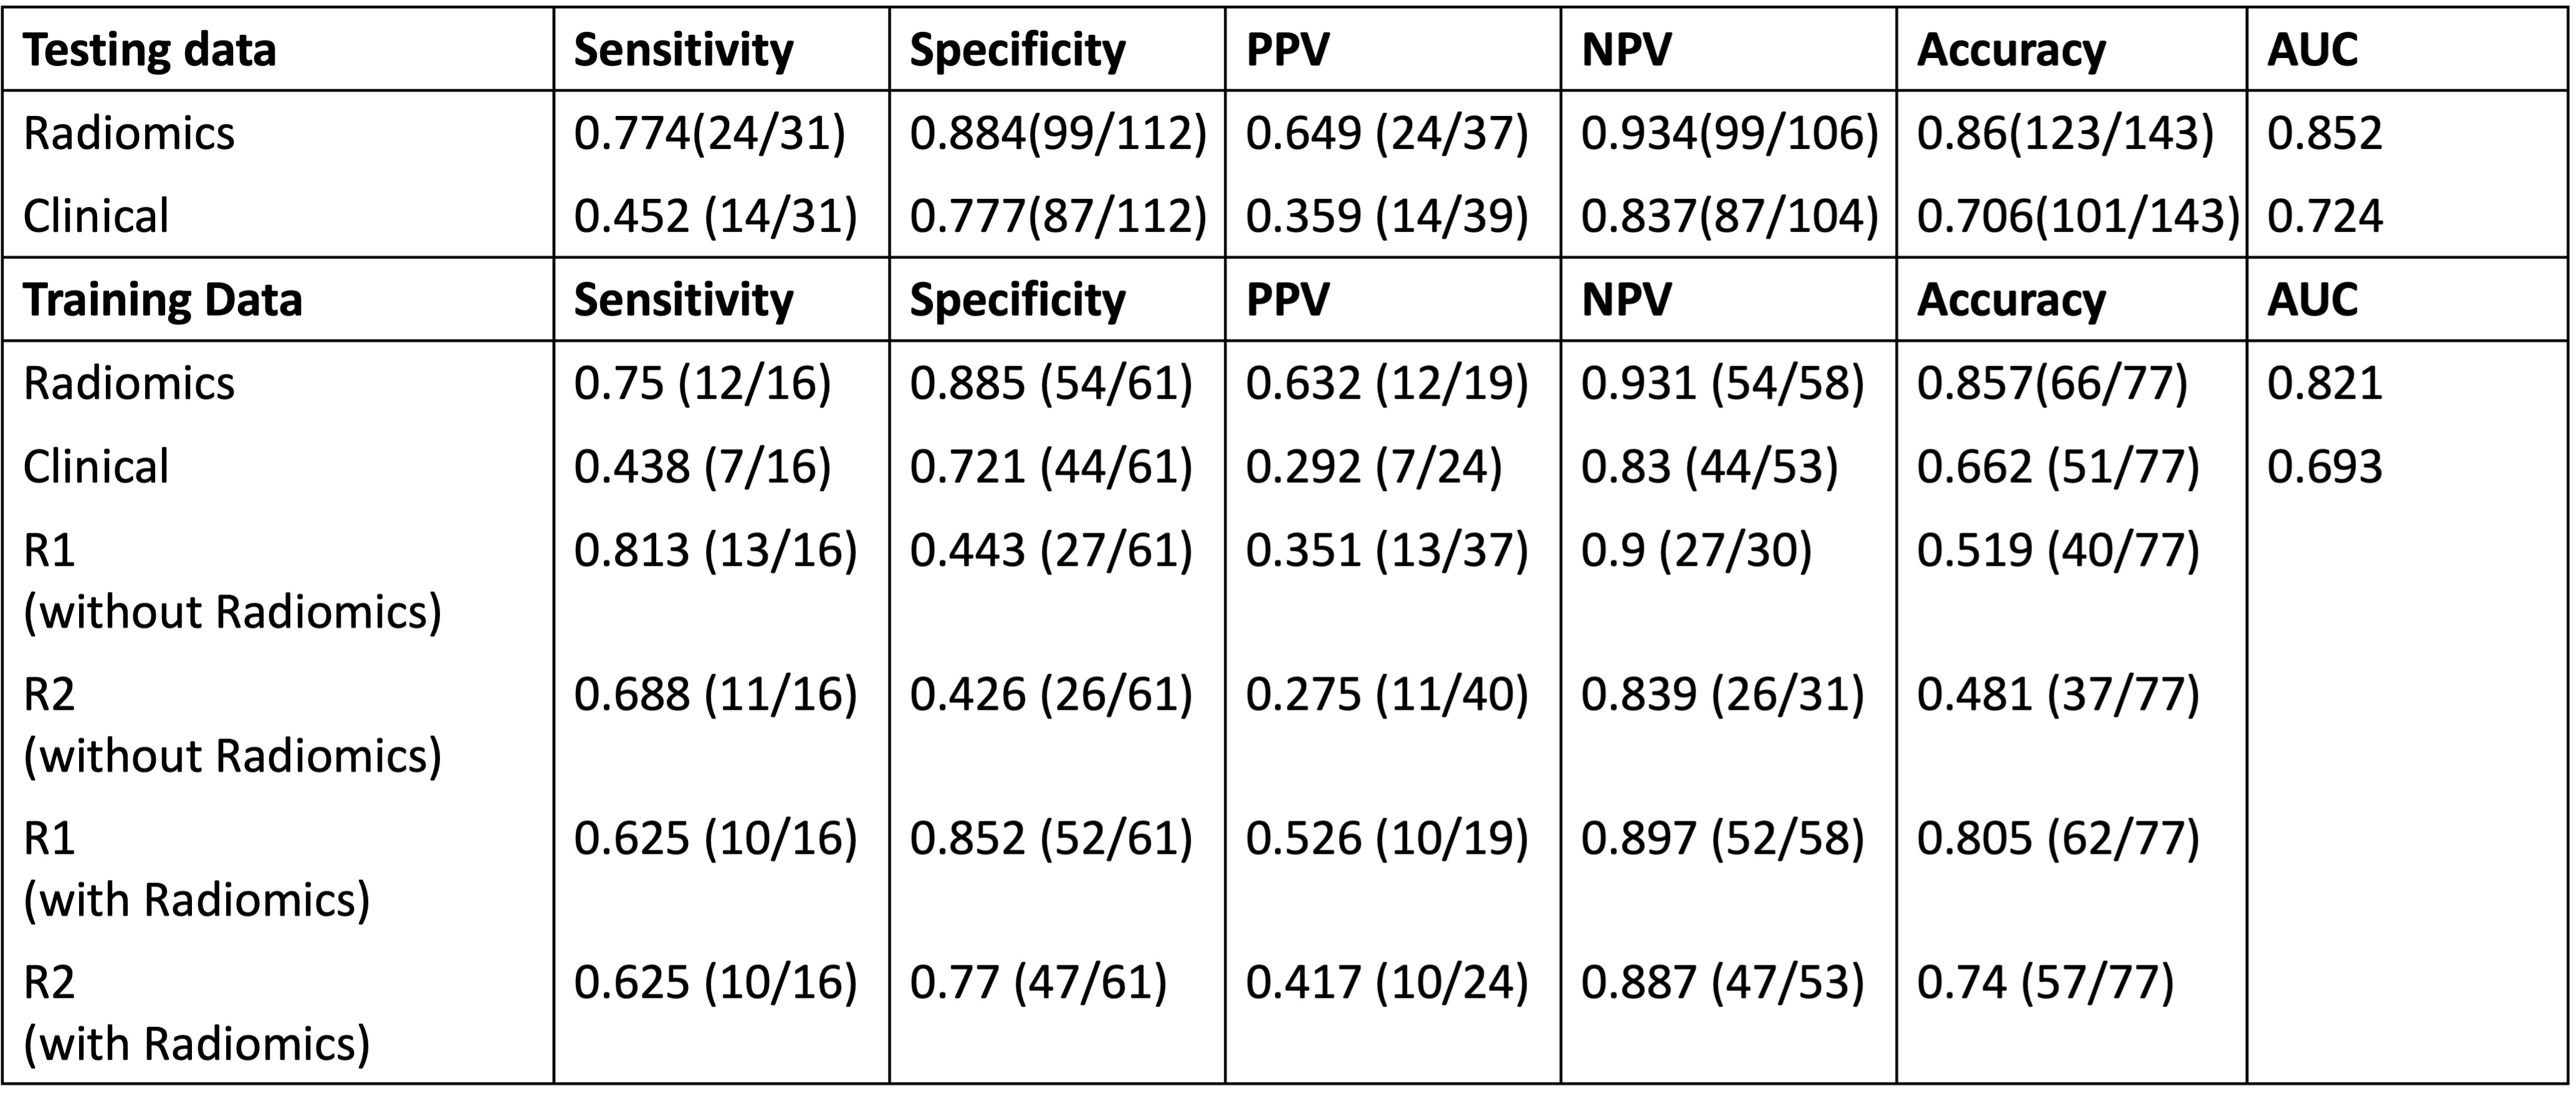
Table 1: Analysis Results from radiomics and clinical data, then compared with 2 radiologists’ reading based on training and testing dataset.

Figure 2: Waterfall plot for the feature weighting when building the model. Based on the feature selection algorithm, there were 14 features selected.

Figure 3:
Example
of
MR
images
of
LARC
pateints.
(Top):
MR images of a 41-year-old
patient
with low-rectum cancer at stage of cT3N+M0 taken pre-treatment.
(A)
L3
post-contrast image taken at 30 s
after injection. (B) the diffusion-weighted image with
b = 800 s/mm2 , This
patient did not achieve
pCR and GLDM-GLV is 0.562.
(Top): MR images of a 70-year-old patient with low-rectum cancer at stage
of cT2N+M0 taken pre-treatment. (A) L3 post-contrast image taken at 30 s after injection. (B) the diffusion-weighted image
with b = 800 s/mm2 , This patient achieved and GLDM-GLV is 0.181.

Figure 4:
Example
of
MR
images
of
LARC
pateints.
(Top):
MR images of a 53-year-old
patient
with low-rectum cancer at stage of
cT3N+M0 taken pre-treatment. (A)
L3
post-contrast image taken at 30 s
after injection. (B) the diffusion-weighted image with
b = 800 s/mm2 , This
patient did not achieve
pCR and GLRLM-LRLGLE
is 0.731.(Bottom): MR images of a 61-year-old patient with low-rectum cancer at stage
of cT2N+M0 taken pre-treatment. (A) L3 post-contrast image taken at 30 s after injection. (B) the diffusion-weighted image
with b = 800 s/mm2 , This patient achieved pCR and GLRLM-LRLGLE is 0.523.
DOI: https://doi.org/10.58530/2022/3417