3415
Weekly Apparent Diffusion Coefficient Kinetics in HPV-positive Oropharyngeal Cancer Patients Undergoing Definitive Radiation Therapy
Brigid McDonald1, Renjie He1, Yao Ding2, Travis Salzillo2, Jihong Wang2, Clifton Fuller2, and Abdallah Mohamed2
1Radiation Oncology, UT MD Anderson Cancer Center, Houston, TX, United States, 2UT MD Anderson Cancer Center, Houston, TX, United States
1Radiation Oncology, UT MD Anderson Cancer Center, Houston, TX, United States, 2UT MD Anderson Cancer Center, Houston, TX, United States
Synopsis
In this study, we investigate weekly changes in mean and median apparent diffusion coefficient (ADC) values from diffusion-weighted MRI for HPV+ oropharyngeal cancer patients undergoing definitive radiation therapy (RT). Trends of increasing ADC values in GTV_P and GTV_N were observed with clear separation at each time point between patients with no evidence of disease vs. recurrence at 2 months post-RT. Because of our small sample size (15), a larger cohort is needed for more robust outcome prediction analysis.
Introduction
Diffusion-weighted magnetic resonance imaging (DW-MRI) is a quantitative MRI technique that measures the diffusion of water throughout a tissue. Its associated quantitative imaging biomarker, the apparent diffusion coefficient (ADC), has been shown in recent studies as a potential imaging biomarker for predicting response to radiation therapy (RT) in head and neck cancers. However, most studies have only looked at differences between pre-RT and a single mid-RT time point, leaving the overall ADC kinetics unknown. In this study, we analyze weekly DW-MRI images throughout RT for human papillomavirus-positive (HPV+) oropharyngeal cancer patients and investigate ADC and volumetric changes in both primary tumors and lymph nodes.Methods
15 HPV+ oropharyngeal cancer patients treated with definitive RT (70 Gy; 33 fractions) were included in this study (clinical demographics in Table 1). All patients provided written informed consent to participate in this IRB-approved study (NCT03224000; institutional IRB identifier: 2015-0851). Patients were imaged at baseline and weekly during RT on a 1.5T MR-sim (Siemens Aera) with fat-suppressed T2-weighted turbo spin echo and DW-MRI (12 imaged with BLADE, 3 with RESOLVE). Sequence parameters (TR/TE (ms); pixel size/slice thickness (mm); b-values (s/mm2)): T2-weighted (5280/80; 0.5/2; N/A), BLADE (5900/50; 2/4; 0 & 800), RESOLVE (9380/63; 2/4; 0 & 800). A total of 15 primary gross tumor volumes (GTV_P) and 14 nodal gross tumor volumes (GTV_N) were analyzed (14 nodes across 12 patients). The number of structures omitted from analysis due to missing images, artifacts, or complete response (CR) of a structure were 0, 2, 0, 1, 4, 4, 12 for baseline and weeks 1-6, respectively, for GTV_P and 0, 2, 1, 1, 0, 2, 6 for GTV_N. Differences in mean and median ADC values between BLADE and RESOLVE were assessed at each time point with the Kolmogorov–Smirnov test (α=0.05 for all statistical tests). The Kruskal-Wallis test was performed to detect significant changes across all time points for mean and median ADC and volume for GTV_P and GTV_N. Percent changes (%Δ) from baseline were calculated for the same quantities. To test whether any of the studied quantities (weekly absolute values and %Δ values) could predict response at 2-months post-RT, the Mann-Whitney test was performed for the quantities at each week. The relationship between %Δvolume and %ΔADC (mean and median) was assessed for each week using linear regression and Spearman’s correlation.Results
Mean and median ADC values for BLADE vs. RESOLVE were not significantly different at any time point except baseline (p=0.0285 for mean, p=0.0171 for median). Kruskal-Wallis analysis revealed significant differences across time points for GTV_P mean (p<0.0001), median (p<0.0001), and volume (p<0.0001) and GTV_N median (p=0.0439) but no significant difference for GTV_N mean (p=0.0534) and volume (p=0.1161). None of the studied parameters (mean, median, volume, and %Δ values) showed a significant difference between responders and non-responders at 2-months post-RT. However, visual inspection of the data (Figure 1) showed higher overall mean and median ADC for responders compared to non-responders for both GTV_P and GTV_N. Responders also showed higher overall GTV_P volumes but lower overall GTV_N volumes compared to non-responders. %Δmean and %Δvolume kinetics for individual patients are shown in Figure 2. Linear correlations were nonexistent or very weak for %Δvolume vs. %Δmean and %Δvolume vs. %Δmedian at each week for GTV_P and GTV_N (maximum r2=0.36). None of the pairs had a significant Spearman correlation except GTV_N week 3 %Δvolume vs. %Δmean (p=0.0438) and vs. %Δmedian (0.0325).Discussion
Our data supports trends seen in the literature that ADC values increase as a tumor responds to RT due to the RT-induced breakdown of cellular membranes. Although Figure 1 shows consistently higher ADC values at each time point for responders compared to non-responders, these differences were not significantly different in the Mann-Whitney test, which is most likely due to the small sample size and low number of recurrence events (2 patients/3 lymph nodes). This patient population was all HPV+ oropharyngeal cancer (and all but one were early stage), which generally has a favorable response to RT, so a larger cohort is needed for further analysis. Another limitation of this study is that two DW-MRI sequences were used due to an unforeseen change in scan protocols during the course of this study. The Kolmogorov–Smirnov test showed that differences between the two sequences were not significant at any time point except one, but further analysis with these sequences taken on the same patients should be pursued to reliably quantify any major differences or overall ADC bias between the sequences.Conclusion
Trends of increasing ADC values in GTV_P and GTV_N were observed for our cohort of 15 HPV+ oropharyngeal cancer patients. However, a larger cohort is needed for more robust outcome prediction analysis.Acknowledgements
No acknowledgement found.References
No reference found.Figures

Table 1: Clinical demographics and response data for patients included
in the study.
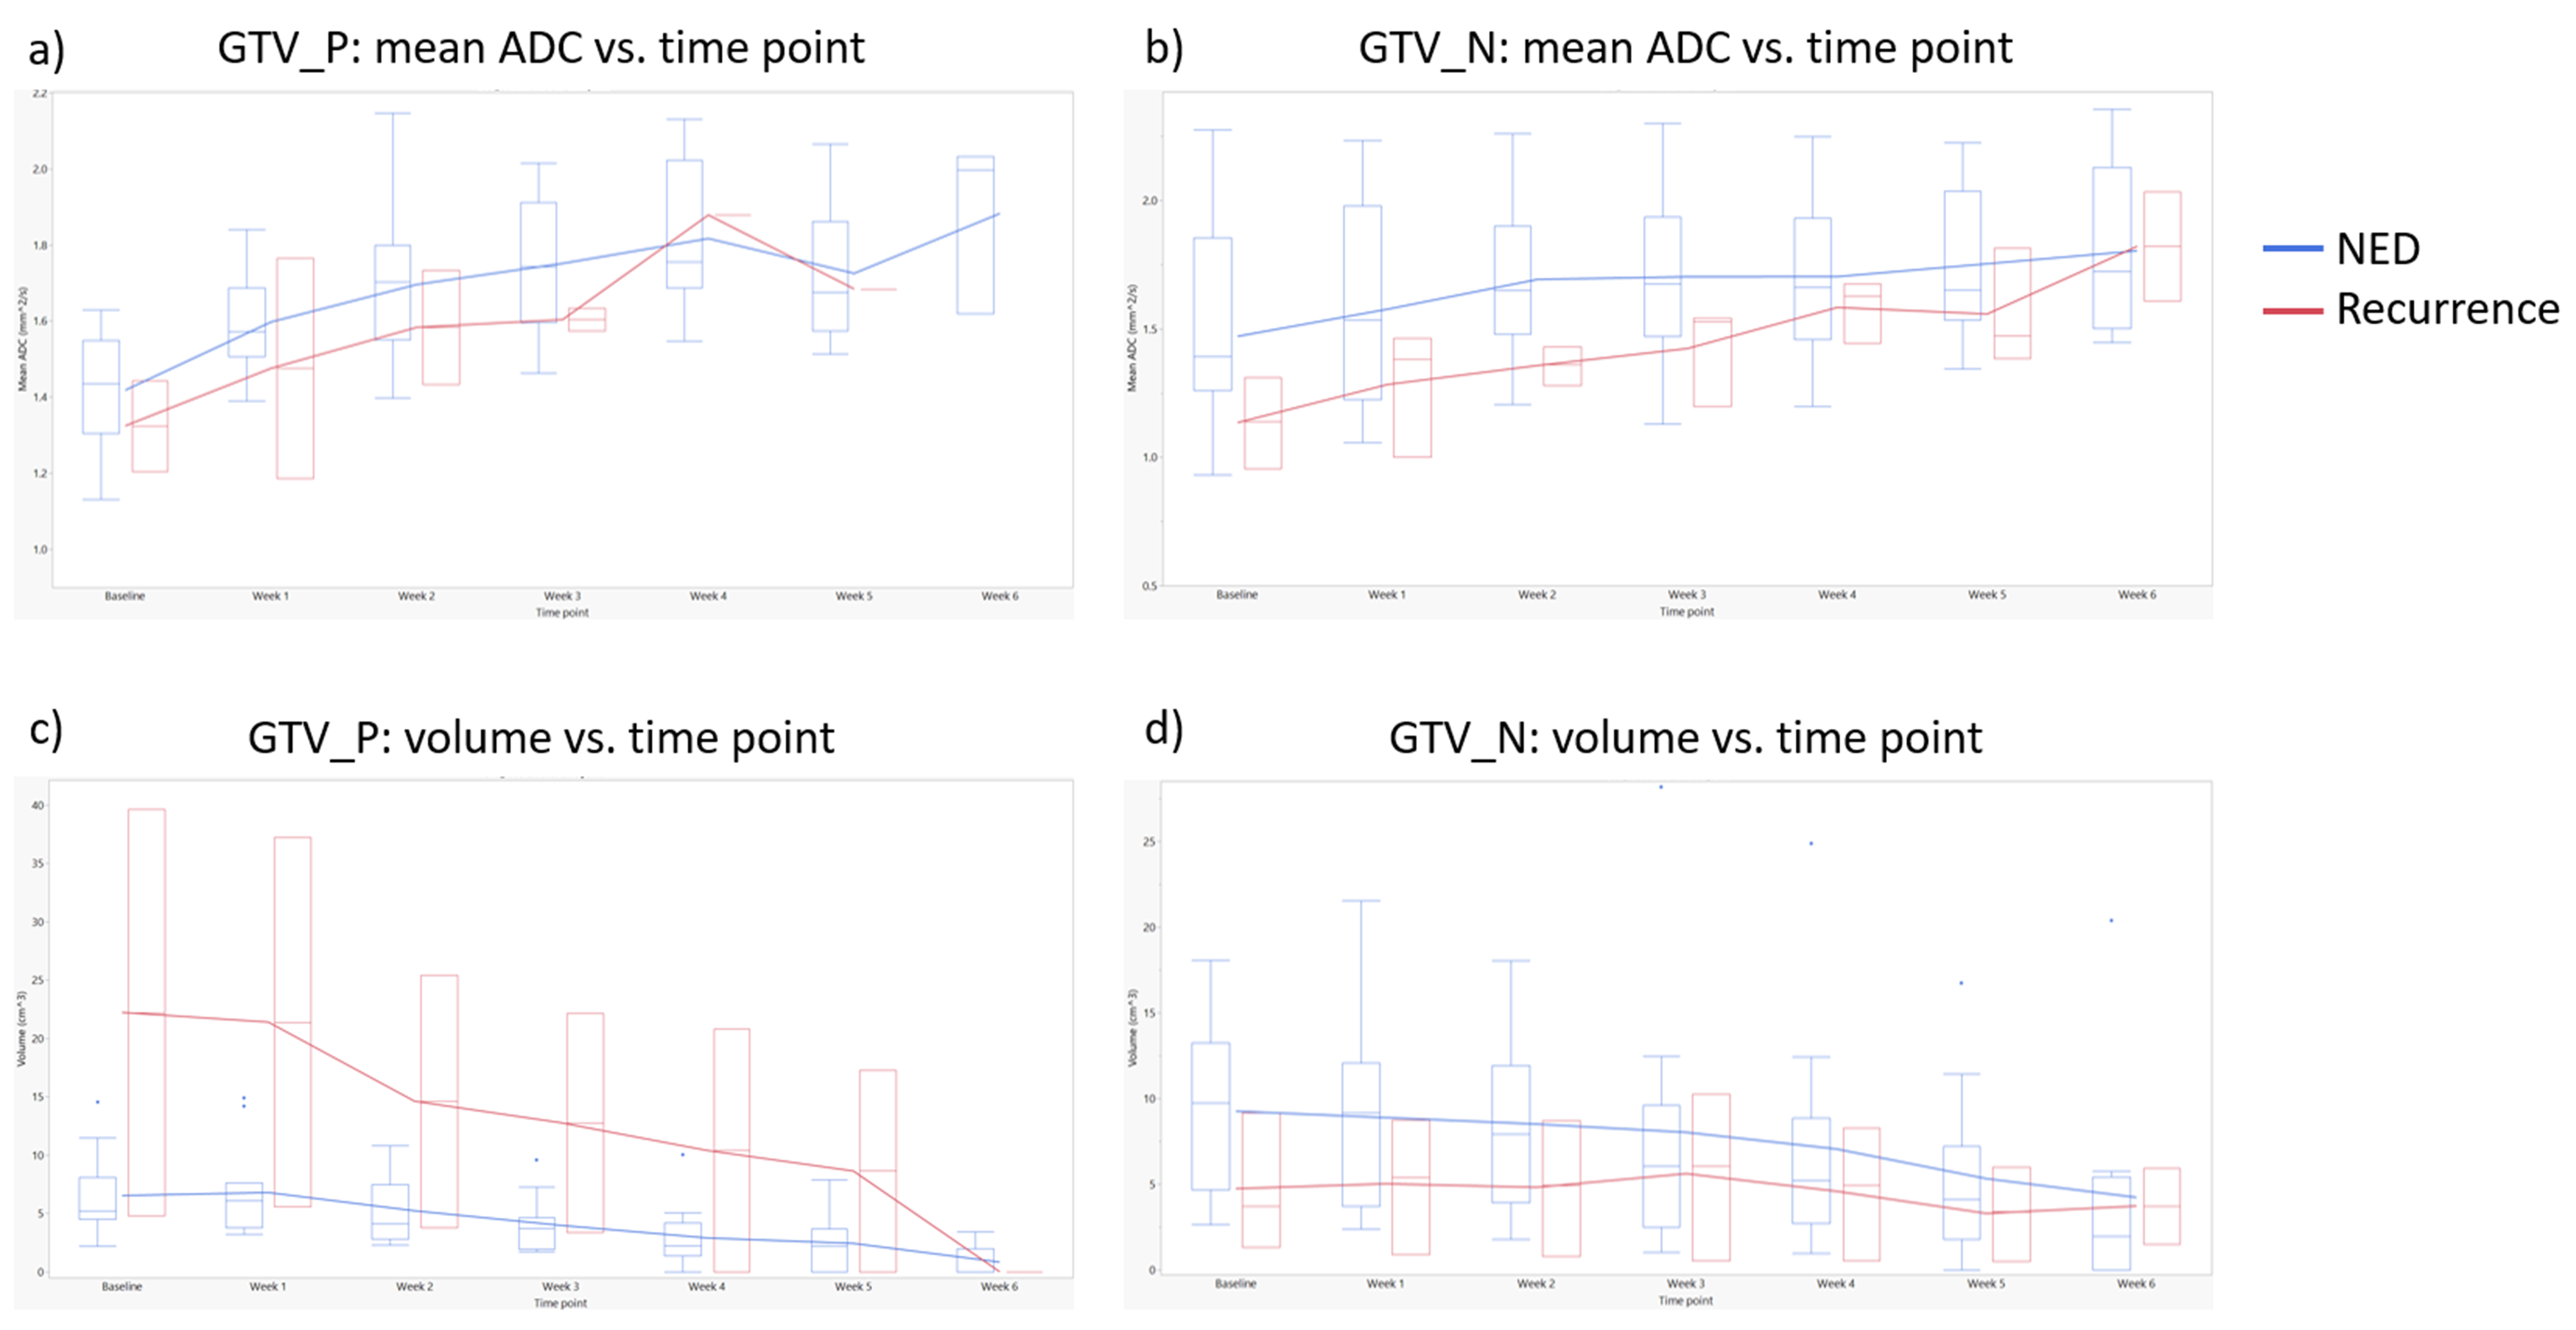
Figure 1: Weekly mean ADC values (mm^2/s) and volumes (cm^3) for primary
tumors (GTV_P) and pathologic lymph nodes (GTV_N). Box plots are split into
patients who had no evidence of disease (NED) at the 2-month follow-up (blue)
and patients with any type of recurrence at 2 months (red). Median ADC values
(not shown) showed similar patterns as mean ADC.
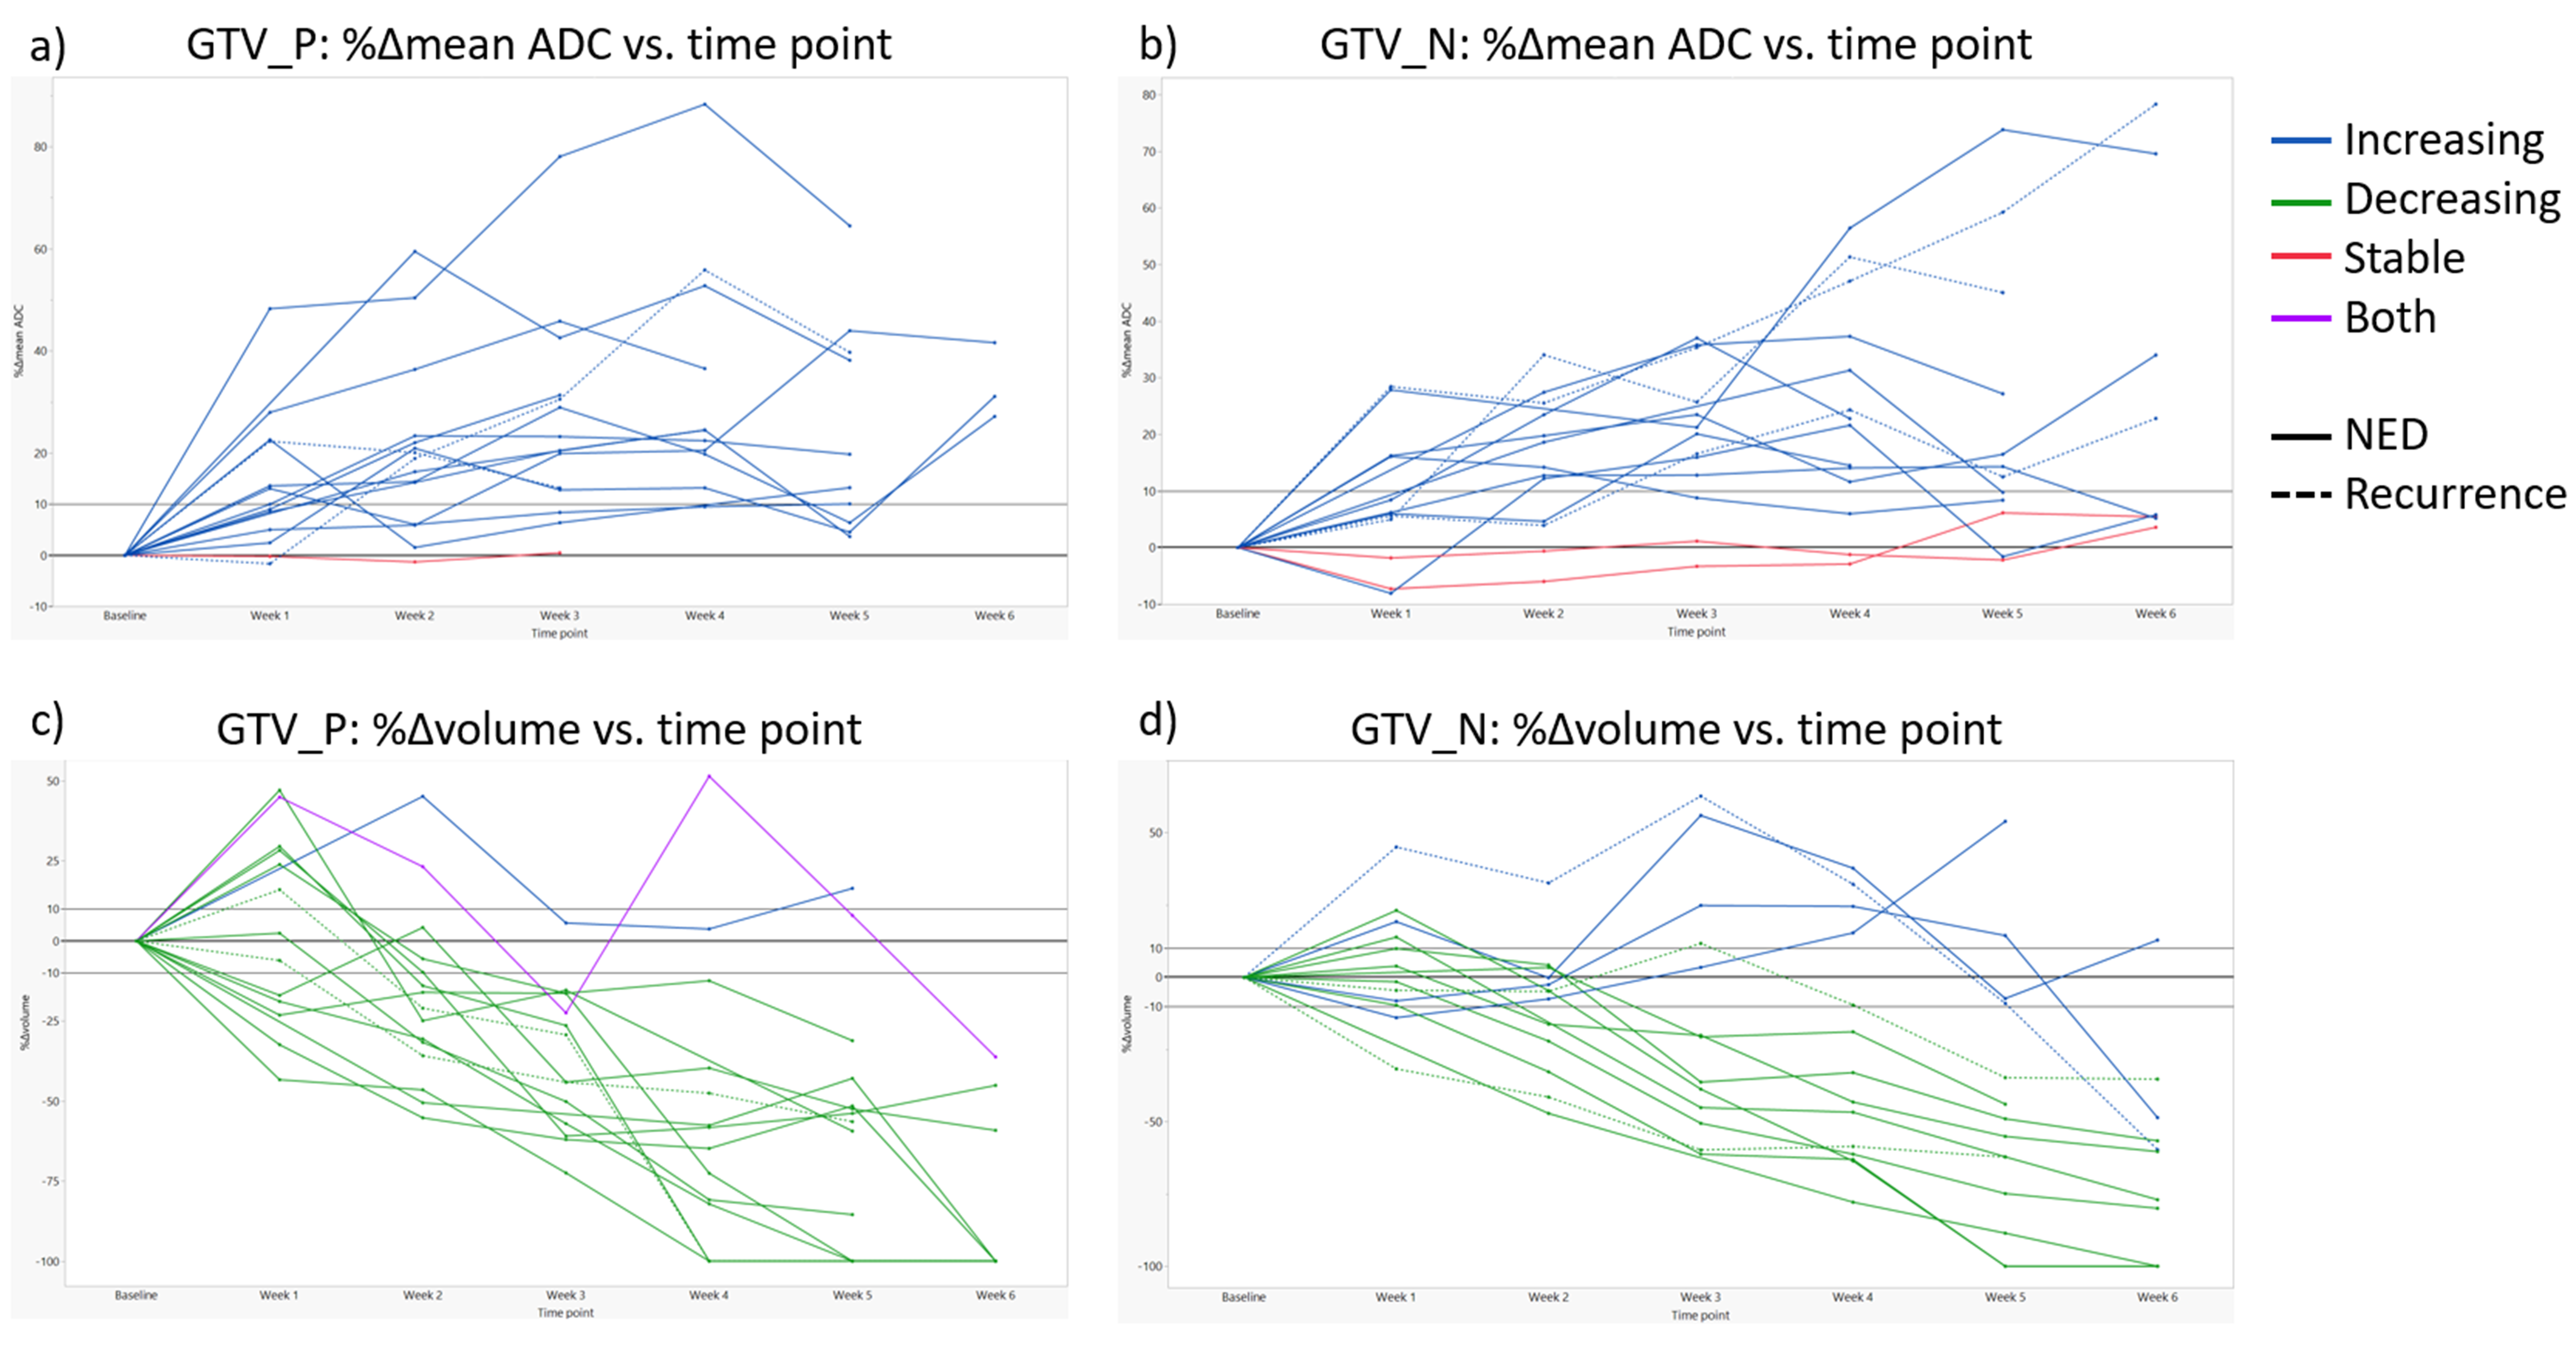
Figure
2: Percent changes from baseline in mean ADC and volume for primary tumors (GTV_P)
and pathologic lymph nodes (GTV_N). Trajectories for each structure are color
coded by increasing, decreasing, stable, or both (criteria for
increasing/decreasing: exceeding the upper/lower 10% threshold for at least two
time points). Solid lines represent patients who had no evidence of disease
(NED) at the 2-month follow-up, and dotted lines represent recurrence at 2
months.
DOI: https://doi.org/10.58530/2022/3415