3414
Deep Learning Approaches Using Convolutional Neural Networks to Generate Synthetic CT from Spinal MRI for Radiotherapy Planning1Department of Radiological Sciences, University of California, Irvine, CA, United States, 2Department of Radiation Oncology, Rutgers-Cancer Institute of New Jersey, Rutgers-Robert Wood Johnson Medical School, New Brunswick, NJ, United States, 3Department of Radiology, Peking University Third Hospital, Beijing, China
Synopsis
A total of 27 patients receiving both spinal CT and MR for evaluation of back pain were identified for analysis. MR images and CT image were co-registered first, and the CT was used as ground truth for training a deep learning algorithm using MR images to generate synthetic CT. In this study, we implemented cycleGAN to generate these synthetic CT images from their corresponding MR slices. Five-fold cross validation was used to evaluate the performance of the trained model. Compared to the original images, the Mean Average Error was 27.63±11.51, and the Peak Signal-to Noise Ratio was 19.44±5.72.
Introduction
The development of conformal radiation techniques such as intensity modulated radiotherapy (IMRT) or volumetric modulated arc therapy (VMAT) opens opportunities for delivering higher dose boosts, which have been shown to improve the pathologic complete response (pCR) rate [1-2]. This challenging technique requires sophisticated planning and precise estimation of the tumor boundary and treatment field to achieve a satisfactory treatment efficacy and minimize side effects. For soft tissue mass, MRI is the preferred imaging modality to evaluate the extent of the tumor and the surrounding tissues, including organs at risk, so a careful planning can be done to optimize the precision of radiation therapy (RT). However, treatment-planning systems rely on the electron density information provided by CTs to calculate dose. Therefore, although MRI provides great information, patients still need to receive CT for RT planning, which would require one more visit and additional irradiation dose. For rigid organs, such as brain and spine, it is possible to generate synthetic CT from MRI [3]. For other soft tissue organs such as breast, prostate and liver, deep learning has also been proven as a feasible approach to generate synthetic CT from MR [4-7]. The purpose of this study is to generate synthetic CT images from their corresponding MR images in order to create an MRI-only guided RT workflow.Methods
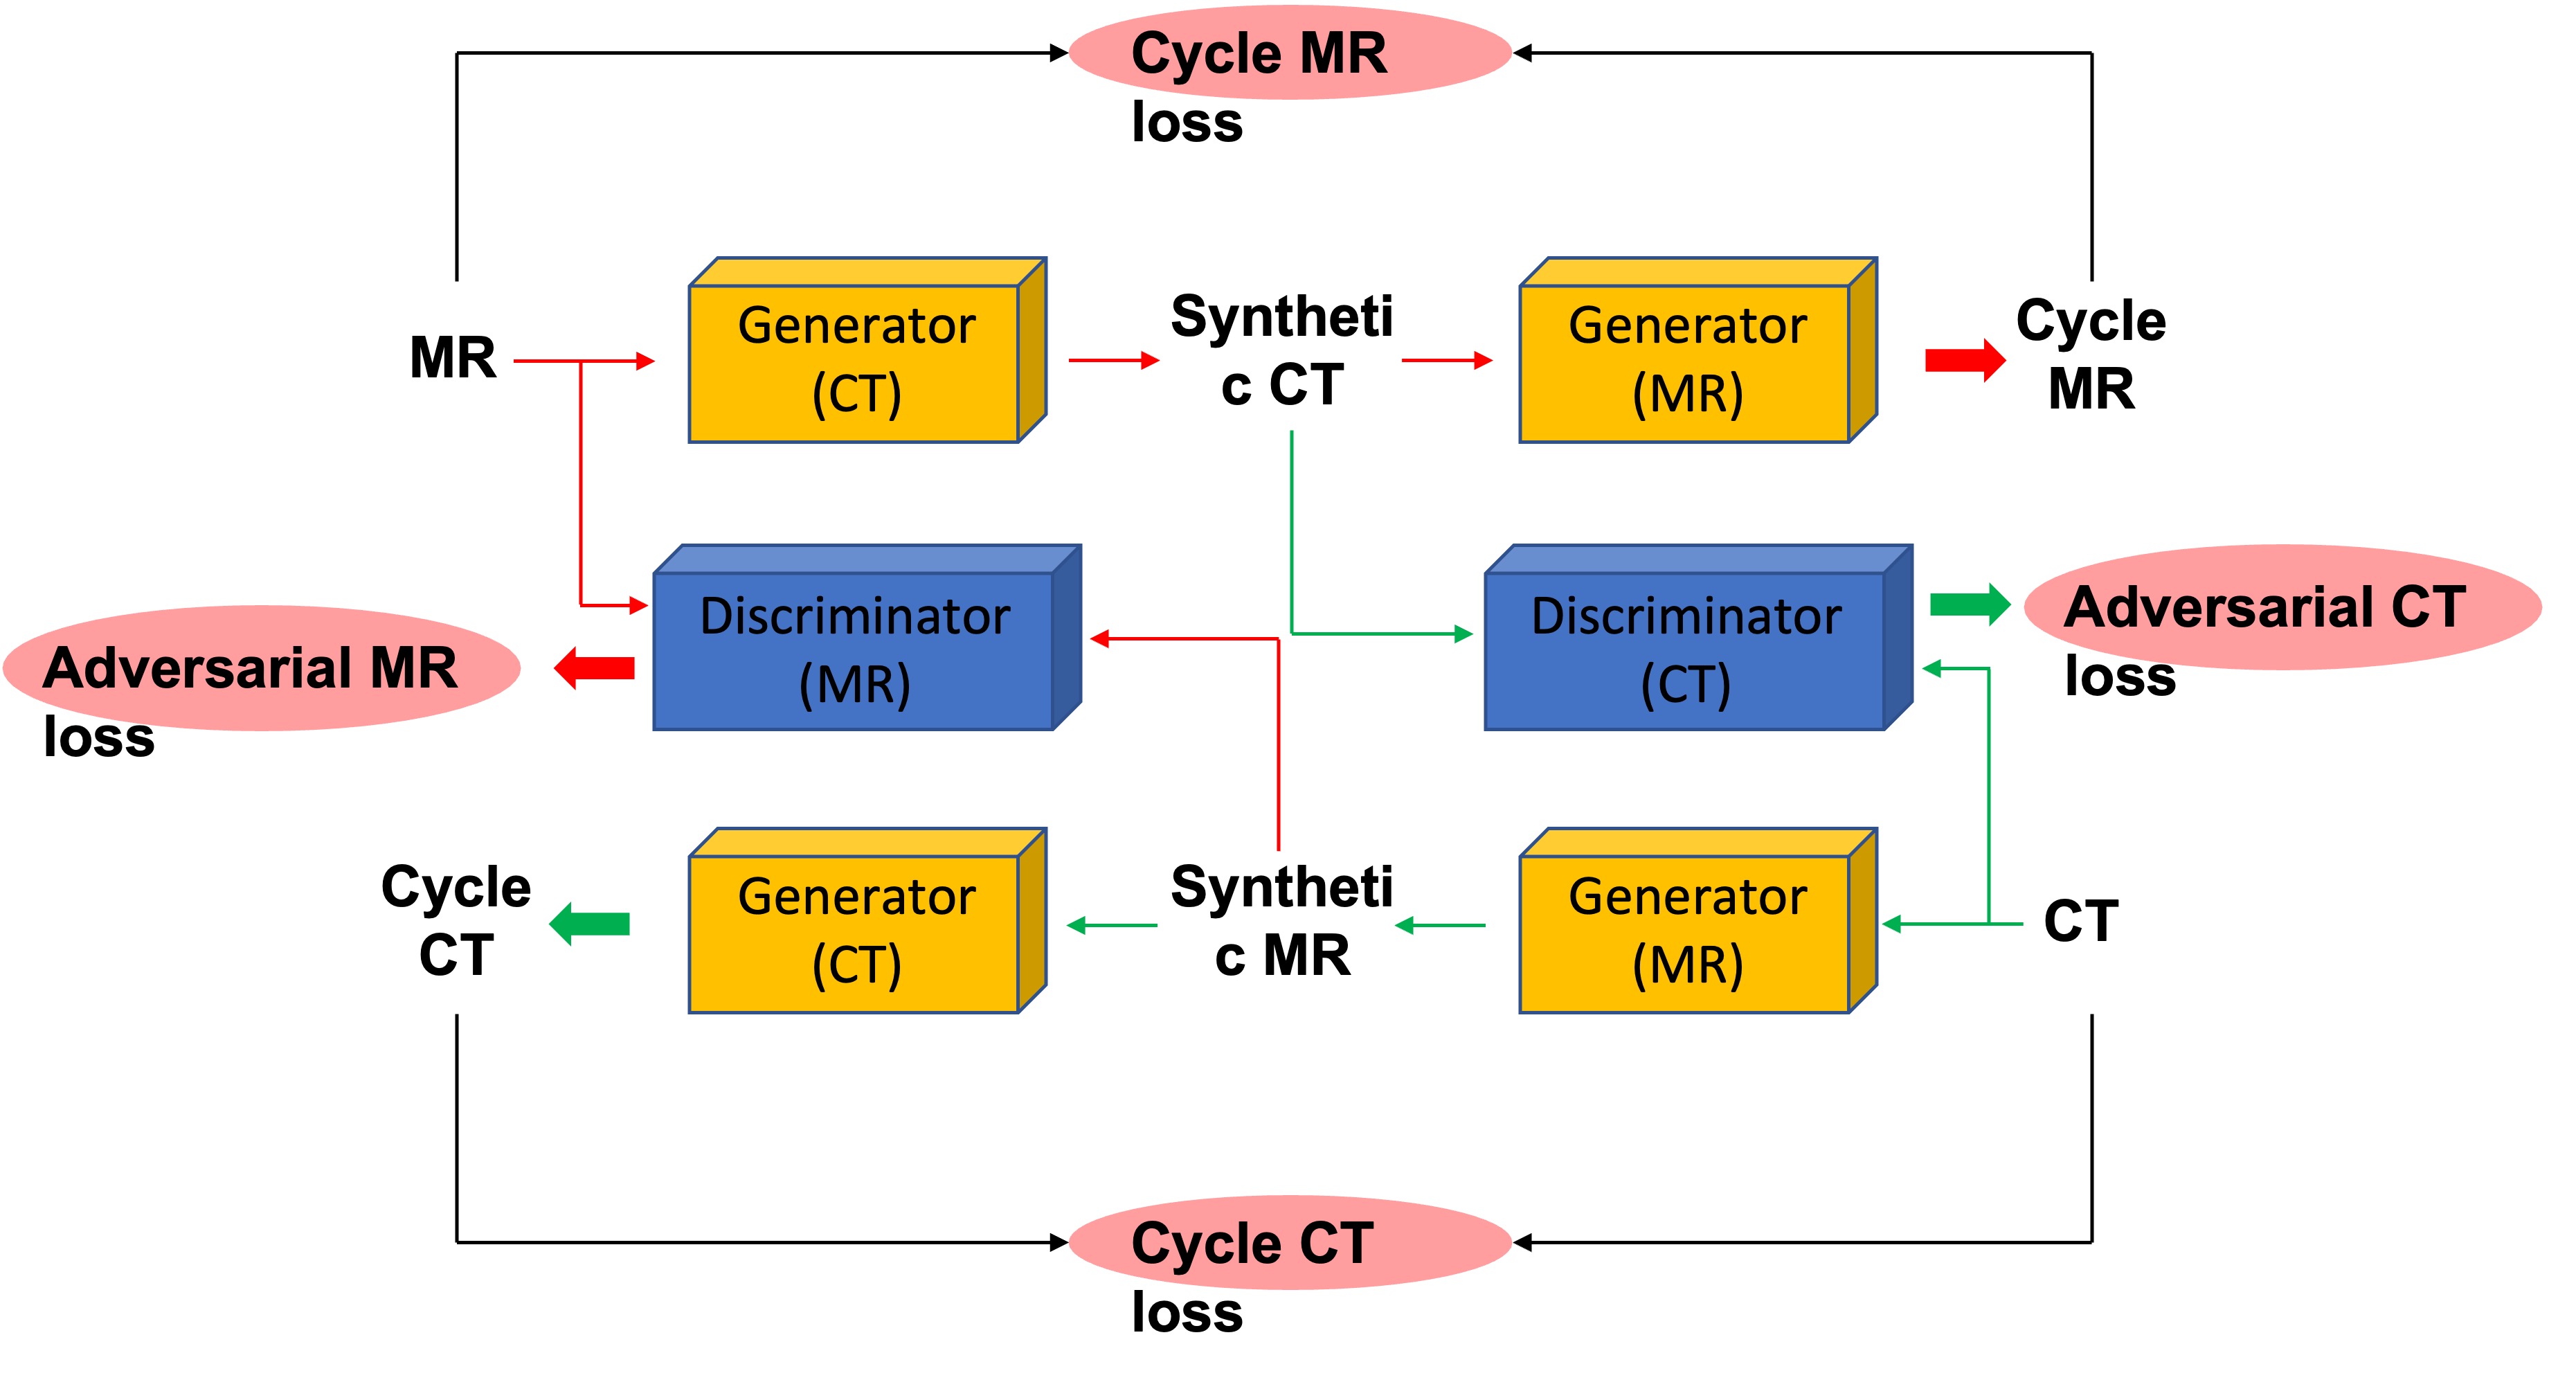
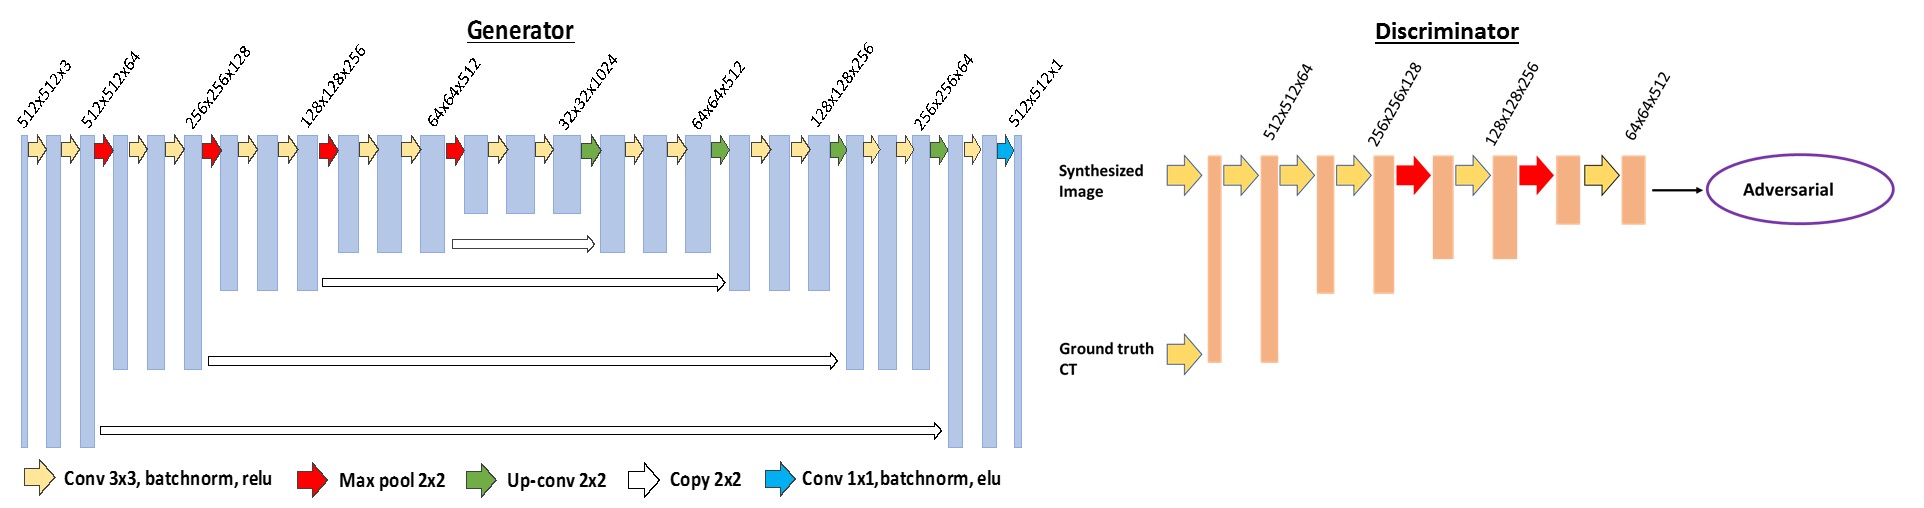
The dataset was obtained by searching our spinal MRI and CT database from patients who received both examination within a few days. When patients were presenting with back pain and suspected to have fracture, CT was done first. When the soft tissue mass was seen, MRI was performed for further evaluation. This MRI was acquired using a 1.5T scanner (GE Signa Excite). Imaging sequences included axial and sagittal spin-echo T1-weighted imaging, axial and sagittal fast spin-echo T2-weighted imaging, and coronal fast-spin echo T2-weighted fat-saturated image sequence. The imaging parameters of the sequence used for analysis in this study were sagittal fast-spin echo T2-weighted fat-saturated image sequence with TR of 3200 ms, TE of 90 ms, 448x224 matrix, 30 cm field of view, and 4 mm slice thickness. These images were reconstructed into 512x512 matrix. The CT was acquired using a GE Discovery CT 750HD scanner with 120 kV, 137~543 mAs, and 3 mm thickness.In this study implemented a cycleGAN based algorithm to generate synthetic CT images from the corresponding MR images, as shown in Figure 1. CycleGAN consists of two mapping functions: mapping from MR to synthetic CT (Generator CT) and mapping from CT to synthetic MR (Generator MR). In addition, cycleGAN uses two discriminators (Discriminator CT and Discriminator MR), which aim to distinguish between real and synthetic CT and MR images, respectively. With this bidirectional configuration of Generator (CT) and Generator (MR), we can get cycleMR from synthetic CT and cycleCT from synthetic MR. For the adversarial loss, CT and MR need to be considered together. Besides the adversarial loss from both Discriminators, the L1-norm distances between the original and cycleGAN generated CT and MRI images is added to the final function to preserve consistency. The Generators and the Discriminator are shown in Figure 2. The Generators and Discriminators work synergically until reaching an optimum training model. Here, a 5-fold cross-validation was used to evaluate this training model performance. The image quality of the synthetic CT was assessed by two metrics, namely: peak signal-to-noise ratio (PSNR), and mean average error (MAE), which were calculated based on the 3D volumes from synthetic CT and the original CT of each patient. The dose maps were calculated from the original CT images and the synthetic CT images.Results
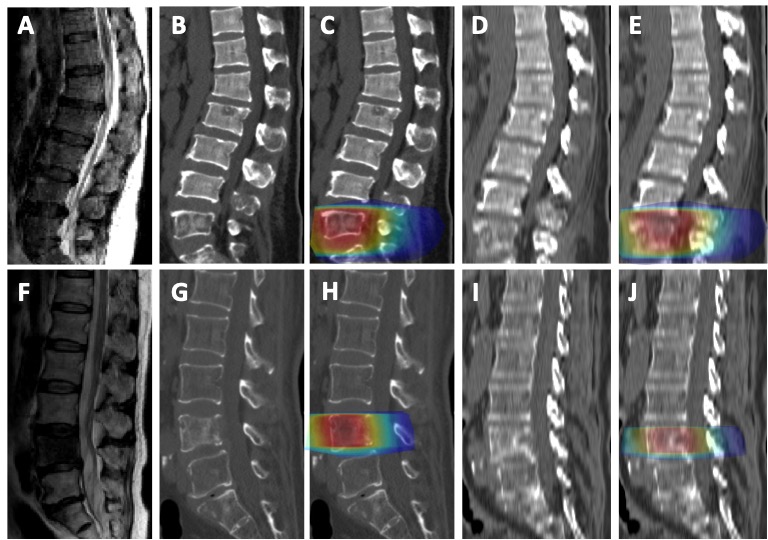
Seventy-nine matched pairs of computed tomography (CT) and magnetic resonance imaging (MRI) scans were selected from a pool of spinal malignant tumors patients. The first processing step consisted in co-registering MR and CT images, by using intensity based affine registration, Figure 3. When the quality of the co-registration is found acceptable, the case was retained for cycleGAN training. The original CT images were used as ground truth, while the co-registered MR images were used as input for training cycleGAN and later generating synthetic CT images. Figure 3 shows the results obtained from 3 patients using our cycleGAN algorithm. The calculated dose maps were shown in Figure 3.Discussion
This project sought to evaluate the feasibility of MRI-only spine RT planning by applying a cycleGAN model to generate synthetic CT images. Comparison of the synthetic CT images and original ones revealed high morphological similarities. The quality comparison resulted in an overall mean PSNR of 19.44 with a standard deviation of 5.72 and a corresponding overall mean MAE of 27.63 ± 11.51. Globally, the mean MAE achieved in this study was satisfactory. However, results are expected to be drastically improved by increasing training sets. Nevertheless, machine learning-based algorithms are advantageous over the segmentation- and the atlas-based algorithms due to their potential to learn patient specific Hounsfield unit (HU) differences across the bone rather than assigning a bulk identical density or HU values from the atlas CT images.The image similarity between the synthetic CT and original CT images suggests the feasibility of further development of an MRI-only workflow for spine RT. This novel methodology will not only save patients a CT imaging session but provide an additional valuable soft tissue information for RT guidance as well. In the spine, several different tissues are considered, including fat, soft tissue and bone. Using different MR sequences that can better differentiate these tissues, e.g. the Dixon methods, will further improve the quality and the electron density of the generated synthetic CT.We applied a novel learning-based approach to integrating cycleGAN to synthesize spine CT images from routine MR T2 images for potential MRI-only spine RT. Our novel method generated synthetic CT images with equivalent quality to the original CT images used for dose calculation during RT.Acknowledgements
This study was supported in part by NIH R01 CA127927, the National Natural Science Foundation of China (81971578, 81701648), the Key Clinical Projects of the Peking University Third Hospital (BYSY2018007).References
1. Burbach JP, den Harder AM, Intven M, et al. Impact of radiotherapy boost on pathological complete response in patients with locally advanced rectal cancer: a systematic review and meta-analysis. Radiother Oncol. 2014;113(1):1-9.
2. Burbach JP, Verkooijen HM, Intven M, et al. RandomizEd controlled trial for pre-operAtive dose-escaLation BOOST in locally advanced rectal cancer (RECTAL BOOST study): study protocol for a randomized controlled trial. Trials. 2015;16:58.
3. Spadea MF, Pileggi G, Zaffino P, et al. Deep Convolution Neural Network (DCNN) Multiplane Approach to Synthetic CT Generation From MR images-Application in Brain Proton Therapy. Int J Radiat Oncol Biol Phys. 2019;105(3):495-503.
4. Olberg S, Zhang H, Kennedy WR, et al. Synthetic CT reconstruction using a deep spatial pyramid convolutional framework for MR-only breast radiotherapy. Med Phys. 2019;46(9):4135-4147.
5. Liu Y, Lei Y, Wang Y, et al. Evaluation of a deep learning-based pelvic synthetic CT generation technique for MRI-based prostate proton treatment planning. Phys Med Biol. 2019 Sep 5. doi: 10.1088/1361-6560/ab41af.
6. Fu J, Yang Y, Singhrao K, et al. Deep learning approaches using 2D and 3D convolutional neural networks for generating male pelvic synthetic computed tomography from magnetic resonance imaging. Med Phys. 2019;46(9):3788-3798.
7. Liu Y, Lei Y, Wang T, et al. MRI-based treatment planning for liver stereotactic body radiotherapy: validation of a deep learning-based synthetic CT generation method. Br J Radiol. 2019;92(1100):20190067.
Figures