3412
Magnetic Resonance Elastography of Pancreas: Comparison between different drivers and driving frequencies.1Department of Radiology, The Ohio State University, Columbus, OH, United States
Synopsis
Magnetic Resonance Elastography is an emerging alternative diagnostic tool for palpation and it is known that stiffness is altered in chronic pancreatitis and as well as in pancreatic tumors. In this study we compared performances of a drum-shaped rigid driver with a flat soft-pad passive driver in 10 volunteers at 40Hz and 60Hz diver frequencies. The variations of mean stiffness values measured between the drivers were found to be insignificant at a given frequency. Additionally, stiffness measured at 40Hz is lower compared to 60Hz. Therefore, users can make their choice of the driver based on patient comfort, longevity and cost.
Introduction
Pancreatic cancer is the third leading cause of death in United States. There is a need for noninvasive imaging methods to diagnose various pancreatic diseases such as pancreatic cancer, chronic pancreatitis (CP) etc. There are many limitations with current noninvasive imaging methods. It is known that pancreatic stiffness is altered in diseases such as pancreatic tumors or CP [1]. Magnetic resonance elastography (MRE) is a noninvasive method to estimate stiffness of soft tissues without the need for invasive biopsies. Anatomically pancreas is a complex structure and situated deep in the abdomen. Therefore, the major challenge of MRE is to be able to generate adequate vibrations for better wave penetration in the pancreas. Therefore, the aim of the study was to determine the performance of two passive driver designs at two different frequencies to determine variation in stiffness measurements.Methods
All imaging was performed in 10 healthy volunteers using a 3T MRI scanner (MAGNETOM Prisma, Siemens Healthcare, Erlangen, Germany) after obtaining written informed consent. A spin echo- echo planar imaging (SE-EPI) MRE sequence was performed to obtain 9 slices of pancreas. The image acquisition was performed on each subject using 1. Drum shaped (rigid) plastic diaphragm passive driver (commercial driver used for liver MRE) from Resoundant Inc, Rochester, MN USA and 2. Flat soft pad passive driver developed as described in [2]. In both the acquisitions, only passive drivers were replaced without moving the subject while using same active driver (Resoundant Inc, Rochester, MN USA), and post processing algorithm. The passive drivers were placed at the epigastrium and partially on the ribcage centered around the pancreas and the following imaging parameters were used: FOV: 380x380 mm; Matrix: 128x256 (interpolated to 256x256); Slice thickness: 2.5 mm; EPI factor: 32; GRAPPA: 2. This protocol is repeated twice at different driver frequencies 60Hz/80Hz MEG (TR/TE: 1050/36ms and 40Hz/120Hz MEG (TR/TE: 1125/27ms ). Both in plane and through plane wave images were acquired to obtain 3D displacement field. 3D local frequency estimation inversion was performed to report the stiffness values. Center 5 slices were used for reporting the stiffness values to avoid any edge effects. Students paired t-test was performed to determine the statistical difference between stiffness values obtained using two driver setups. P<0.05 is considered insignificant.Results
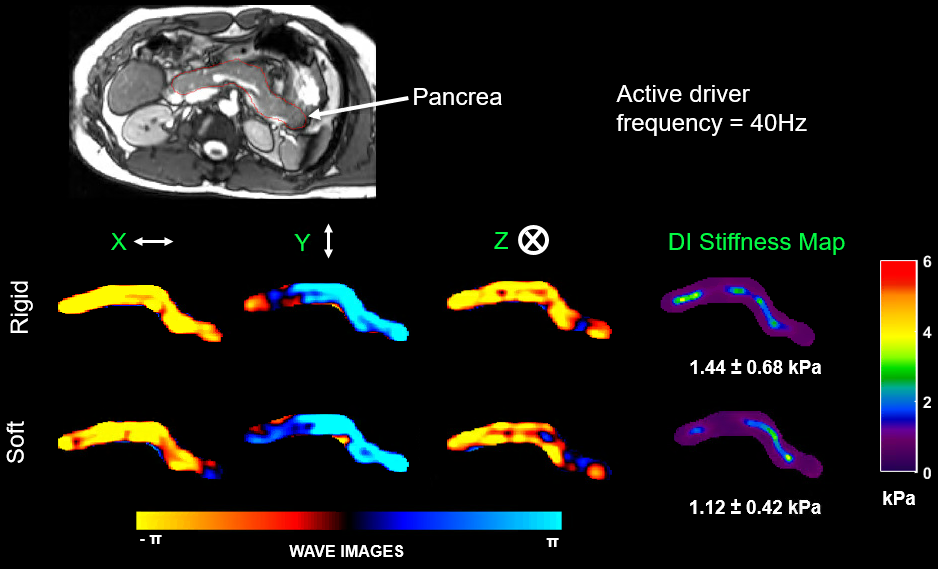
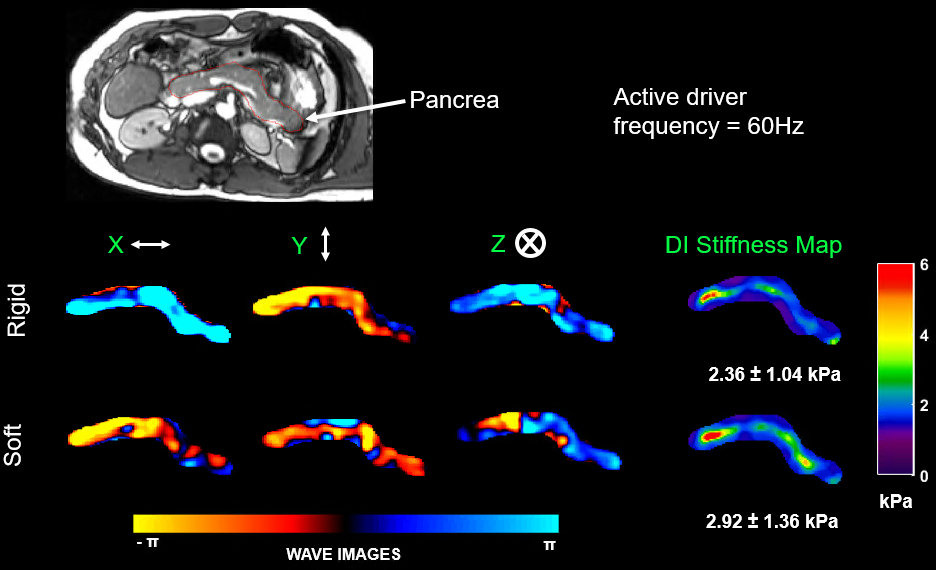
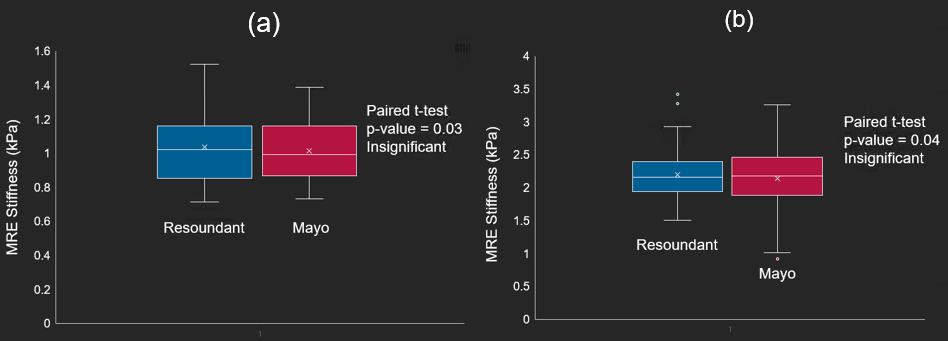
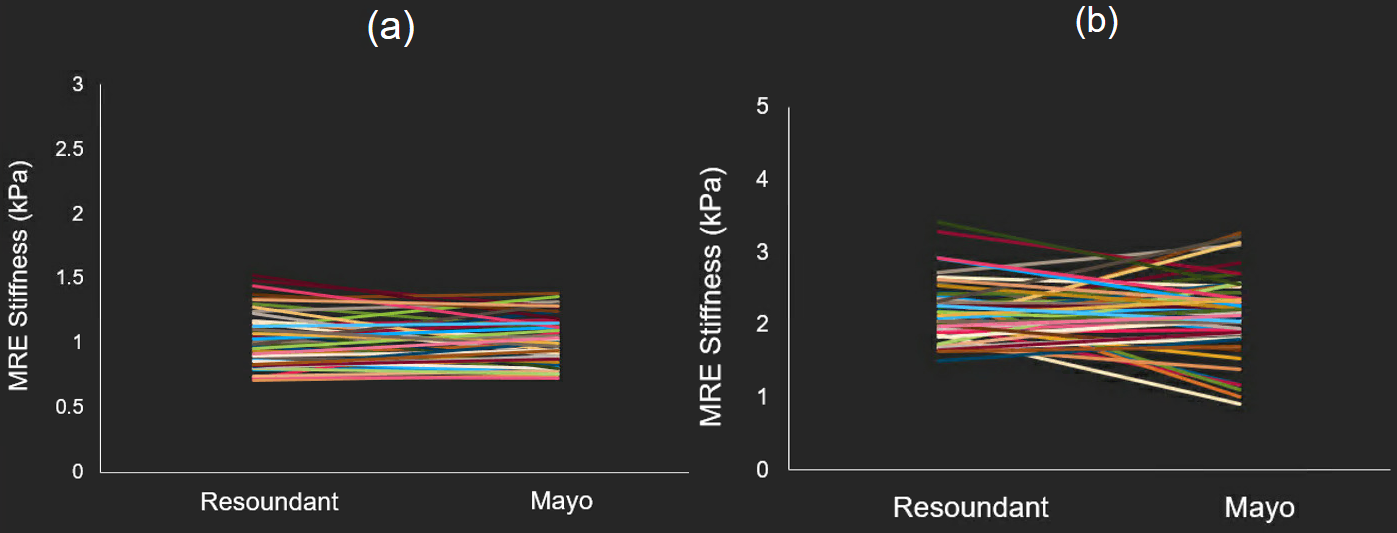
Figure 1 shows magnitude image with red contour delineating the pancreas along with good discernible waves (all the components of wave field) using rigid driver and soft driver with corresponding stiffness maps at 40Hz. Similarly, Figure 2 shows magnitude image with red contour delineating the pancreas along with good discernible waves (all the components of wave field) using rigid driver and soft driver with corresponding stiffness maps at 60Hz. Figure 3 shows box plot of stiffness values obtained at 40Hz and 60Hz using both the driver setups with no significant difference. Figure 4 shows line plots of stiffness values at 40Hz and 60Hz using both driver setups.Discussion
This study demonstrated that commercial rigid drum driver and soft pad driver generated adequate waves in the pancreas. There was no significant difference in stiffness values obtained using both drivers. Additionally, 60Hz waves penetrated deep into the pancreas without much attenuation similar to 40Hz vibrations. 60Hz vibrations will generate shorter wavelengths compared to 40Hz and will potentially enable to generate relatively robust stiffness measurements using the current inversion (which assumes waves are propagating in the infinite medium). Additionally, as expected 40Hz generated lower stiffness values compared to 60Hz frequency. Therefore, this study recommends 60Hz frequency of vibrations with commercial rigid driver (used for liver MRE) without the need of developing new driver for imaging pancreas. Additionally, we also suggest that based on the patient’s comfort the both drivers can be used accordingly.Conclusion
This study demonstrated that both the drivers (rigid drum and soft pad) are equally efficient and delivers stiffness values that are not significantly different to each other when the measurements are obtained in similar settings. As expected the overall ranges of stiffness values measured at different driver frequencies varied for both the drivers used.Acknowledgements
N/AReferences
1. Janssen J, Schlorer E, Greiner L. EUS elastography of the pancreas: feasibility and pattern description of the normal pancreas, chronic pancreatitis, and focal pancreatic lesions. Gastrointest Endosc. 2007;65(7):971–978.
2. Shi Y, Glaser KJ, Venkatesh SK, Ben-Abraham EI, Ehman RL. Feasibility of using 3D MR elastography to determine pancreatic stiffness in healthy volunteers. J Magn Reson Imaging. 2015 Feb;41(2):369-75. doi: 10.1002/jmri.24572.
Figures