3411
Test-retest Repeatability of High-resolution Whole-brain DCE-MRI in High-grade Glioma Patients1Department Of Electrical and Computer Engineering, University of Southern California, Los Angeles, CA, United States, 2Department of Neurosurgery, University of Southern California, Los Angeles, CA, United States, 3Department of Radiology, University of Southern California, Los Angeles, CA, United States, 4Department of Electrical and Computer Engineering, University of Southern California, Los Angeles, CA, United States
Synopsis
We perform a prospective test-retest repeatability study of one such approach, in patients with high-grade glioma. Two separate scans were performed within 3-7 days apart. Tumor, scalp, normal white matter, pons, cerebellum and muscle regions were segmented manually. The coefficients of variation of median Kt were 50.4% to 66.6% and of median vp were 23.2% to 80.0%, based on our first 5 subjects.
Introduction
Quantitative DCE-MRI1,2 is a powerful tool for mapping neurovascular parameters and aids the monitoring of diseases such as brain tumor3,4. High-resolution whole-brain DCE-MRI has become feasible, due to advances in sparse data sampling and constrained image reconstruction5,6. An important next step is to determine its test-retest repeatability in relevant patient groups, so that this method may be utilized for longitudinal assessment, and ultimately inform clinical decision making for individual patients. Bliesener et al.7 recently demonstrated a pseudo test-retest evaluation of a recent millimeter-resolution whole-brain DCE-MRI approach. Here, we perform a prospective test-retest repeatability study of this approach, in patients with high-grade glioma.Methods
Five patients with high-grade glioma (2 female, 28-67) were scanned twice 3-7 days apart. Imaging was performed on a clinical 3T MRI scanner (HDx 23, GE Healthcare, Waukesha, Wisconsin) with an 8-channel head coil. Imaging parameters: TR=4.9 ms, TE=1.9ms, FOV=24x24x24 cm3; matrix size=256x240x120; resolution=0.96x1x2 mm3. Figure 1 illustrates the imaging pipeline, which is the same as that used in Bliesener et al.7. Reconstruction was performed offline. Model consistency constrained (MOCCO) and sparse sensitivity encoded (SPSENSE) methods were used and compared for tracer-kinetic (TK) parameter estimation.Tumor regions of interest (ROIs) were manually drawn by a board-certified neuroradiologist with 10-years of experience (co-author J.A.). Non-tumor ROIs were manually drawn by Z.Z. supervised and confirmed by J.A. Each 3D ROI consists of 3 adjacent slices but only one 2D slice is displayed. All ROIs were drawn on axial views except that of muscle. For all scans, median and interquartile range of the TK parameters were compared within each ROI, e.g., vascular permeability (Kt) and plasma volume (vp). We report the coefficients of variation (COVs) of Kt and vp in ROIs with non-negligible values.
Results
Figure 2 shows the post-contrast images with ROIs (red) overlayed from one representative patient with visible enhanced tumor at the 1st visit. Figure 3 shows the vascular input functions (VIF) estimated by MOCCO and SPSENSE from both scans of 3 representative subjects. Inter-scan variations in VIF were below 5% except that for the 3rd subject shown. MOCCO had higher VIF values than SPSENSE, including 66.5%, 51.85, 30.0% higher estimated concentration at the peak, for these three subjects.Figure 4 and 5 show median and interquartile range of Kt and vp as a function of visit of all five subjects. Both methods estimated similar visit-dependent behaviors of median Kt and vp for all five ROIs, except median Kt for pons ROIs. However, MOCCO estimation had a wider interquartile range. Two tissues exhibited non-negligible Kt: scalp and muscle. MOCCO achieved COVs of 53.6% and 66.6% for median Kt of scalp and muscle within ROIs shown in Figure 2. SPSENSE achieved COVs of 50.4% and 60.9% for median Kt. In the same ROIs, MOCCO achieved COVs of 62.6% and 23.2%, and SPSENSE achieved COVs of 62.6% and 80.0% for median vp.
Only one case exhibited visibly enhancing tumor. Table 1 reports median and interquartile range of Kt and vp for this subject in their tumor ROI.
Discussion
Both methods showed excellent repeatability in VIF estimation with <5% variations, and poor repeatability in Kt and vp estimation in reference regions. The reference regions have very low Kt, making TK estimates highly variable. We expect tumor regions with higher Kt to have lower COV with the same imaging method, however, this remains to be verified experimentally.MOCCO TK values were generally lower than that of SPSENSE. This is because MOCCO estimated the VIF peak value to be 29.7% to 70.3% higher than SPSENSE.
This study has several limitations. Due to lack of ground truth TK parameters for validation, it is hard to verify the soundness of the full pipeline. This further limited us to focus on inter-visit difference. Also, due to a very small number of subjects, we had only one subject with visible enhancing tumor for tumor analysis. As a comprise, we used multiple reference regions with different sensitivity to enhancement. Data collection is ongoing, and we expect to soon be able to evaluate repeatability in a range of primary brain tumor regions.
Conclusion
We demonstrate of an automated millimeter resolution whole-brain DCE-MRI pipeline with excellent test-retest repeatability in VIF and poor repeatability of Kt and vp in non-tumor tissues.Acknowledgements
We acknowledge grant support from the National Institutes of Health (#R33-CA225400). We thank the clinical research coordinators who facilitated patient recruitment, especially Elizabeth Mojarro-Huang.
References
1. Tofts PS, Brix G, Buckley DL, et al. Estimating kinetic parameters from dynamic contrast‐enhanced t1‐weighted MRI of a diffusable tracer: Standardized quantities and symbols. J Magn Reson Imaging. 1999;10(3):223-232. doi:10.1002/(SICI)1522-2586(199909)10:3<223::AID-JMRI2>3.0.CO;2-S
2. Sourbron SP, Buckley DL. On the scope and interpretation of the Tofts models for DCE-MRI. Magn Reson Med. 2011;66(3):735-745. doi:10.1002/mrm.22861
3. Law M, Yang S, Babb JS, et al. Comparison of cerebral blood volume and vascular permeability from dynamic susceptibility contrast-enhanced perfusion MR imaging with glioma grade. Am J Neuroradiol. 2004;25(5):746-755.
4. Larsson HBW, Stubgaard M, Frederiksen JL, Jensen M, Henriksen O, Paulson OB. Quantitation of blood-brain barrier defect by magnetic resonance imaging and gadolinium-DTPA in patients with multiple sclerosis and brain tumors. Magn Reson Med. 1990;16(1):117-131. doi:10.1002/mrm.1910160111
5. Guo Y, Lingala SG, Zhu Y, Lebel RM, Nayak KS. Direct estimation of tracer-kinetic parameter maps from highly undersampled brain dynamic contrast enhanced MRI. Magn Reson Med. 2017;78(4):1566-1578. doi:10.1002/mrm.26540
6. Guo Y, Lingala SG, Bliesener Y, Lebel RM, Zhu Y, Nayak KS. Joint arterial input function and tracer kinetic parameter estimation from undersampled dynamic contrast-enhanced MRI using a model consistency constraint. Magn Reson Med. 2018;79(5):2804-2815. doi:10.1002/mrm.26904
7. Bliesener Y, Lebel RM, Acharya J, Frayne R, Nayak KS. Pseudo test-retest evaluation of millimeter-resolution whole-brain dynamic contrast-enhanced MRI in patients with high-grade glioma. Radiology. 2021;300(2):410-420. doi:10.1148/RADIOL.2021203628/ASSET/IMAGES/LARGE/RADIOL.2021203628.TBL4.JPEG
Figures
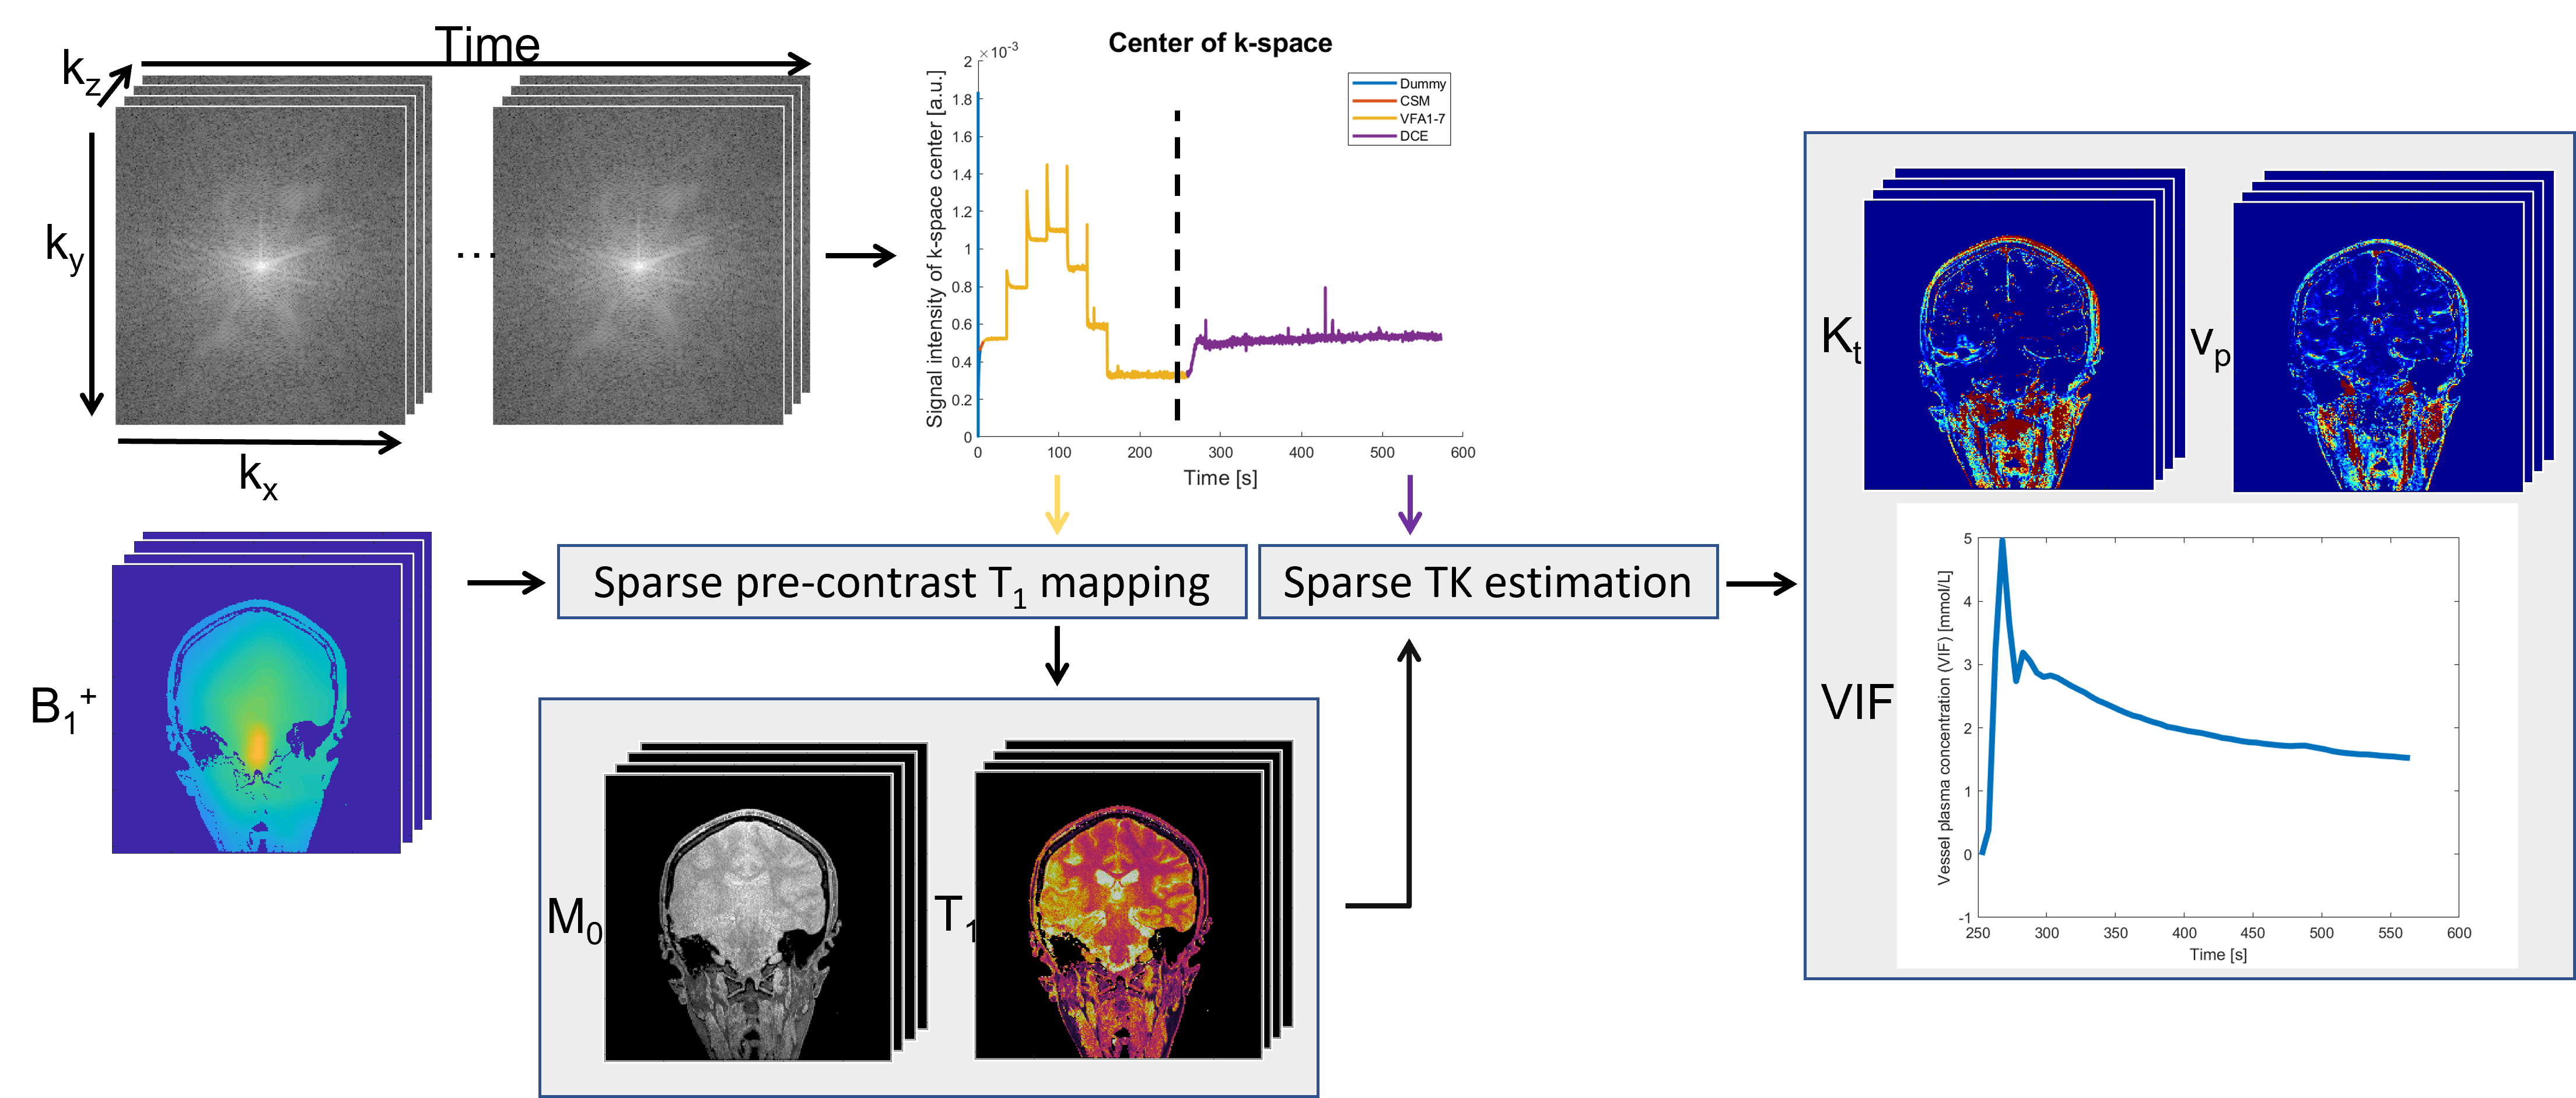
Figure 1. Millimeter-resolution whole-brain DCE-MRI pipeline. It is noticeable that STAR-DCE measures pre-contrast T1 maps using a VFA T1 mapping approach whose data acquisition is integrated with a DCE-MRI while the B1+ mapping is performed from a separate scan. Also, STAR-DCE automatically detects a vascular ROI and estimates a VIF from it.
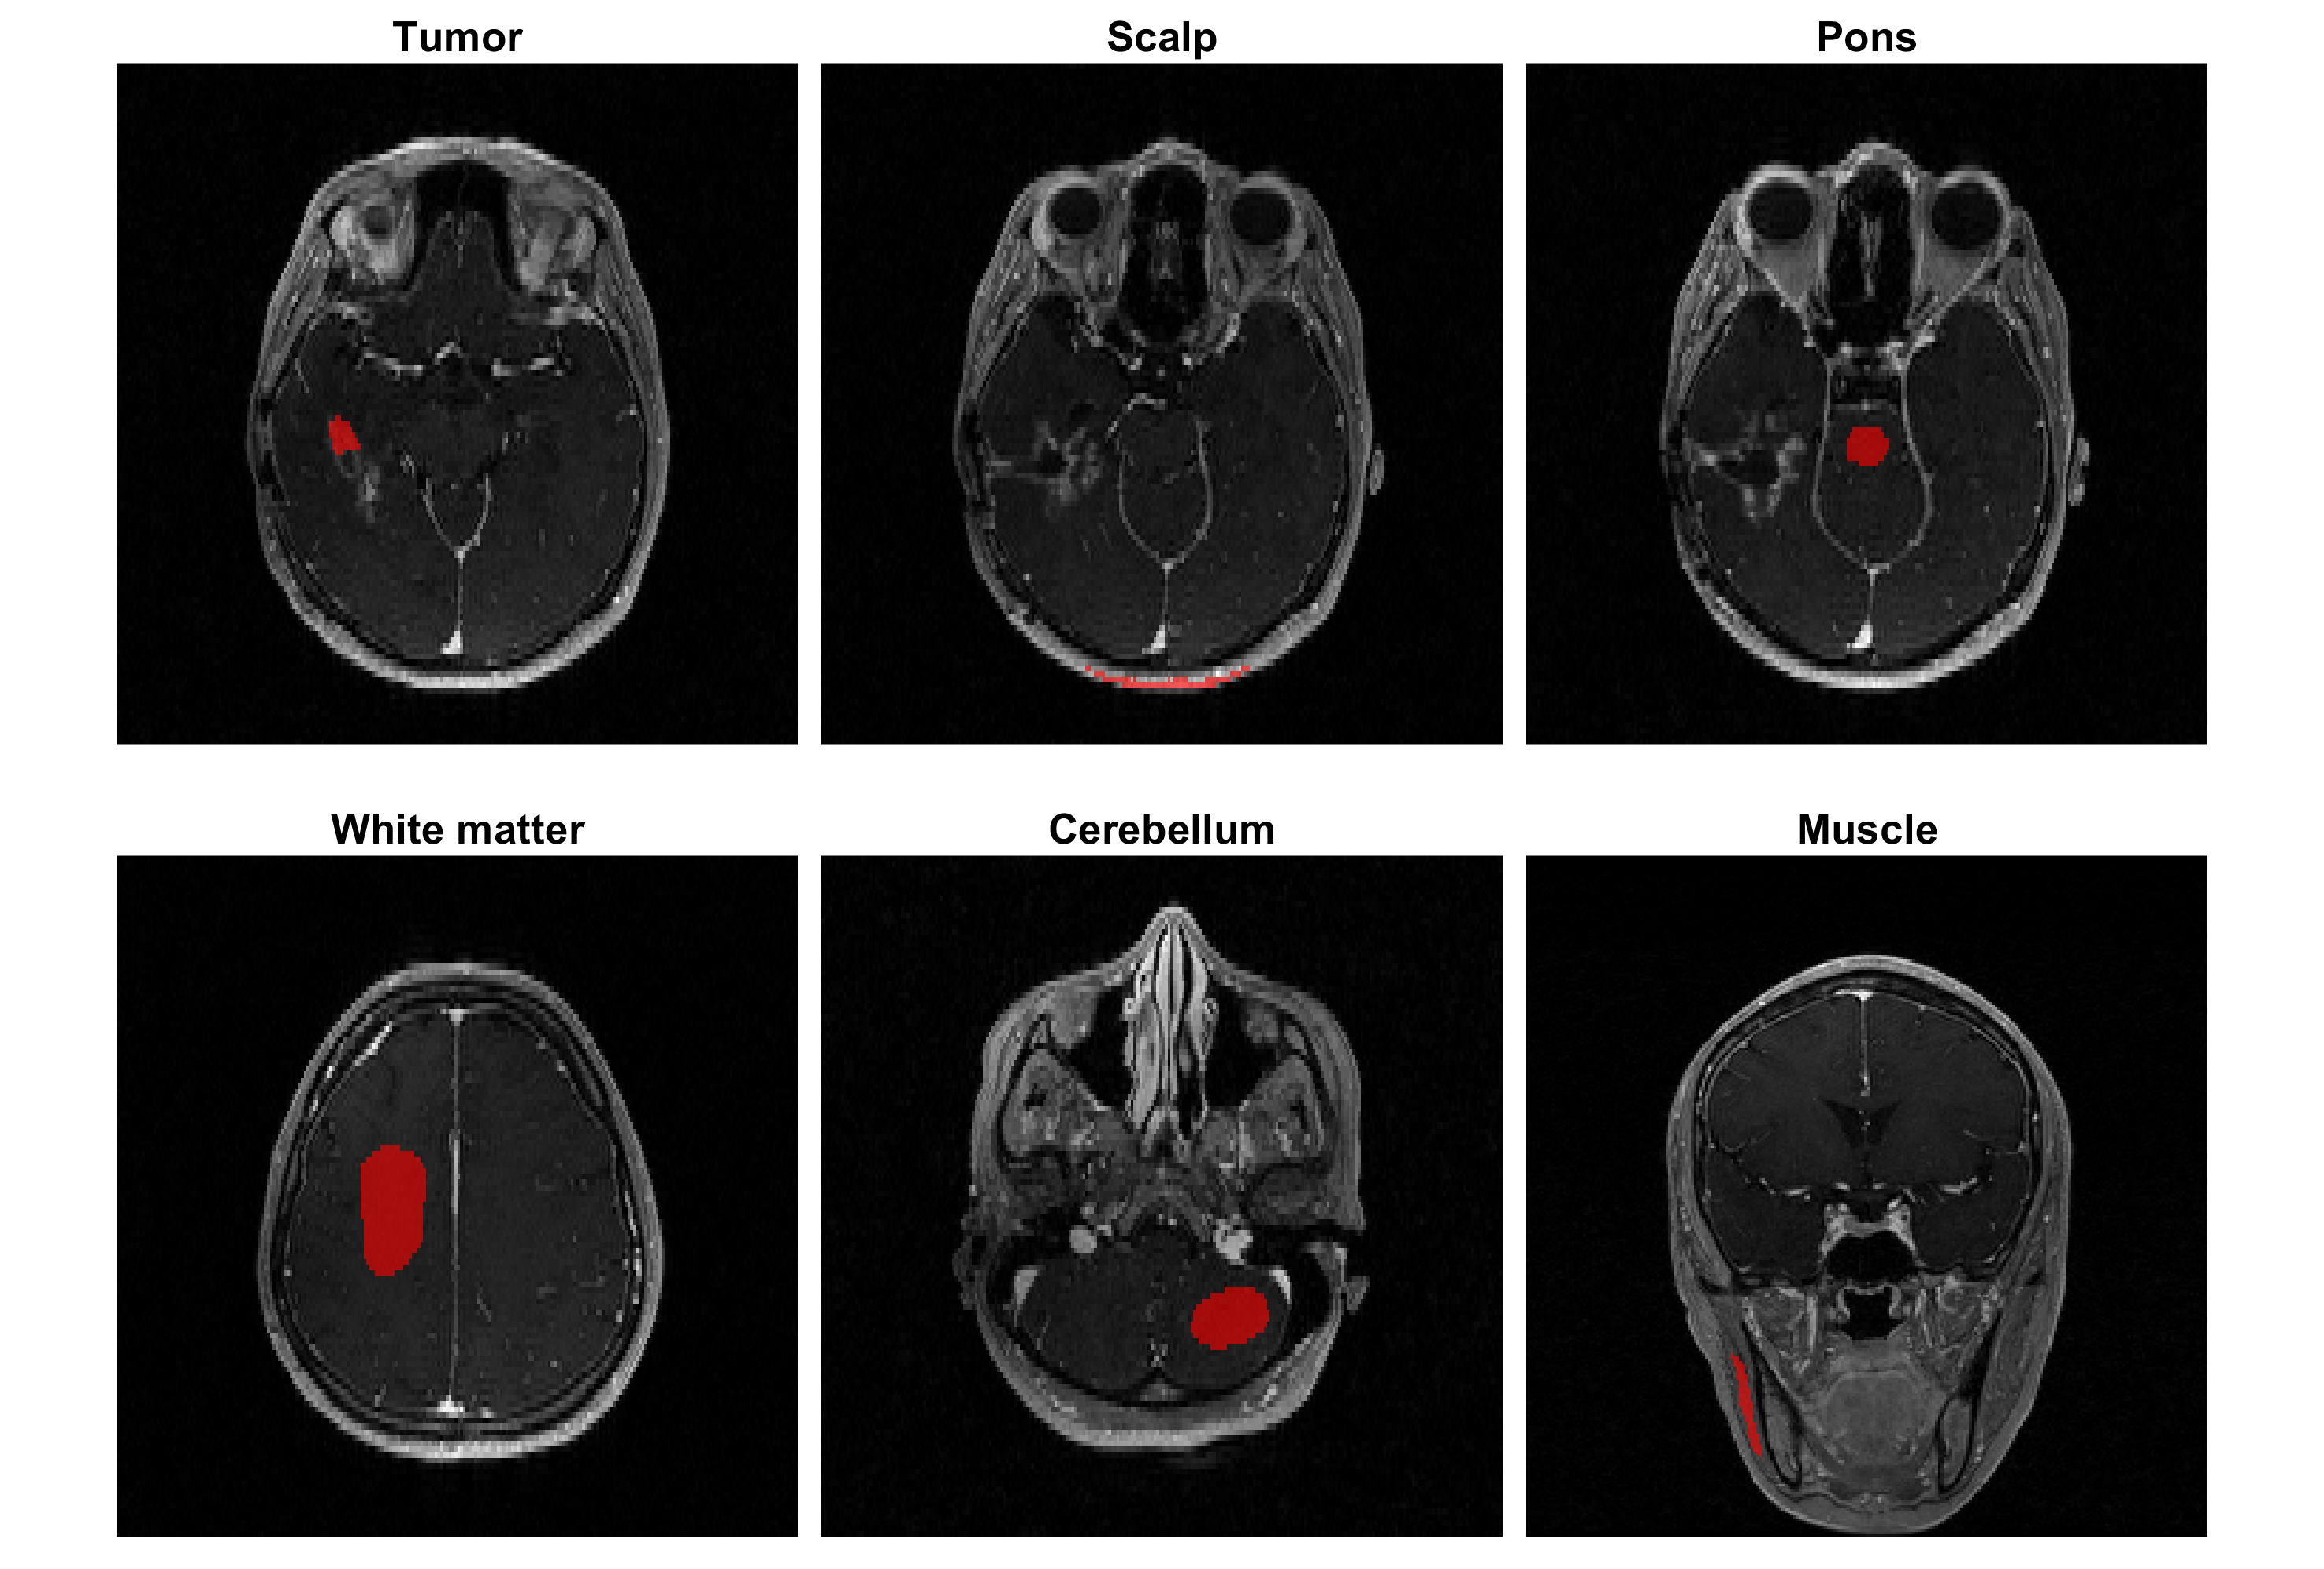
Figure 2. Illustrations of ROIs (red) overlayed on post contrast images from a representative subject at the 1st visit. Tumor ROIs were drawn by a board-certified neuroradiologist with 10-years of experience (co-author J.A.) and other ROIs were drawn by Z.Z supervised by J.A. All ROIs were based on axial view except that of muscle for accuracy purpose.
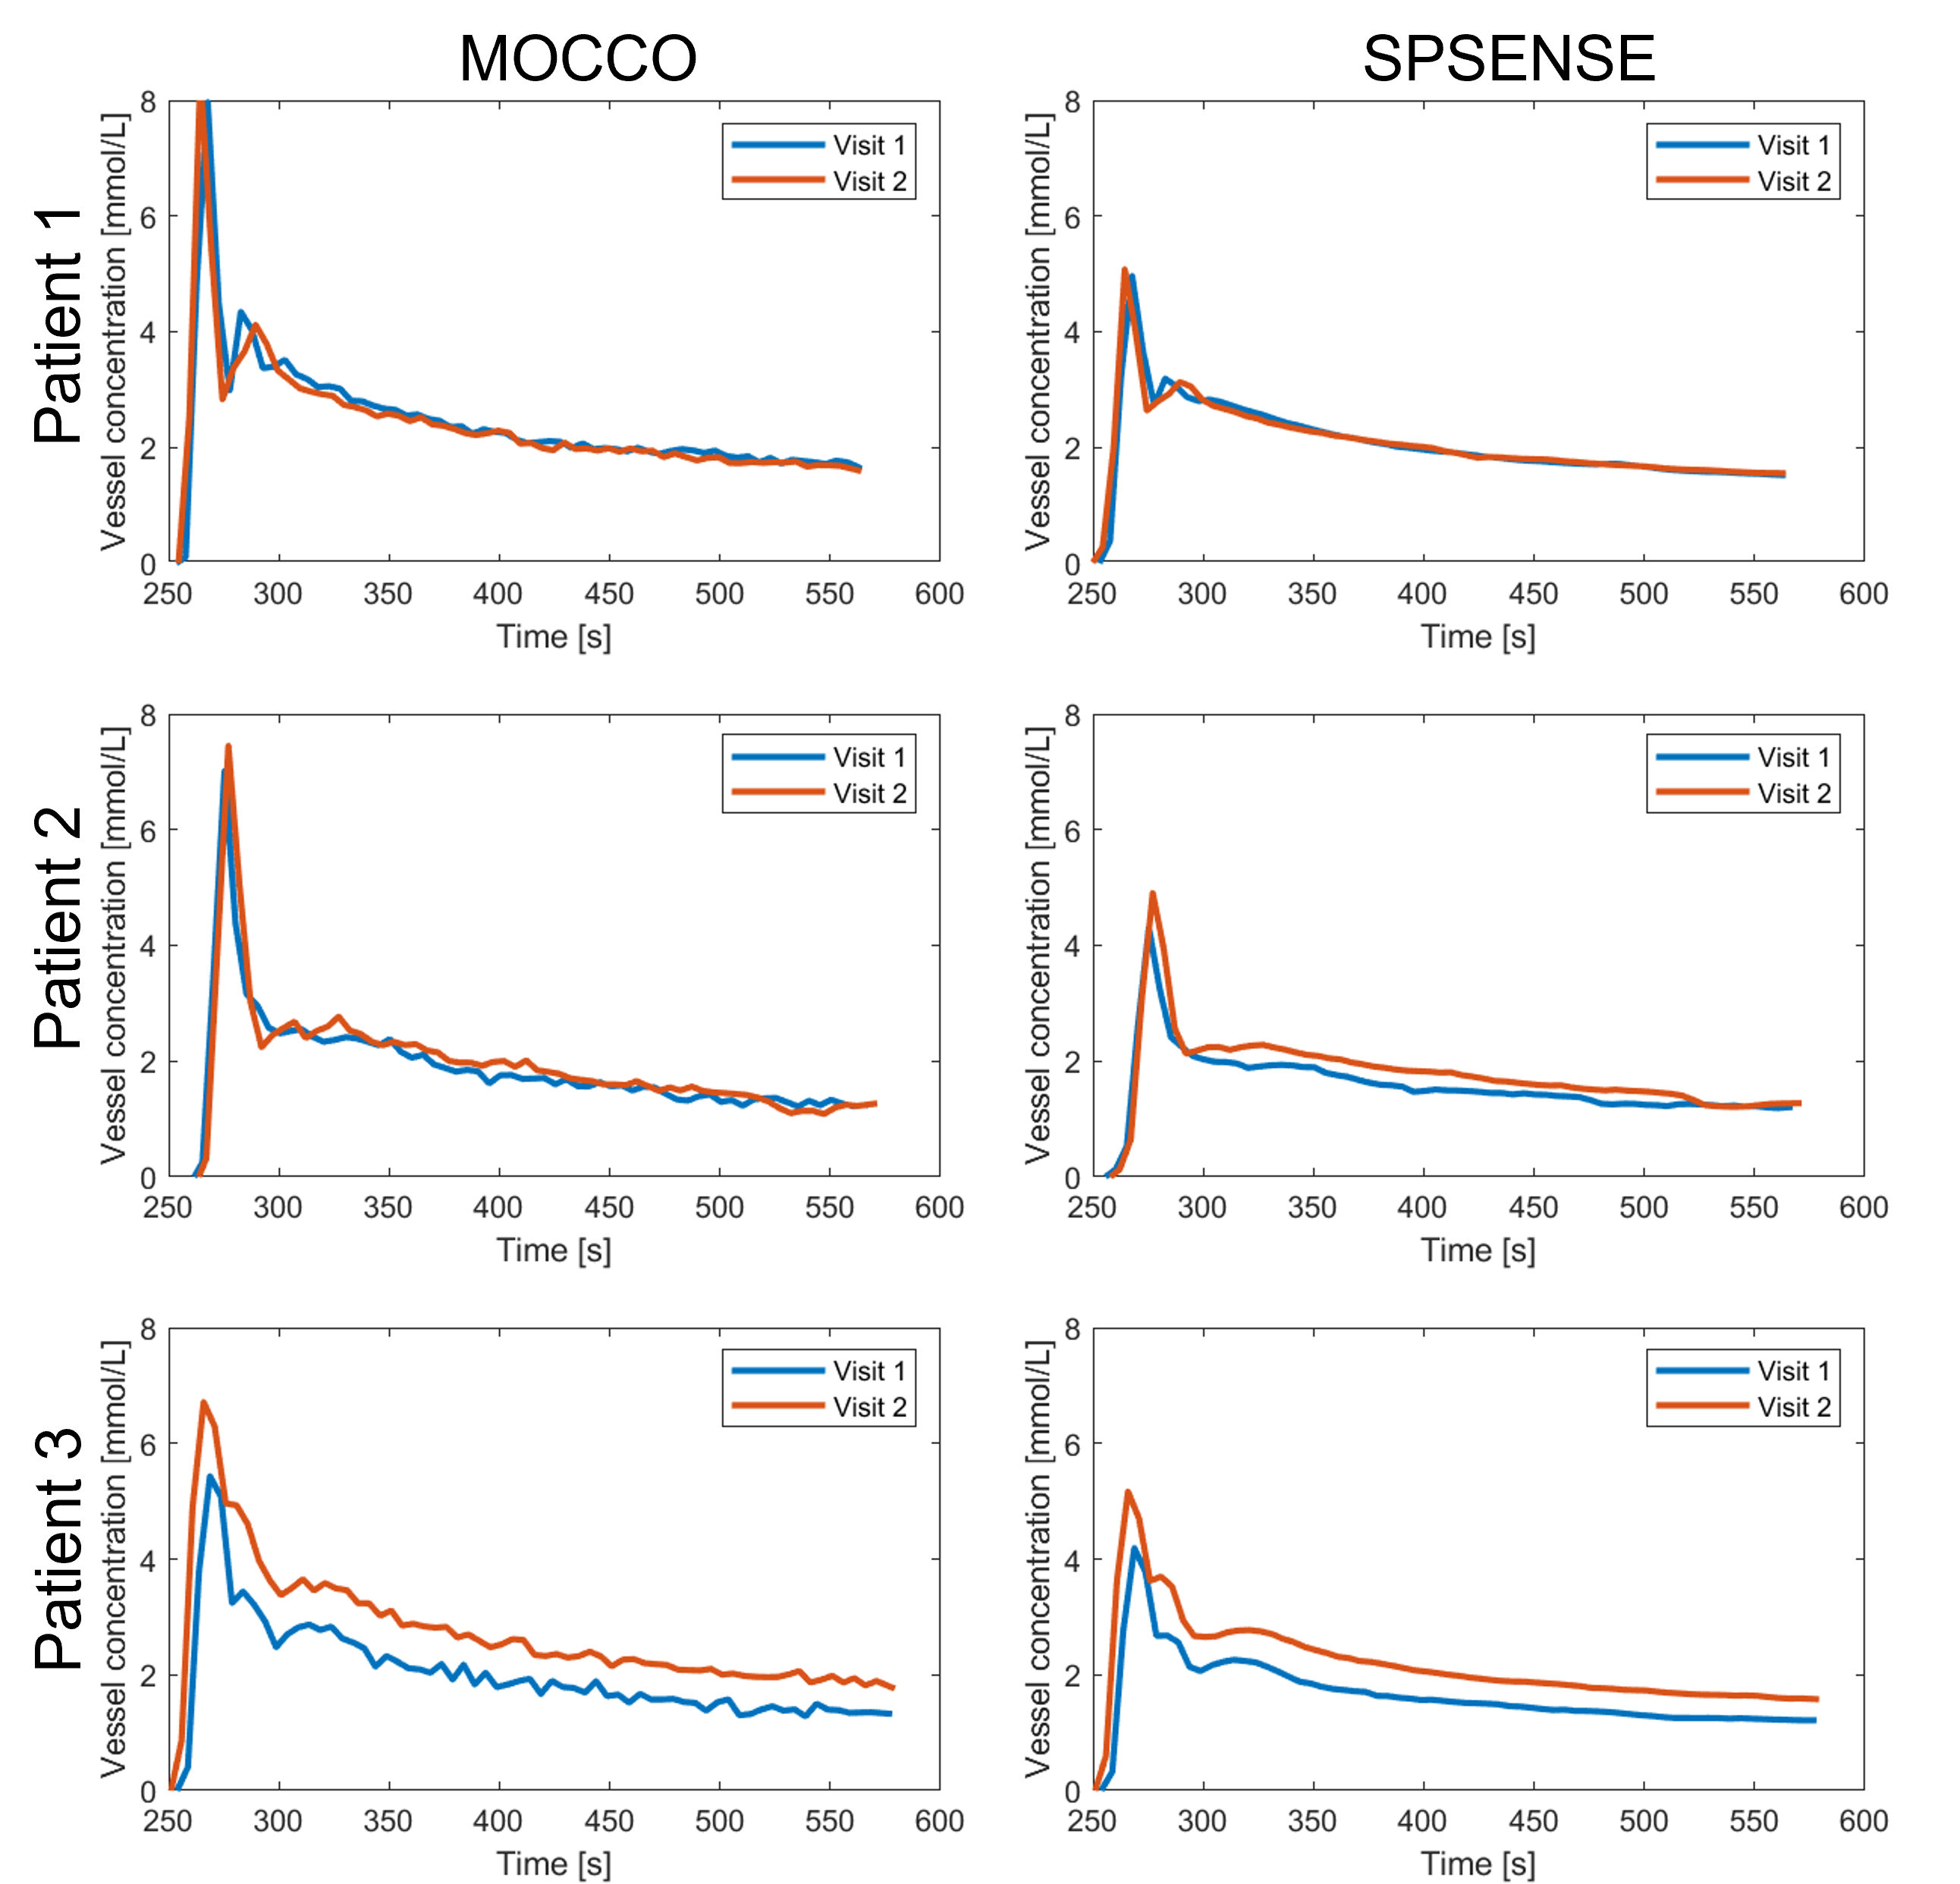
Figure 3. VIF Estimation by (left) MOCCO and (right) SPSENSE from both scans (1st: blue, 2nd: red) of 3 representative subjects (row 1-3).
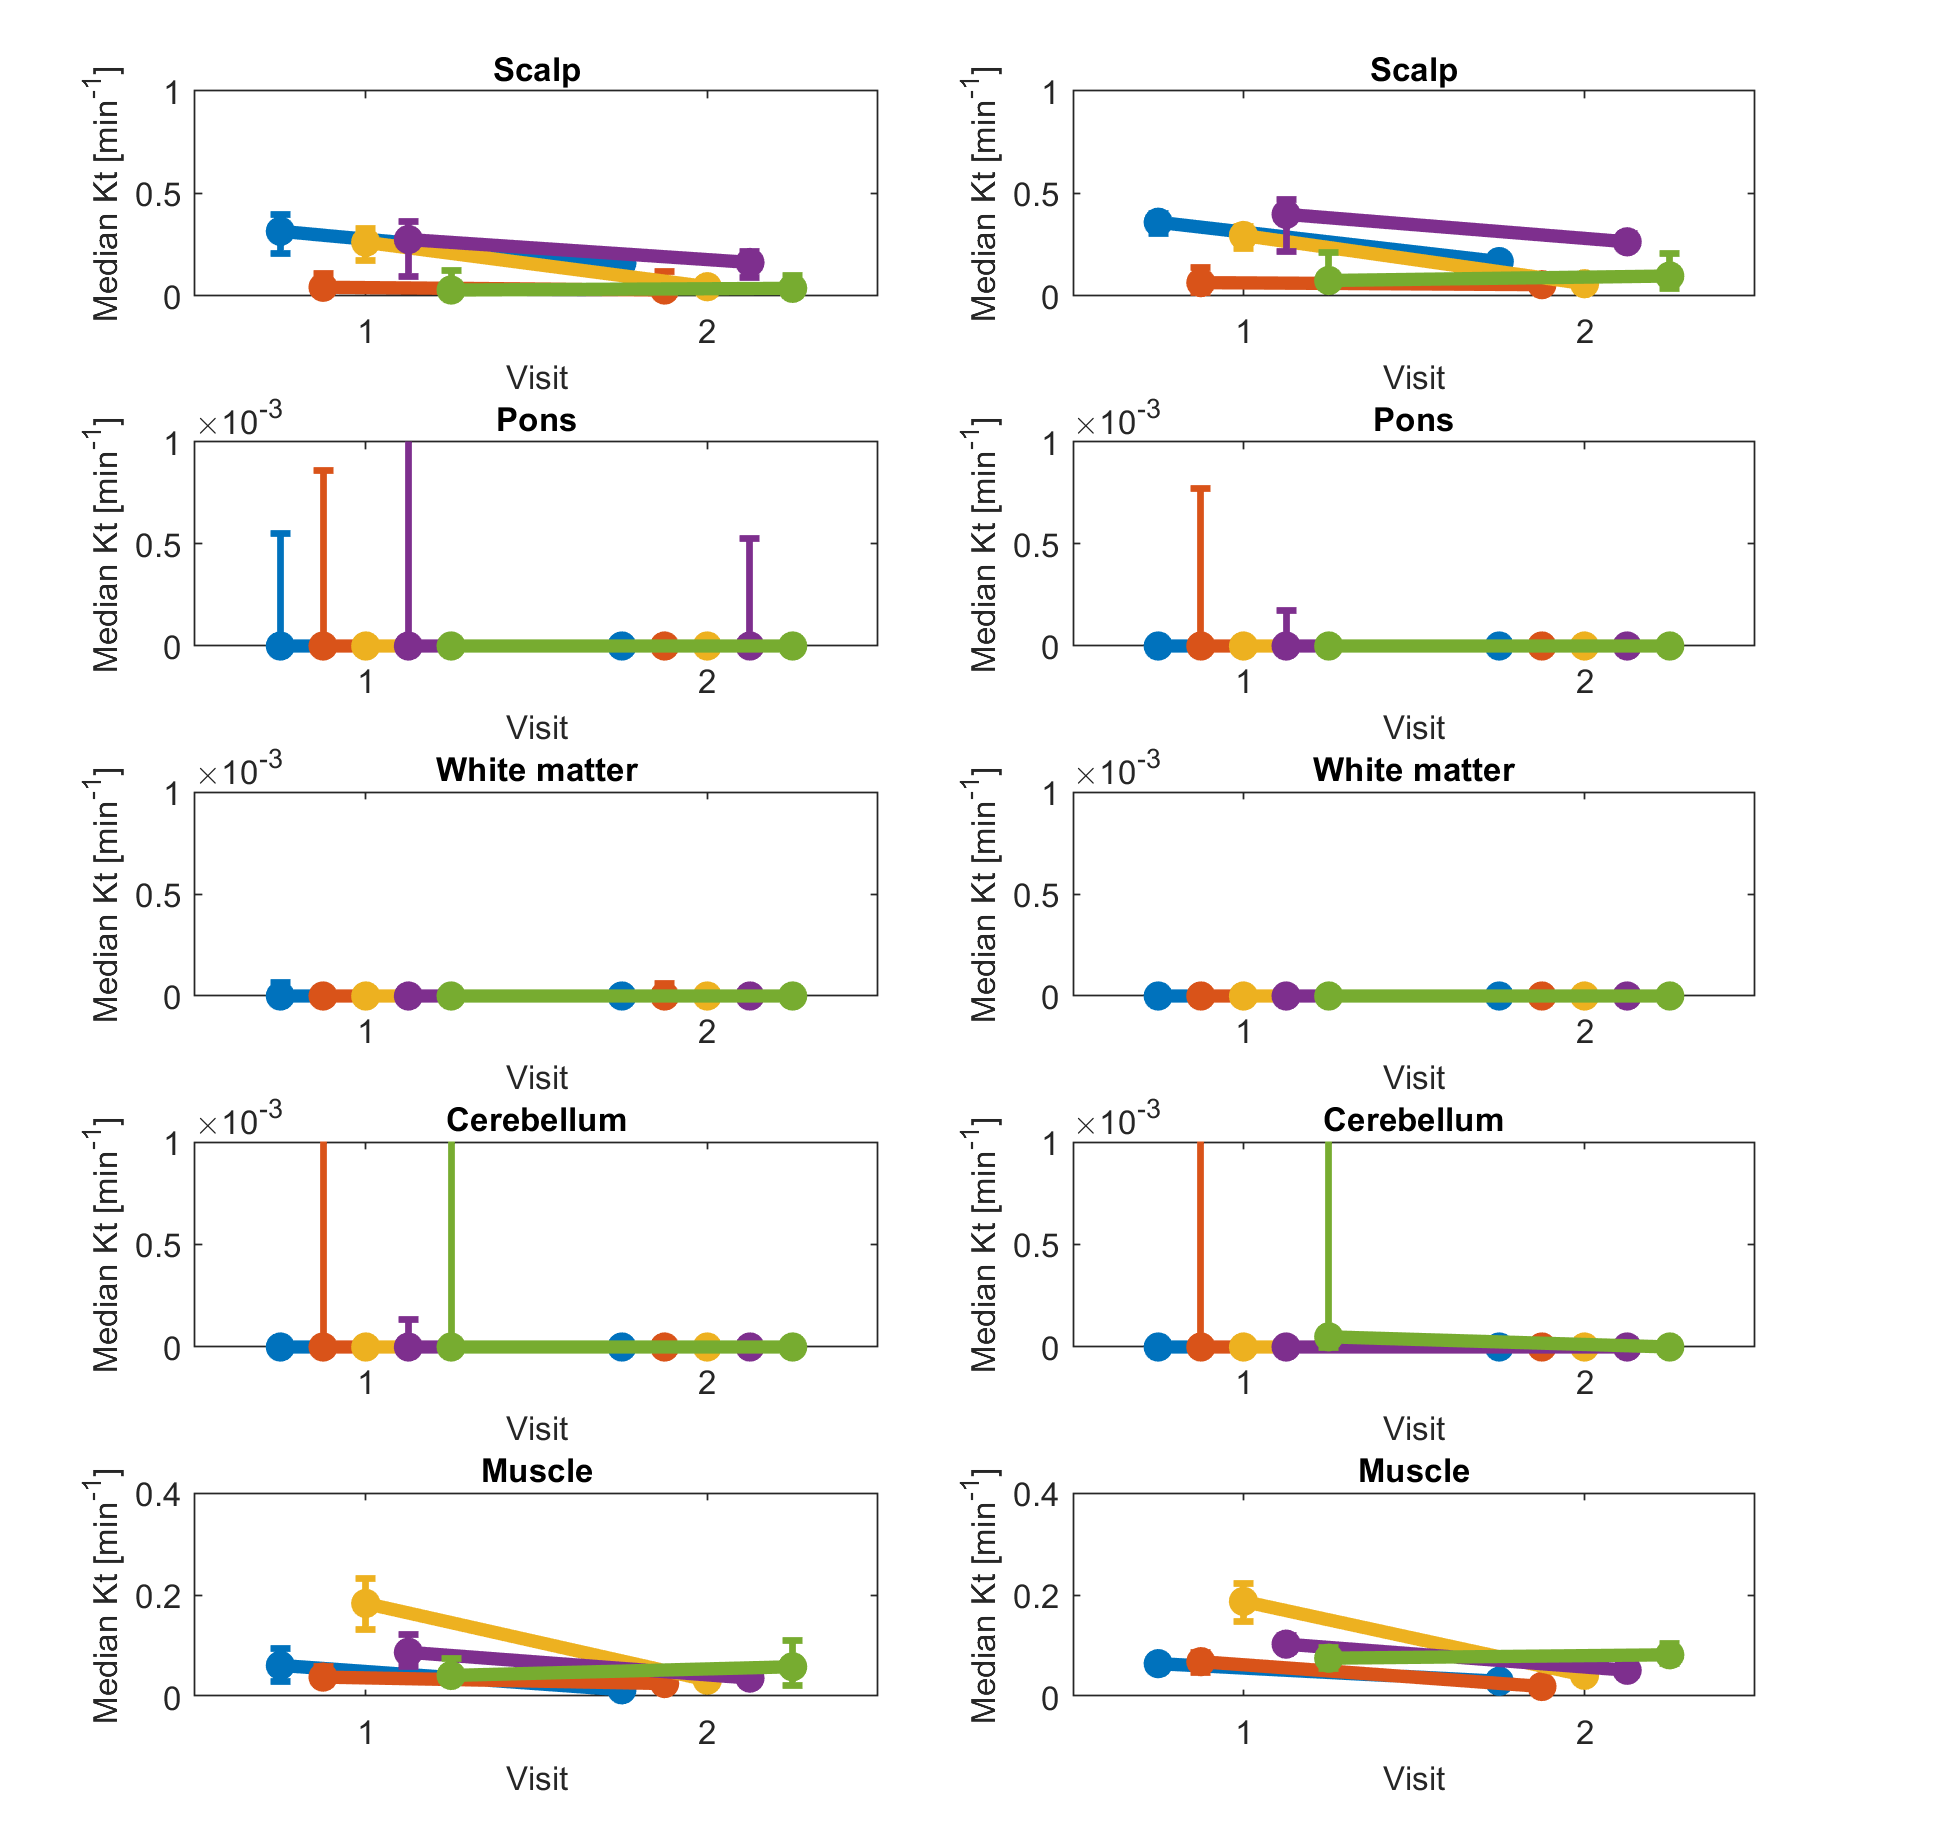
Figure 4. Graphs show median Kt in five non-tumor ROIs shown in Figure 2 for two visits. Each row corresponds to different tissue. Left column shows results for model consistency constrained reconstruction, and right column shows sparse sensitivity encoded reconstruction. Each line corresponds to different participant. Error bars show interquartile range (25th to 75th percentile) for each participant, visit, and tissue ROI.
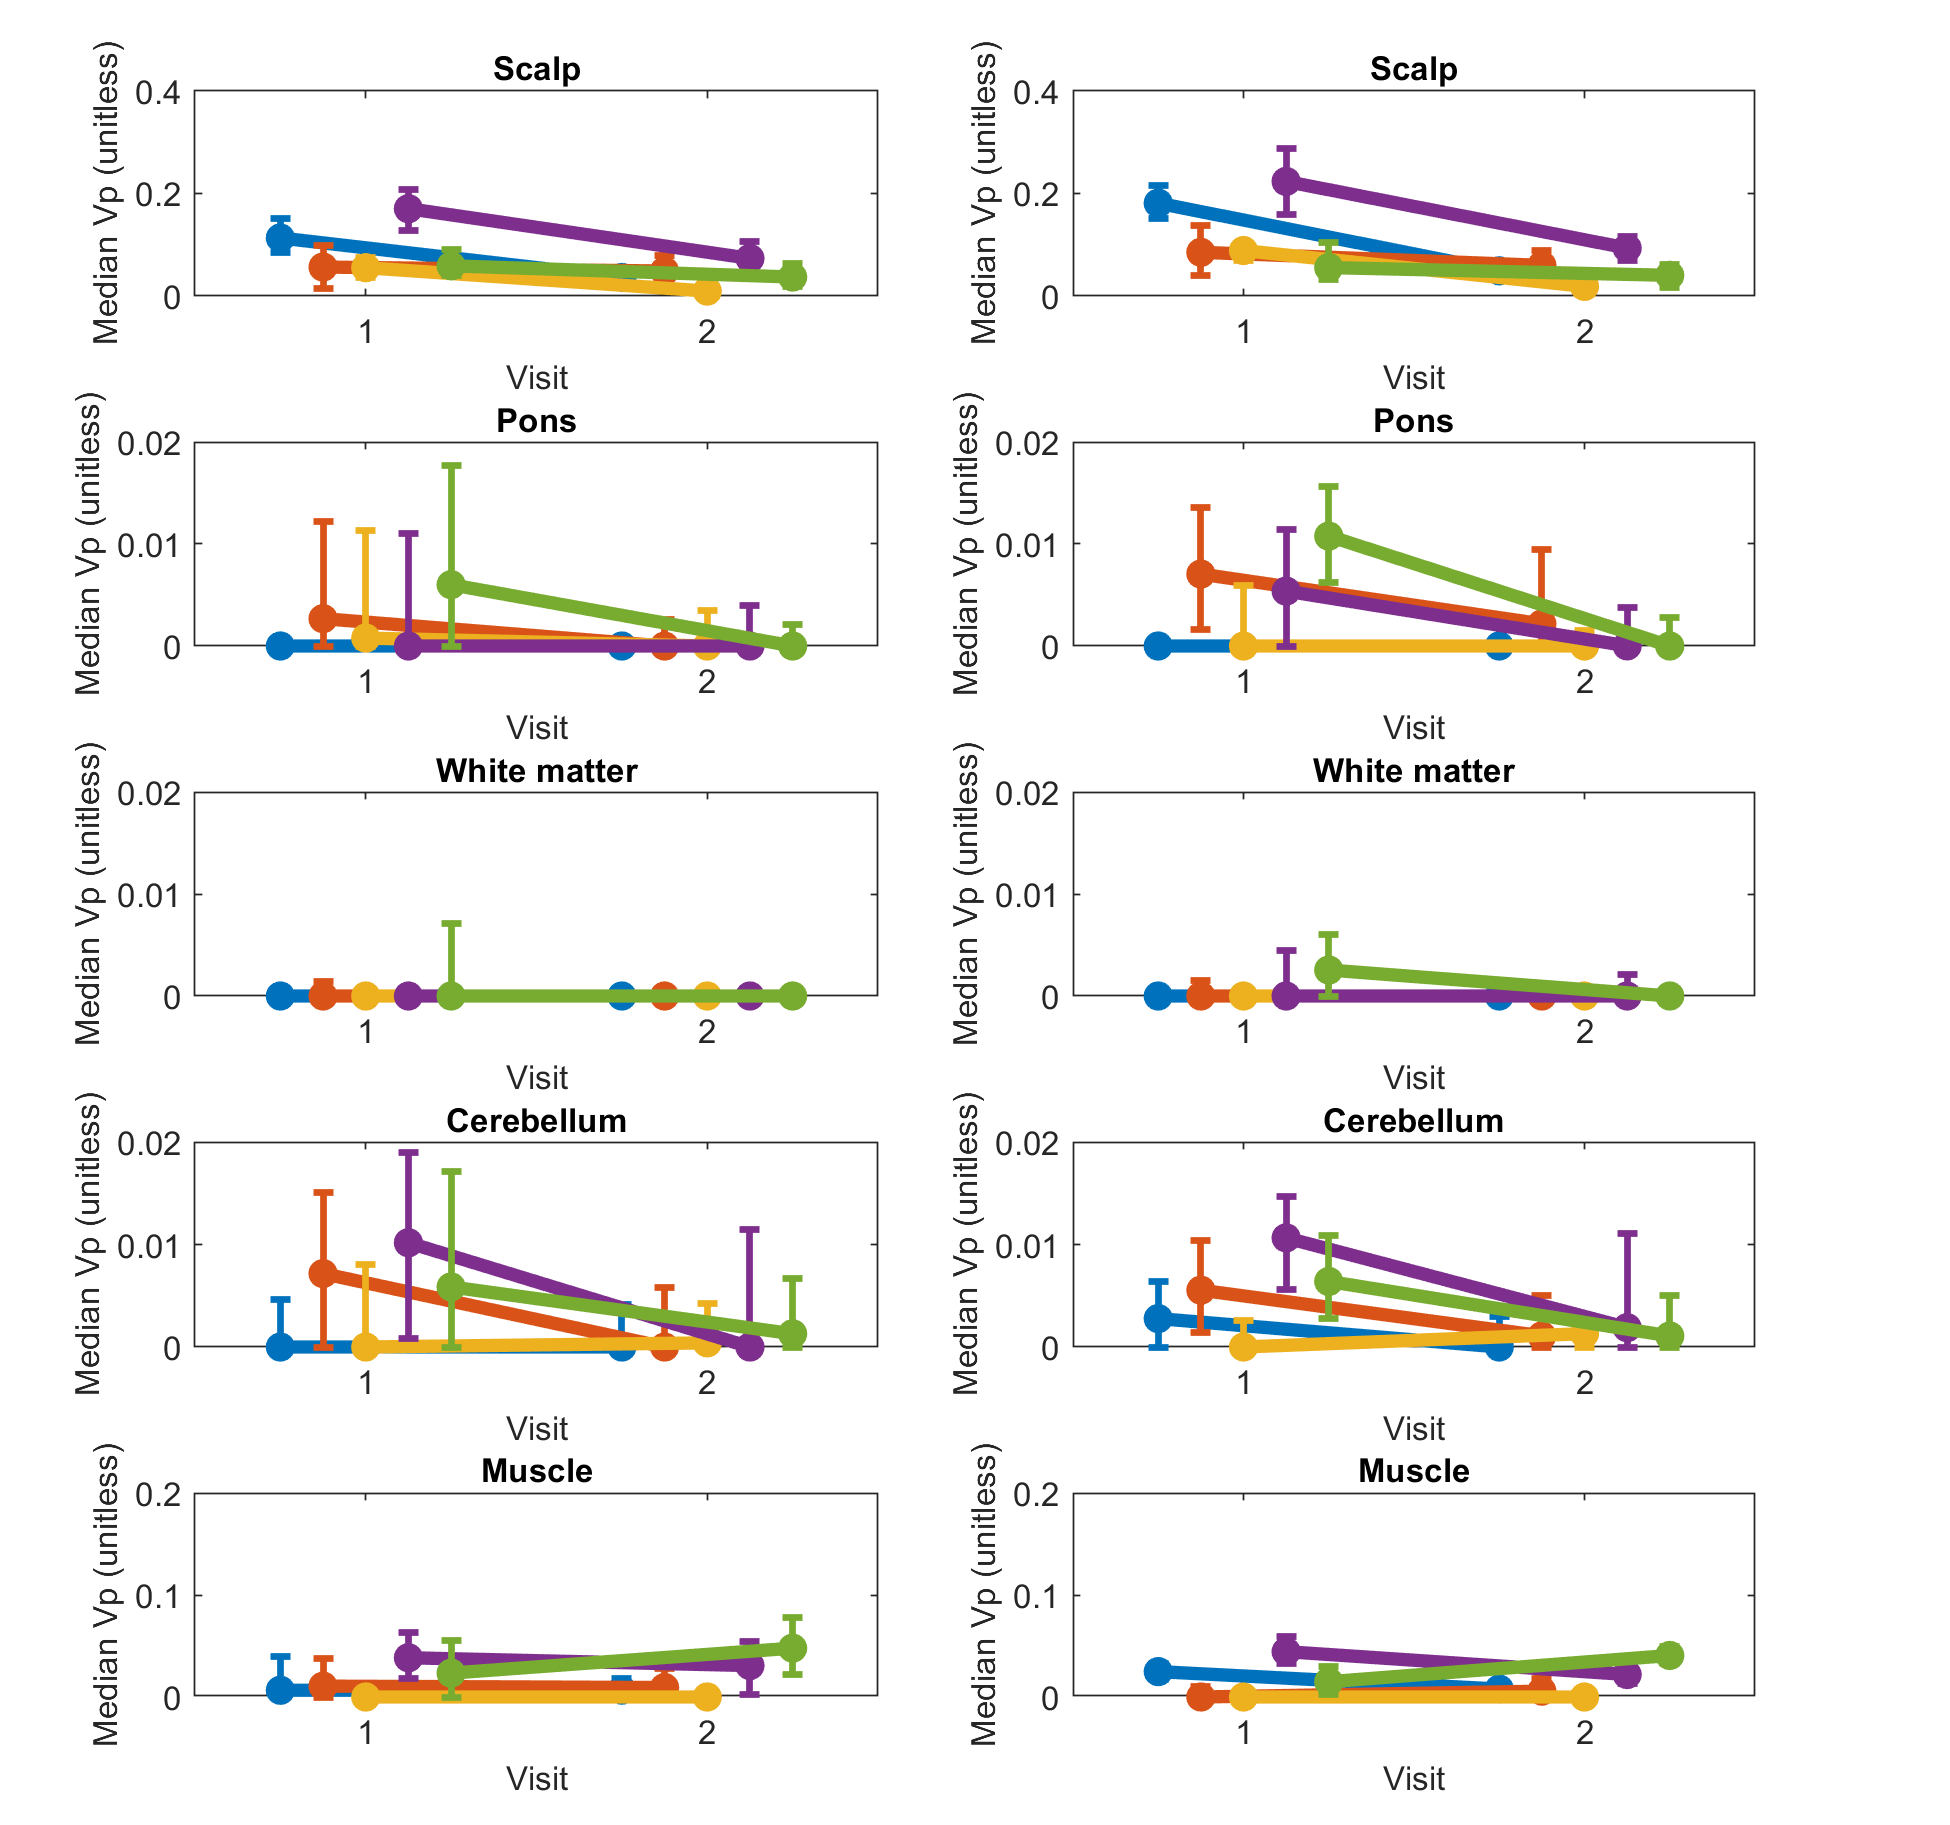
Figure 5. Graphs show median vp in five non-tumor ROIs shown in Figure 2 for two visits. Each row corresponds to different tissue. Left column shows results for model consistency constrained reconstruction, and right column shows sparse sensitivity encoded reconstruction. Each line corresponds to different participant. Error bars show interquartile range (25th to 75th percentile) for each participant, visit, and tissue ROI.
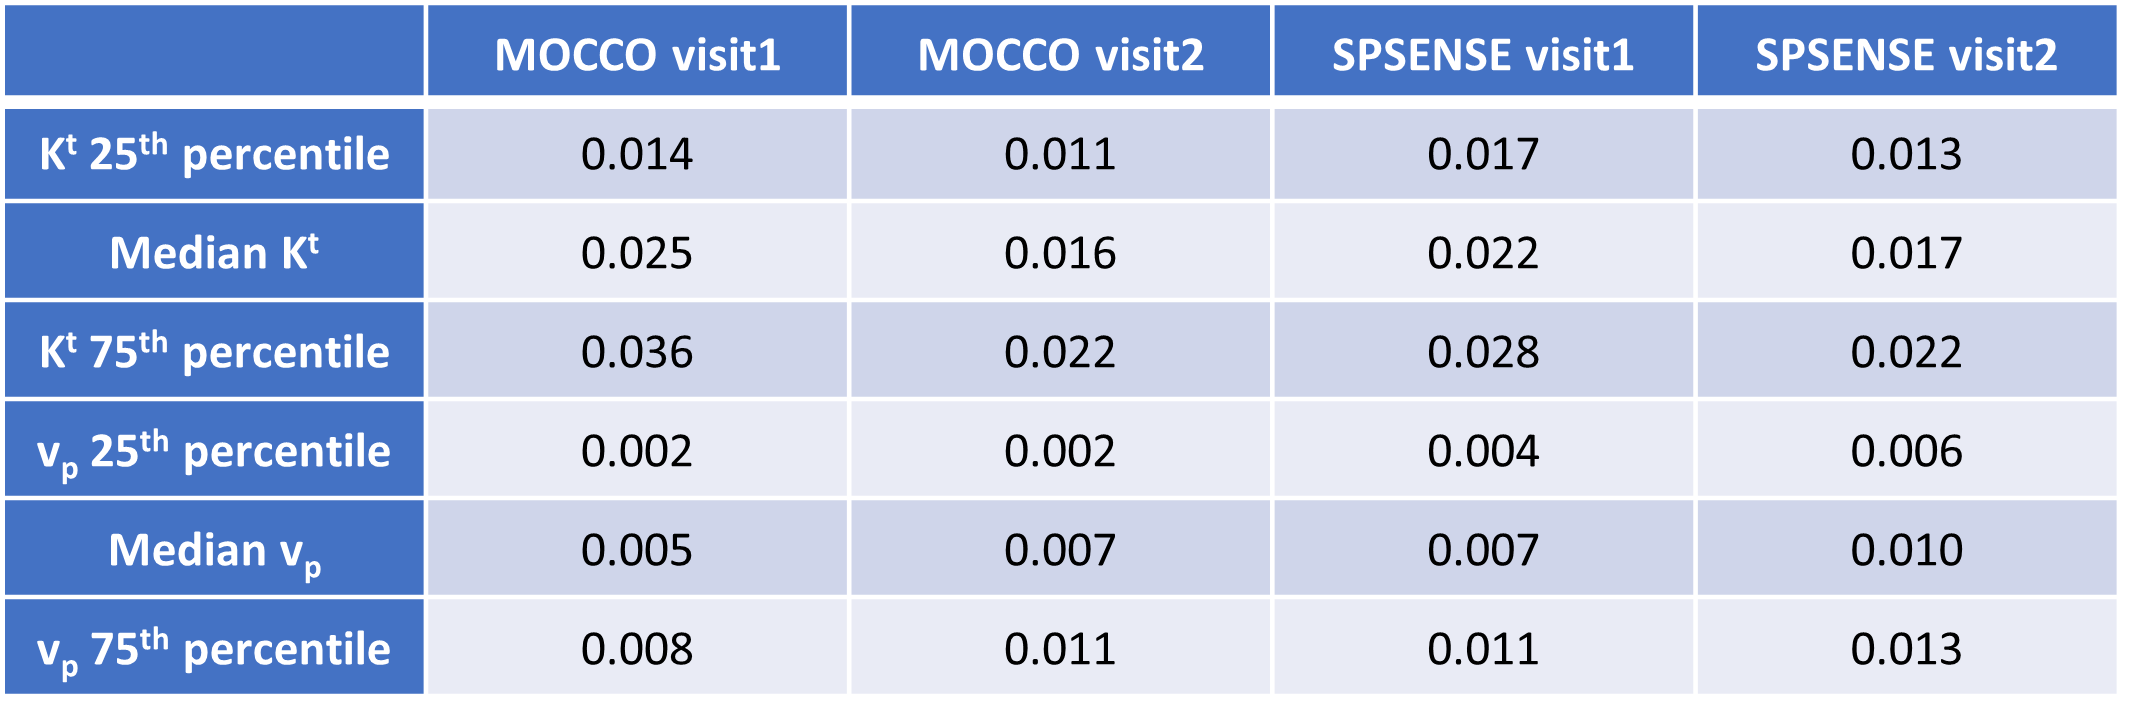
Table 1. Histogram statistics for Kt and vp. 25th, 50th (median), and 75th percentile of Kt and vp in the tumor ROI of two visits by two methods. The performance of MOCCO and SPSENSE was like that in non-tumor ROIs, as illustrated in Figure 4 and 5.