3409
Tracking acute & chronic RT-induced fibrosis in cervical cancer using native & Late-Gadolinium-Enhancement Short-Inversion-Time (STIR) UTE1Johns Hopkins School of Medicine, Washington, DC, United States, 2Radiation Oncology and Molecular Radiation Sciences, Johns Hopkins School of Medicine, Baltimore, MD, United States, 3Siemens Medical Solutions, Boston, MA, United States, 4MR Applications Predevelopment, Siemens Healthcare GmbH, Erlangen, Germany, 5Cardiology, Johns Hopkins School of Medicine, Baltimore, MD, United States, 6Radiology, Stanford University, Stanford, CA, United States
Synopsis
Imaging the temporal evolution of post-radiation fibrosis, which forms in irradiated tissues, supports quantifying tumor response and estimating surrounding-tissue injury. Five cervical cancer patients were scanned pre-external-beam-radiotherapy (EBRT), during and after EBRT, and 3-months post-EBRT and High-Dose-Rate (HDR) brachytherapy. A novel stack-of-spirals STIR-UTE sequence (TI=60ms) was used to image acute-fibrosis, utilizing collagen-bound-water’s short T2* and T1, and Late-Gadolinium-Enhancement (11-15min post-contrast) IR-UTE sequence (TI=200ms) to image chronic-fibrosis, utilizing scar’s slow-contrast-perfusion. Acute-fibrosis spatial-distribution followed EBRT and brachytherapy dose distributions. Over time, acute-fibrosis was converted into chronic-fibrosis. This is important as it forms the basis to guide radiation-therapy for re-irradiation and adaptive-planning.
Introduction
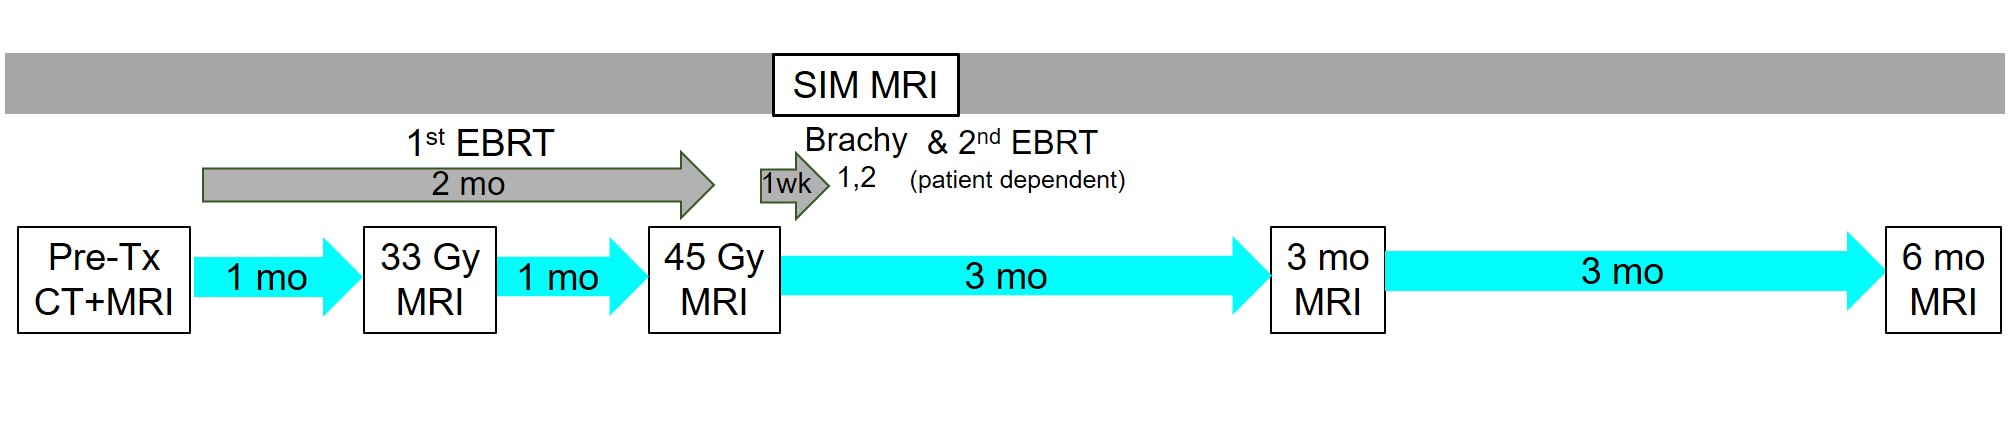
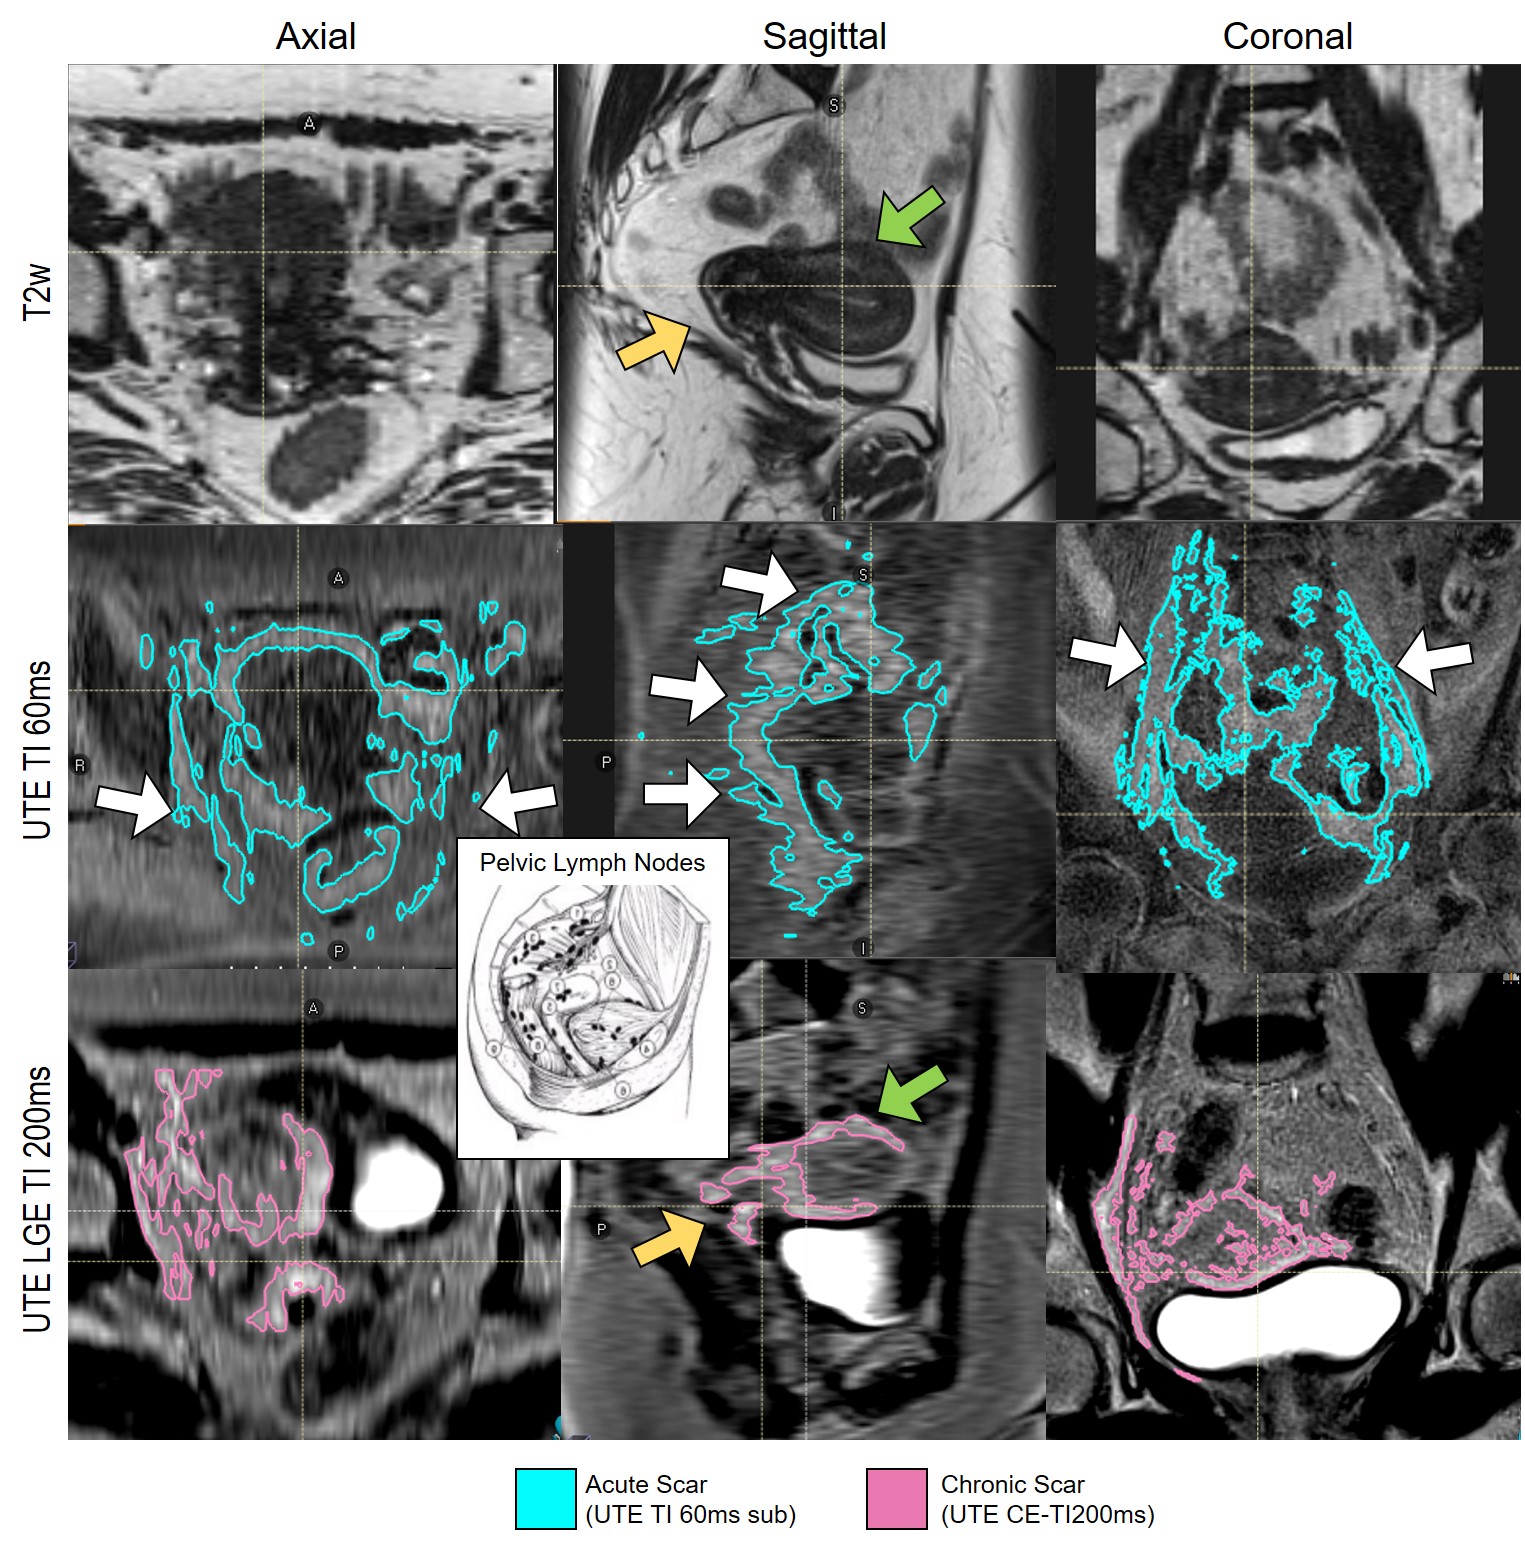
Radiation-induced fibrosis occurs following EBRT and brachytherapy intended to target malignancies. These regions are first infused with inflammatory fibroblasts (1,2), which deposit collagen layers that later remodel into denser matrices forming scars. Although this is essential for mechanically stabilizing the necrotic radiated regions, it leads to adverse effects (inelasticity, bleeding, fistula) when excessive. Medical interventions exist that attempt to alter the course of fibrosis accumulation and remodeling (2). Small-animal microscopy showed (3) that fibrosis forms early on during RT, with continued-growth and reduction in Extracellular Matrix (“packing”) accelerated in higher-dose regions. MRI can be used to detect chronic-fibrosis through Late-Gadolinium-enhancement (LGE) (4), T1-mapping (5), or dedicated contrast-agents (6), but methods to detect acute-fibrosis with 1H MRI are lacking. We and others (7,8) previously demonstrated in collagen/aqueous-solution mixtures, similarly to water within bones (9), the ability to quantify small (>5%) collagen fractions with spiral Short-Inversion-Time Ultrashort echo-time (STIR-UTE) scans (7) that also have shorter spin-relaxation times that strongly attenuate fat and muscle (7), since both T2* and T1 of water bound to collagen are short (1.5T: ~750ms, ~80ms, respectively). In normal volunteers (7), collagen fractions in the pelvis corresponded to literature-reports. MRI is increasingly being used in RT-planning for accurate treatment delivery, while its use in therapy monitoring is emerging. In this pilot longitudinal study, we scanned 5 cervical-cancer patients during the course of radiation therapy (Figure 1), aiming to detect changes in the tumor/lymph-nodes and its surrounding organs-at-risk (OAR). We performed double-echo IR-UTE with TI=60ms and subtracted the 2nd-echo image to obtain the acute-fibrosis map, and also single-echo IR-UTE 11-13 min following contrast-administration, thereby replacing the conventional IR-Gradient-Echo LGE for chronic-fibrosis (scar) imaging. Maps of acute and chronic fibrosis at various stages of therapy were extracted, overlaid on diagnostic T2-weighted images and spatially registered with EBRT and brachytherapy dose distributions. Note that there exists a complimentary mechanism for the short T2*, short T1 hyper-enhanced voxels (e.g. acute-fibrosis) that will be demonstrated in STIR-UTE following radiation delivery, this being conversion of hemoglobin to the paramagnetic meta-hemoglobin. This mechanism delivers acute hyper-enhancement at locations where radio-frequency ablation lesions receive thermal doses exceeding necrosis thresholds (6), possibly playing a role here as a result of radiation’s (7) interaction with red-blood cells.Methods
Subjects: Five cervical-cancer patients undergoing concurrent chemoradiation were included. Imaging was performed prior to radiation, after 33 Gy and 45 Gy EBRT radiation to the pelvis and lymph nodes, and 3-months after HDR (tandem and interstitial needles) brachytherapy was completed.Image Acquisition: Imaging was performed in 1.5T MRIs (Siemens Aera and Sola) using the abdominal and spine arrays. Prototypical stack-of-spirals (Slice-direction centric-ordered phase-encoding) double-echo (TE=50,2690µs, TR/Ɵ=7ms/8°), STIR UTE with TI=60,80,100ms (TRelax=676-716ms), resolution=1.0x1.0x2.5mm3, 220spirals/slice, FOV=390mm, #Slices/vol=88, Readout-duration/spiral=1800ms, Averages=3, NUFFT reconstruction. The 2nd-echo was subtracted from the 1st-echo to obtain the short TE-only image. Conventional sequences (2D&3D T2w, 3D fatsatT1w pre- and post-contrast, DWI, DCE post-contrast), were also acquired.
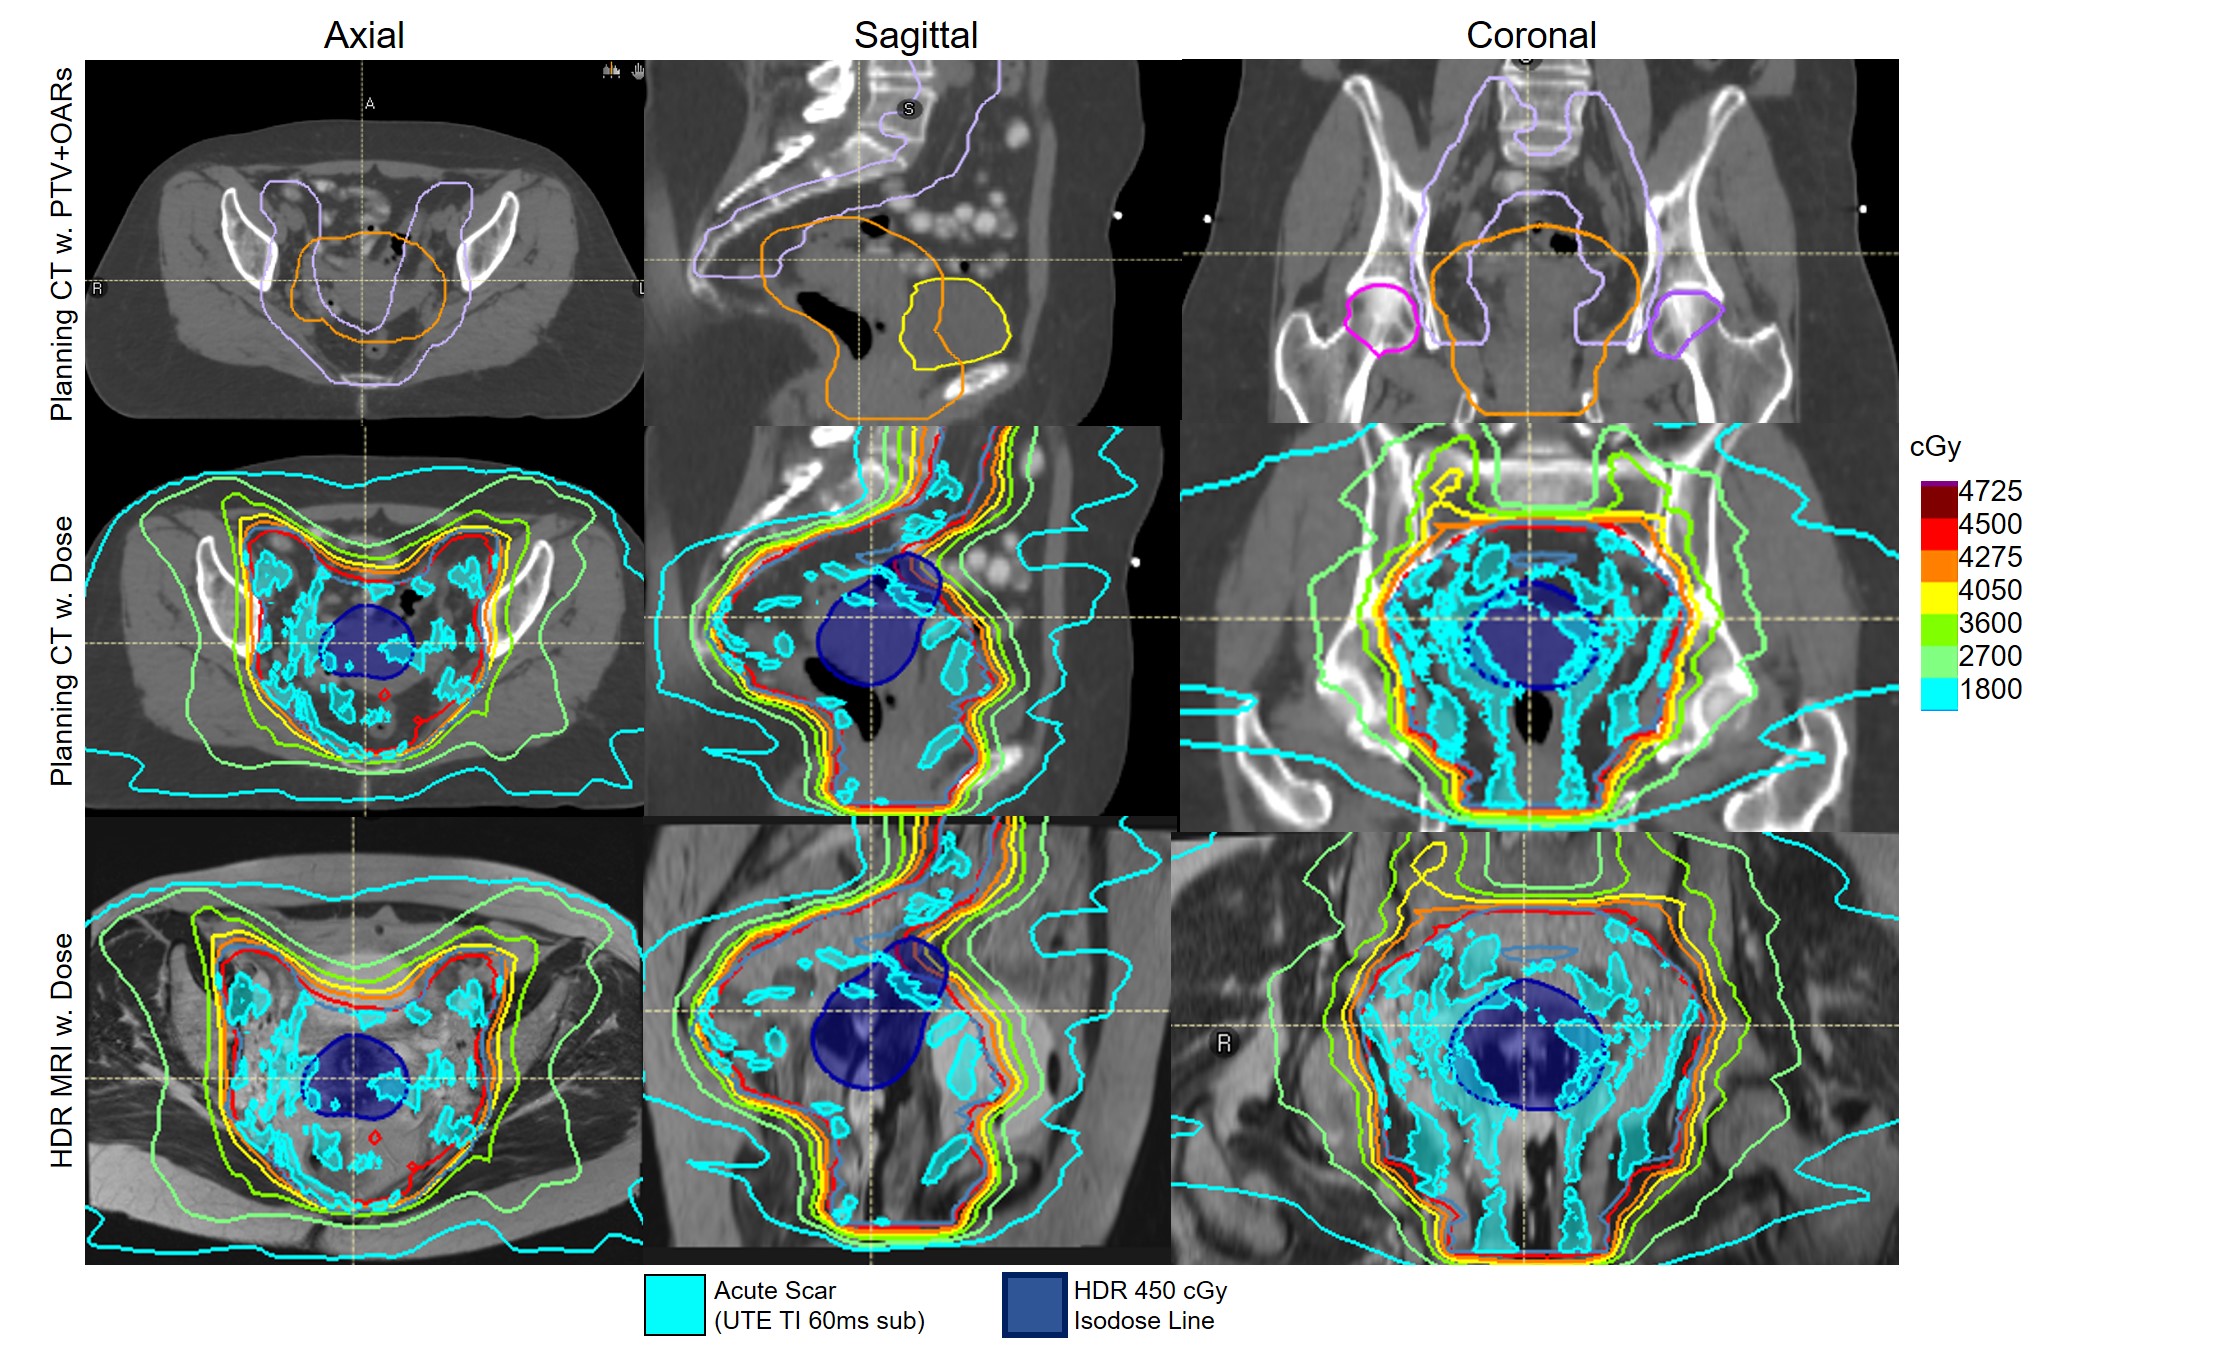
Image Analysis: TI=60ms STIR-UTE was preferred due to a linear collagen-to-pixel-intensity relationship (7) and better fat-suppression. All images and dose distributions were rigidly registered to the treatment-planning CT acquired on the day of radiation treatment. Planning treatment volumes (PTV) and OAR contours were propagated onto the MR images (Figure 2). STIR-UTE images were segmented using a region-growing algorithm (RayStation 10A, Stockholm) and signal-intensity was normalized between successive scans based on the signal-intensity of articular cartilage of both femoral heads. For each time point, acute-fibrosis contours were segmented on the UTE TI=60ms subtraction images and chronic fibrosis contours were segmented on the late-gadolinium-enhanced UTE images (TI=200ms). The fibrosis contours were propagated onto the respective T2w images (Figure 2) and cropped to stay within the PTV (little acute-fibrosis was found outside). The mean dose of the acute fibrosis and chronic fibrosis were determined.
Results
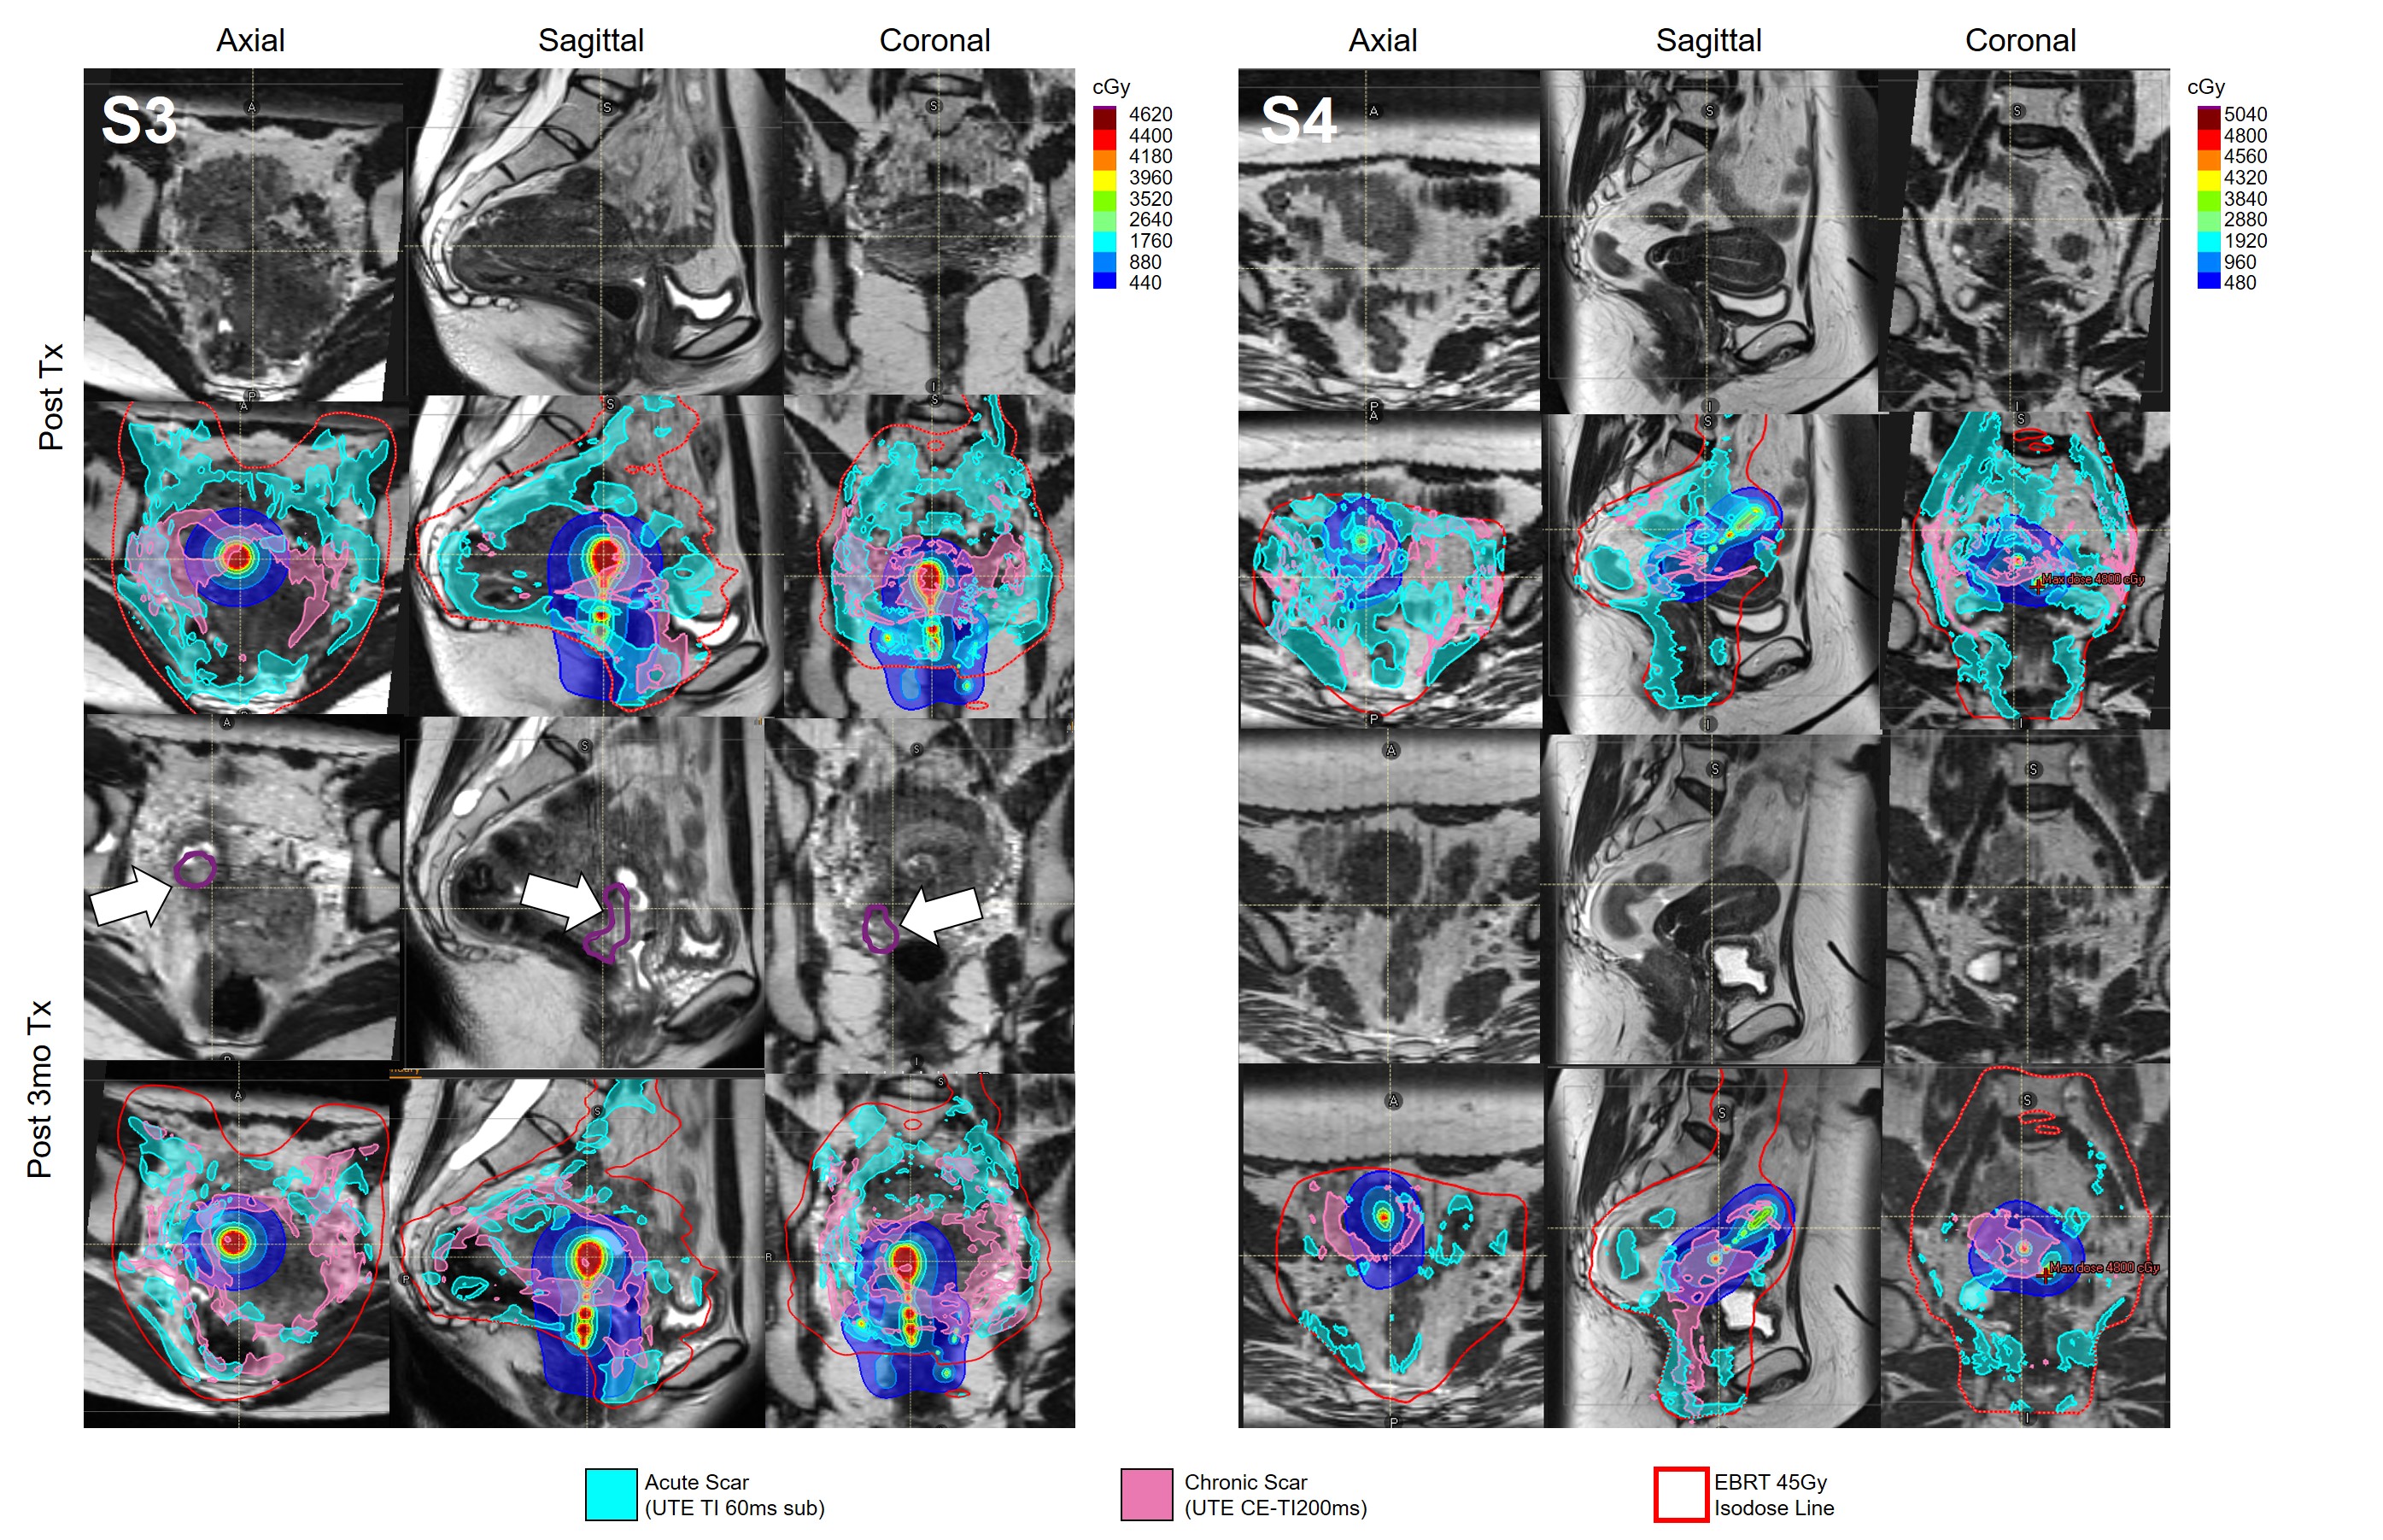
Figure 3 correlates UTE features with the respective anatomy. Figure 4 shows EBRT and brachytherapy dose distributions and their correlation with acute fibrosis intensity levels for S2. Figure 5 shows acute (cyan) and chronic (pink) fibrosis overlaid on the T2 images acquired at the respective time points in two patients (S3, S4), with S3 displaying tumor recurrence at 3mths. The HDR isodose lines are shown in a colormap and the red contour indicates the 45Gy isodose line from the EBRT plan. For both patients, it is apparent that the acute fibrosis, initially covering the pelvic lymph nodes and much of the target, reduces in volume over time. Chronic fibrosis is observed in and around the uterus. There are strong regions of overlap between the acute and chronic fibrosis regions, suggesting conversion of acute to chronic fibrosis. For S3, mean brachytherapy doses of the acute and chronic regions were 220cGy and 411cGy, respectively. For S4, mean brachytherapy doses of the acute and chronic regions were 266cGy and 498cGy, respectively. The mean EBRT doses were 4600cGy.Conclusions
In this feasibility study, a novel method to measure acute post-radiative fibrosis was evaluated in patients at 4 time points after EBRT and brachytherapy. It was compared to measurements of chronic fibrosis based on late Gadolinium-contrast perfusion. A reduction in acute-fibrosis and conversion to chronic-fibrosis was observed over time. Higher mean brachytherapy doses were observed in the chronic fibrosis regions.Acknowledgements
NIH R01EB020667, R01HL094610, R01CA237005References
References:
[1] Straub JM, New J, Hamilton CD, Lominska C, Shnayder Y, Thomas SM. Radiation-induced fibrosis: mechanisms and implications for therapy. Cancer Res Clin Oncol. 2015; 141: 1985–1994.
[2] Citrin D, Prasannab P G S, Walker A J, Freemand M L, Ekea I, Barcellos-Hoffe M H, Arankalayila M J ,Cohen E P, Wilkins R C, Ahmed M M, Anscher M S, Movsasi B, Buchsbaumb J C, Mendonca M S, Wynnk T A, Coleman C N. Radiation-Induced Fibrosis: Mechanisms and Opportunities to Mitigate. Report of an NCI Workshop, September 19, 2016, Radiat Res. 2017; 188: 1–20.
[3] Kotova SL, Timashev PS, Belkova GV, Kochueva MV, Babak KV,Timofeeva VA, Kiseleva EB, Vasilieva OO, Maslennikova AV and Solovieva AB, Early Effects of Ionizing Radiation on the Collagen Hierarchical Structure of Bladder and Rectum Visualized by Atomic Force Microscopy, Microscopy and Microanalysis 2018; 24:38-48
[4] Kim RJ, Fieno DS, Parrish TB, Harris K, Chen EL, Simonetti O, Bundy J, Finn JP, Klocke FJ, Judd RM. Relationship of MRI delayed contrast enhancement to irreversible injury, infarct age, and contractile function. Circulation 1999; 100: 1992–2002.
[5] Messroghli DR, Radjenovic A, Kozerke S, Higgins DM, Sivananthan MU Modified Look‐Locker inversion recovery (MOLLI) for high‐resolution T1 mapping of the heart. Magn Reson Med 2004; 52:141–146.
[6] Caravan P, Das B, Dumas S, Epstein FH, , Helm PA, Jacques V, Kolodziej A, Shen L, Sun W-C, Zhang Z. Collagen‐Targeted MRI Contrast Agent for Molecular Imaging of Fibrosis. Angewandte Chemie 2007;119, 8319-8321
[7] Schmidt E J, Muradyan I, Benkert T, Bhat H, Kolandaivelu A, Halperin H R, Viswanathan A N. Imaging wound-healing related fibrosis using short inversion time ultra-short TE (STIR-UTE), Proceedings of the 27th Annual meeting of ISMRM, Montreal 2019, p. 0707
[8] Ramadeen A, Hu X, Morikawa L, Zhang L, Lau JYC, Liu G, Pop M, Connelly KA, Dorian P, Wright GA. Characterization of the ultrashort‐TE (UTE) MR collagen signal, NMR in Biomedicine 2105;28, 1236-1244
[9] Ma Y-J, Jerban S, Jang H, Chang D, Chang EY and Du J (2020) Quantitative Ultrashort Echo Time (UTE) Magnetic Resonance Imaging of Bone: An Update. Front. Endocrinol. 11:567417 [10] Mugler JP III, Fielden SW, Meyer CH, Altes TA, Miller GW, Stemmer A, Kiefer B. Breath-hold UTE lung imaging using a stack-of-spirals acquisition. Proceedings of the 23rd Annual Meeting of ISMRM, Toronto, Canada 2015, p. 1476
Figures