3408
Comparison of [6-17O]glucose metabolism in tumor and normal brain using 9L rat glioma model1CIMAR, NHMFL/FSU, Tallahassee, FL, United States, 2College of Medicine, FSU, Tallahassee, FL, United States, 3NHMFL/FSU, Tallahassee, FL, United States, 4Southwestern Medical Center, UT Dallas, Dallas, TX, United States
Synopsis
Labeled glucose[6-17O] was used to evaluate differences in glucose metabolism between normal and tumor brain tissue. Experiments were performed using an intracranial 9L glioma model at 21.1 T magnet by observing changes of 17O-water and 17O-glucose MR peaks. The estimated rate of the total glucose metabolism in 9L glioma was approximately 11 times more than in the normal brain. Correspondingly, glucose metabolism rate is 7.5 times more in glioma at the enolase step. 17O MRI/MRS is an encouraging tool for assessing the differences in glucose metabolism in various cancer cells.
INTRODUCTION
The scope and significance of ultra-high magnetic field MRI (up to 20 T) is currently under investigation 1,2. Some new MRI capabilities of an ultra-high magnetic field can already be tested utilizing animal models 3-7 and the available 21.1 T magnet. In vivo, the natural abundance of the 17O MR signal ranks third after proton and sodium 1. The current study investigated the extent to which 17O MRI at 21.1 T can be used to explore the difference in tumor glucose metabolism relative to normal brain tissue using an intracranial rat 9L glioma model.METHODS
All animal procedures were approved by the Florida State University Animal Care and Use Committee (ACUC). Male Fisher 344 rats weighing approximately 175 g were obtained from Charles River Laboratories (Wilmington, MA). Animals were randomly assigned to either receive an intracranial implantation of 9L rat glioma cells (n = 5) or remain as controls with no surgery (n = 5). Tumor formation was confirmed and measured by diffusion MRI scans 11 days post-implantation.Prior to the MRI scan, all rats were anesthetized with 3% isoflurane and underwent temporary cannulation of the lateral tail vein. Labeled glucose was administered over 1-1.5 min beginning 10 min after the start of the MR scan and data acquisition. The time courses of the 17O MR signals from glucose[6-17O] and metabolized 17O-water were monitored by using the volume 17O/1H RF coil covering the whole rat head 8 and Bruker MRI Avance III console, PV 5.1 software (Figure 1).
RESULTS
The kinetics of H217O metabolic production after tail IV bolus injection of [6-17O]glucose is shown in Figure 2 for both the normal and the glioma rat head. The observed transients immediately after bolus injection are likely due to the vascular response of the brain and equilibration transients following injection. The data were normalized by MR peak from the natural abundance 17O-water. The results were fit to a polynomial function to extract the initial linear rate of water peak changes (CMRg-w).The representative time course of the [6-17O1]glucose resonance in a normal rat head and a rat head with glioma after tail IV bolus injection of glucose is given in Figure 3. The time course of the glucose MR signal was fit to two exponential functions: (1) a fast-decaying component which was anticipated to be due to an equilibration transient in the brain and vascular system and (2) a slowly decaying component. The second part (2) was used to quantify total glucose consumption CMRg-tot.
The summary of the glucose metabolism in glioma-bearing rats relative to the normal rat is presented in the Table 1. The average tumor volume in the glioma group was 218 ± 173 mm3. Note, that there is a two times difference in the total glucose consumption CMRg-tot between the normal and glioma rats (low row). At the same time, the CMRg-w in glioma rats is 1.6 times more than in the normal rats.
DISCUSSION
Glucose[6-17O] provides a unique capability to monitor glucose metabolism by two complimentary parameters featuring the enolase step of water metabolism and total glucose utilization at the same time. The significance of non-oxidized glucose consumption as discussed by others 9 is particularly important in tumors 10. Our results support this point of view, showing a large increase of non-oxidative glycolysis in 9L glioma-bearing rats.CMRg-w in normal rat brain determined in the current study is comparable to the data in normal mice of 0.07 mmol/g/min 11, which was also determined using 17O-labelled glucose.
The CMRg values in glioma-bearing rats were evaluated as average for the whole rat head. From such results, it is possible to estimate a local rat brain tumor rate of glucose consumption relative to the normal brain. The average total glycolysis in glioma rats increased by 0.253/0.125 ~ 2 times (see Table 1), which indicates that 9L total glucose consumption is 11 times larger relative to the corresponding value in a normal rat brain. Correspondingly, glucose consumption in glioma at the enolase step is 7.5 times larger than in a normal brain. Thus, 9L glioma inside has the estimated total CMRg of 1.4 µmol/g/min. This estimation of increased total glucose utilization by tumors correlates with approximately 22 times increased protein synthesis in a rat transformed AA ascites solid tumor which was detected by multi-tracer auto-radiographic technique 12. It also correlates with the results of C6 glioma cells glucose consumption of 1.4 µmol/h/mg of protein which, in other units, is equal to 2.7 µmol/min/g 13.
CONCLUSION
17O MRS/MRI capabilities in vivo were evaluated for the first time using the high magnetic field of 21.1 T. Glucose[6-17O] metabolism was assessed in glioma and normal rats. The estimated total glucose metabolism in 9L glioma is ~11 times more than in normal brain. These results also demonstrate a 7.5 times increased glucose metabolism at the enolase step. Oxygen-17 MRI is an encouraging tool for assessing tumor metabolism in different type of cancer cells and can be a valuable step for drug development and evaluations of therapeutic tumor treatments.Acknowledgements
The National High Magnetic Field Laboratory is supported by the National Science Foundation through NSF/DMR-1644779 and the State of Florida.
References
Budinger TF, Bird MD, Frydman L, et al. Toward 20 T magnetic resonance for human brain studies: opportunities for discovery and neuroscience rationale. Magma 2016;29(3):617-639.
Budinger TF, Bird MD. MRI and MRS of the human brain at magnetic fields of 14 T to 20 T: Technical feasibility, safety, and neuroscience horizons. Neuroimage 2018;168:509-531.
Schepkin VD, Brey WW, Gor'kov PL, et al. Initial in vivo rodent sodium and proton MR imaging at 21.1 T. Magn Reson Imaging 2010;28(3):400-407.
Schepkin VD, Calixto-Bejarano F, Morgan T, et al. In vivo magnetic resonance imaging of sodium and diffusion in rat glioma at 21.1 T. Magn Reson Med 2012;67(4):1159-1166.
Schepkin VD, Elumalai M, Kitchen JA, at al. In vivo chlorine and sodium MRI of rat brain at 21.1 T. Magma 2014;27(1):63-70.
Abad N, Rosenberg JT, Hike DC, et al. Dynamic Sodium Imaging at Ultra-High Field Reveals Progression in a Preclinical Migraine Model. Pain 2018; 159(10): 2058-2065.
Roussel T, Rosenberg JT, Grant SC, et al. Brain investigations of rodent disease models by chemical exchange saturation transfer at 21.1 T. NMR in Biomedicine 2018;31(11):e3995.
Gor'kov PL, Qian C, Beck BL, et al. A modular MRI probe for large rodent neuroimaging at 21.1 T (900 MHz). Proceeding, 17th Annual Meeting, ISMRM 2009, p 2952. Honolulu, Hawai'i.
Dienel GA. Brain Glucose Metabolism: Integration of Energetics with Function. Physiological reviews 2019;99(1):949-1045.
Moreno-Sanchez R, Rodriguez-Enriquez S, Marin-Hernandez A, et al. Energy metabolism in tumor cells. The FEBS journal 2007;274(6):1393-1418.
Borowiak R, Reichardt W, Kurzhunov D, et al. Initial investigation of glucose metabolism in mouse brain using enriched (17) O-glucose and dynamic (17) O-MRS. NMR in Biomedicine 2017;30:e3724.
Kirikae M, Diksic M, Yamamoto YL. Quantitative measurements of regional glucose utilization and rate of valine incorporation into proteins by double-tracer autoradiography in the rat brain tumor model. J Cereb Blood Flow Metab 1989;9(1):87-95.
Portais JC, Voisin P, Merle M, et al. Glucose and glutamine metabolism in C6 glioma cells studied by carbon 13 NMR. Biochimie 1996;78(3):155-164.
Figures
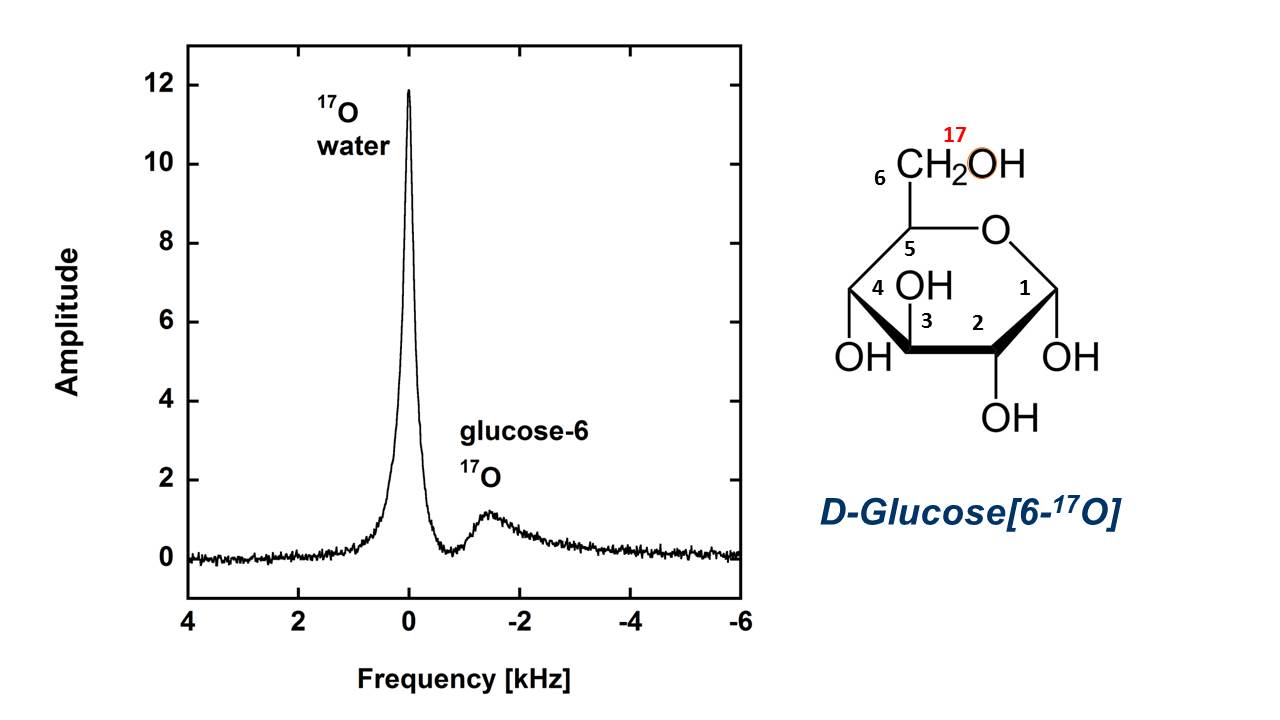
Figure 1. 17O MR spectrum in rat head. 17O-water peak in the center (0 ppm) is coming from the natural abundance of 17O-water. The glucose[6-17O] peak (-12.3 ppm) is shown at its max in one minute after IV tail injection of 1.5 ml glucose[6-17O] with concentration of 1.85 M and the abundance for 17O of a = 47%. The time course of the MR peaks allows for monitoring two features of the glucose metabolism simultaneously, an enolase step of 17O-water split-off from 2-phosphoglycerate and a total glucose[6-17O] utilization.
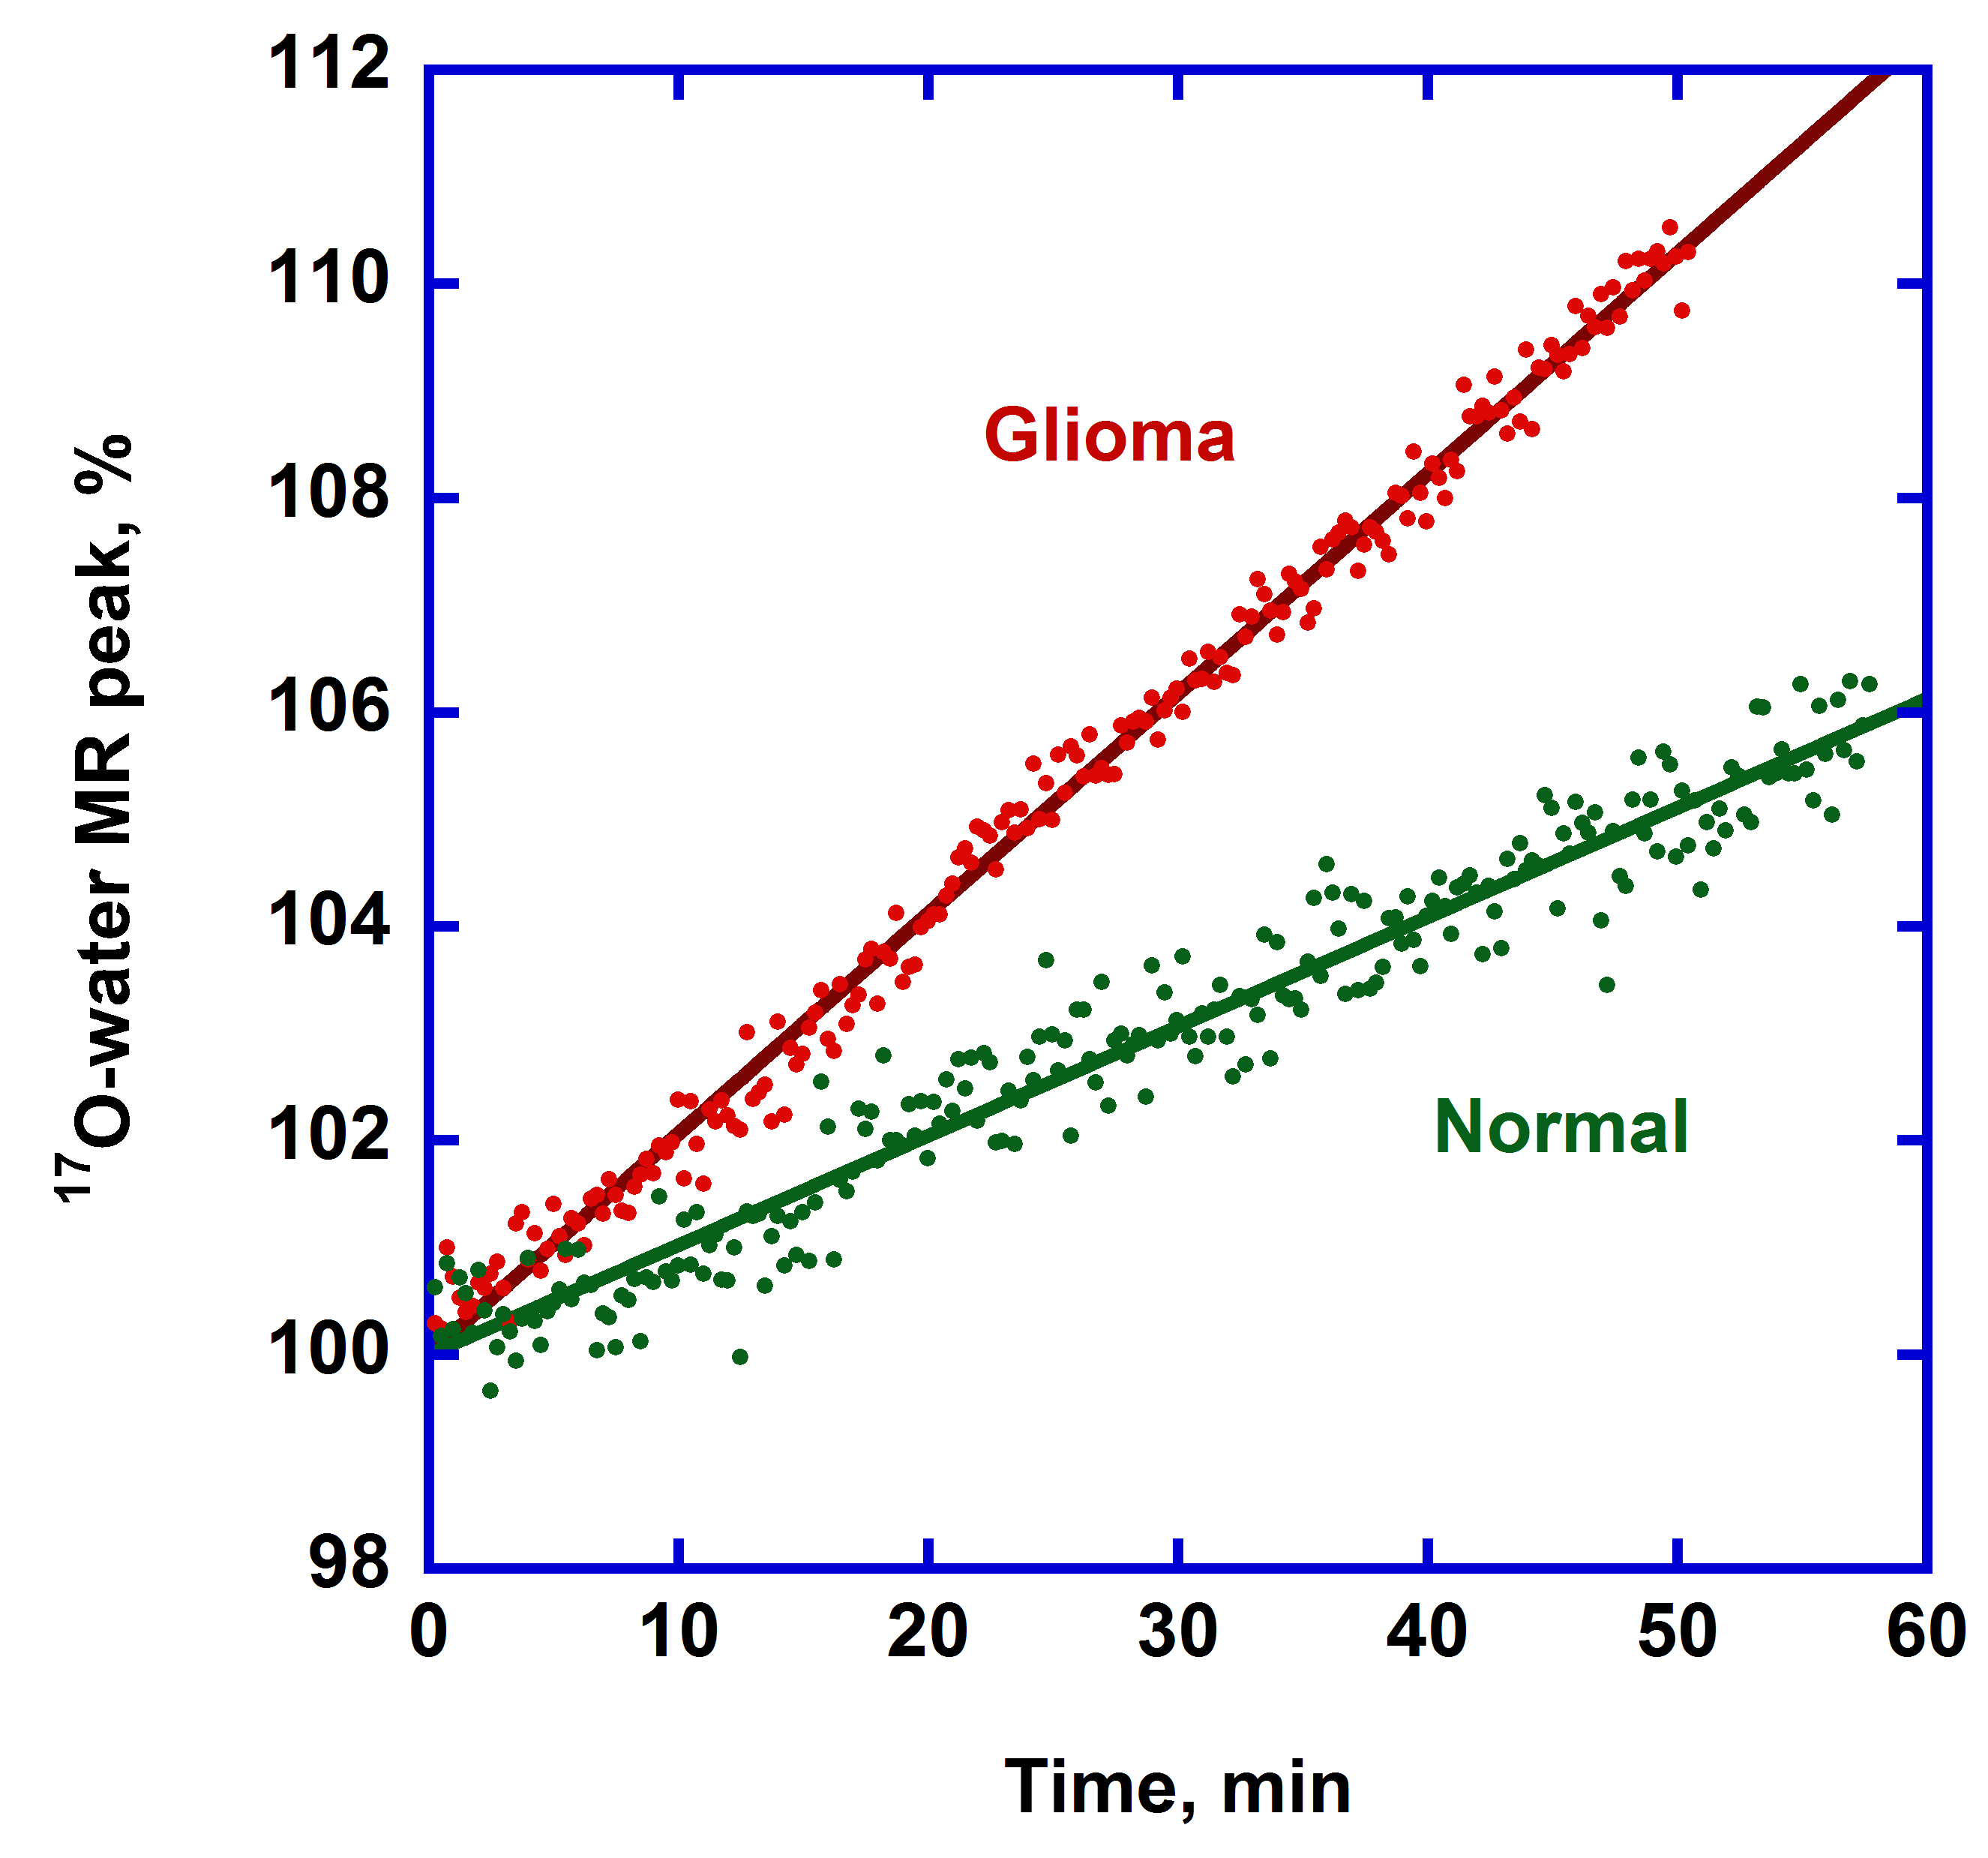
Figure. 2. The representative time courses of 17O-water peaks (15 s/point) in the normal and glioma rat heads after tail IV bolus injection of glucose[6-17O]. Bolus injection had duration of ~ 1.5 min. The increase of 17O-water peak is due to water produced during metabolism of glucose at the enolase step.
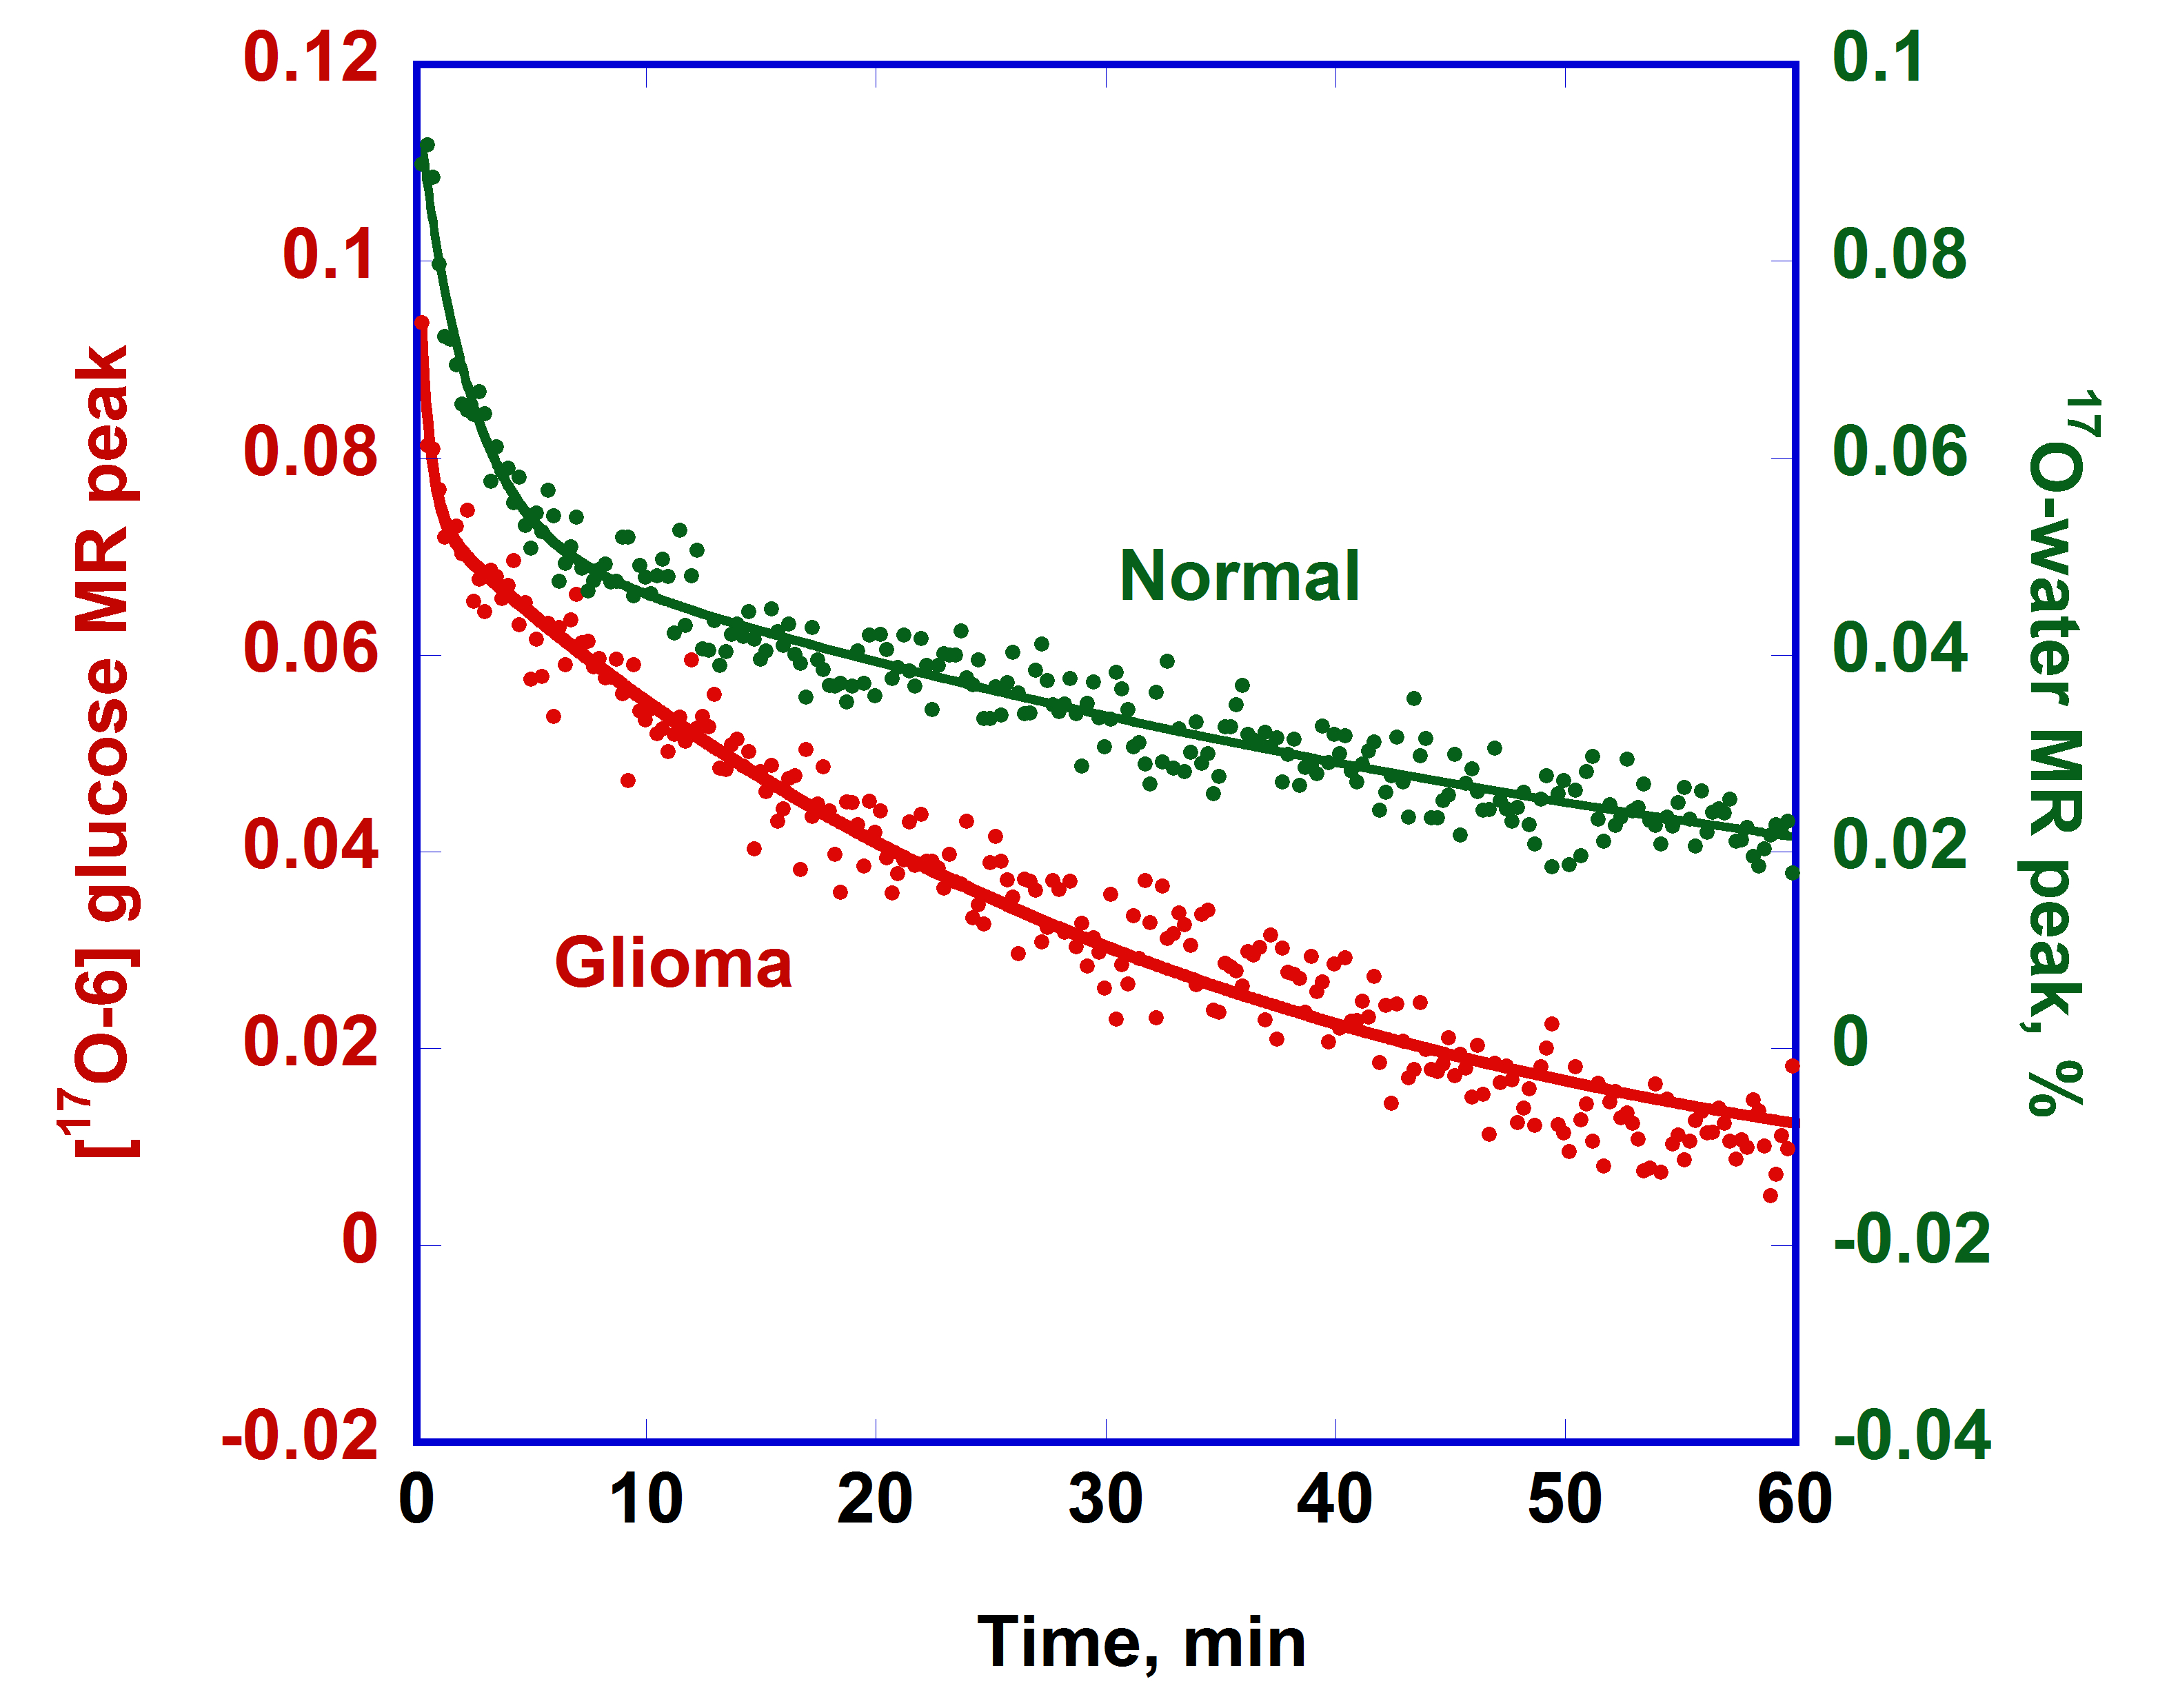
Figure 3. The representative time courses of [6-17O]glucose MR peaks (15 s/point) in the normal and glioma rat heads after tail IV bolus injection of glucose. The time course for the normal rat was shifted to up to avoid an overlay. The glucose peak amplitudes are expressed relative to the initial water peak and a, the natural abundance of 17O.
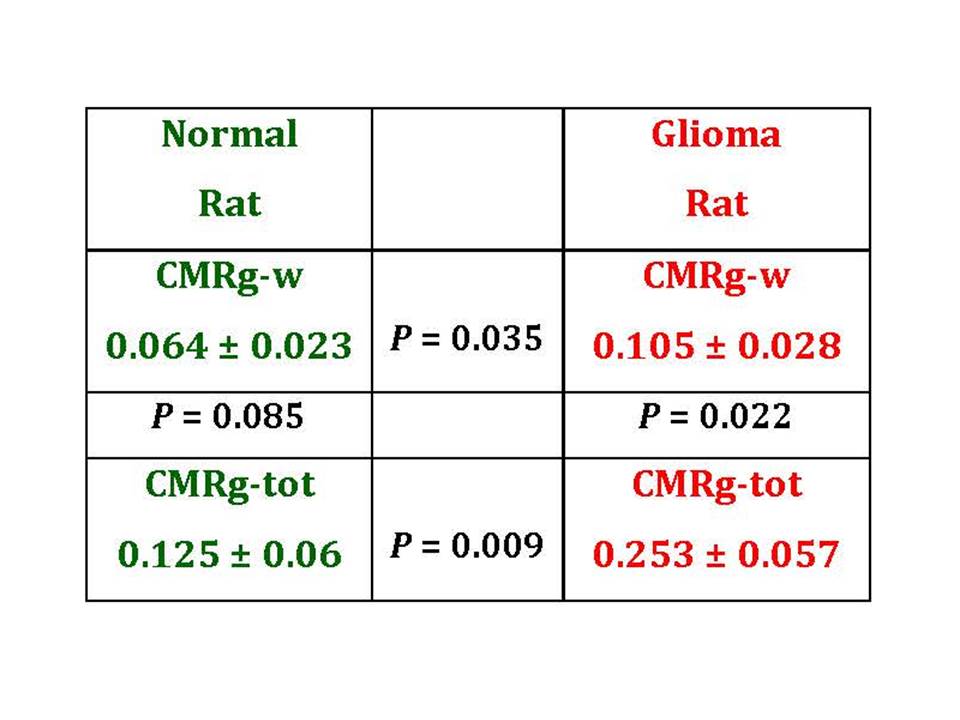
Table 1. Comparison of glucose metabolism in normal and tumor-bearing rat heads. CMRg-w and CMRg-tot represent the enolase step and total glucose consumption in a normal (left) and glioma (right) rat. All CMRg values presented in the table are given in µmol/g/min. The P values represent statistical significance of the CMRg values in the adjacent boxes which were determined by Student’s t-test for unpaired data with unequal variance.