3407
Identifying Metabolic Differentiators of Small Cell Neuroendocrine versus Adenocarcinoma subtypes of Castration-Resistant Prostate Cancer1Department of Radiology and Biomedical Imaging, University of California, San Francisco, San Francisco, CA, United States
Synopsis
NMR-based stable isotope resolved metabolomics was used to characterize small cell neuroendocrine (SCNC) and adenocarcinoma (aCRPC) subtypes of castration-resistant prostate cancer patient-derived xenografts (PDXs). Targeted metabolomics indicated distinct upregulation of metabolic pathways in SCNC relative to aCRPC PDXs. Specifically, [U-13C]glucose and [U-13C]glutamine labeling demonstrated that SCNC PDXs had increased glycolytic rate, alanine aminotransferase and tricarboxylic acid cycle activity, including anaplerotic sources. Further, the metabolic differences observed among the aCRPC and SCNC PDXs exhibited a continuous range as predicted by clinical genomic data of these subtypes of CRPC.
Introduction
Small cell neuroendocrine (SCNC) prostate cancer is an increasingly prevalent, lethal subtype of castrate-resistant prostate cancer (CRPC) that arises as an adaptive response to potent second-generation androgen pathway inhibitors such as abiraterone, apalutamide and enzalutamide1,2. Significant heterogeneity underlies the biology of CRPC, with frequent admixture of adenocarcinoma (aCRPC) and small cell histology within and across CRPC patients. Several therapies are currently available and being developed for SCNC, including platinum-based chemotherapy, inhibitors of glutamine metabolism (e.g., CB-839), and other MYC-directed treatment strategies (e.g., bromodomain inhibitors). However, there is currently no clear method to identify the presence of SCNC or monitor its response to treatment. Identifying metabolic biomarkers that reliably capture the heterogeneity of advanced prostate cancer, particularly the presence of SCNC, are of importance for selecting the appropriate therapy for individual patients and for the development of new therapeutic strategies. Thus, the goal of the present study was to understand the metabolic differences between aCRPC versus SCNC subtypes of CRPC using NMR-based stable isotope resolved metabolomics.Methods
Three aCRPC PDXs (LuCaP 70CR, LuCaP 77CR and LTL-313HR) and four SCNC PDXs (LuCaP 93, LuCaP 145.1, LTL-352 and LTL-610)3,4 were implanted under the renal capsule of male NSG mice. 80 μL of 25%wt/vol [U-13C] glucose or 200 μL of 35.73 mg/mL [U-13C] glutamine was injected via tail vein over 45 minutes5. Tumor tissue was collected and flash-frozen in liquid nitrogen. Aqueous metabolites were extracted using cold methanol:water:chloroform5, then lyophilized and resuspended in D2O with TSP for NMR analysis.NMR spectra were acquired on an 800 MHz Bruker Avance I equipped with a 5-mm triple resonance TXI cryo-probe. 1H water presaturation spectra with 13C decouling were acquired with following parameters: α=90, TD=24k, SW=15 ppm, TR=12 seconds, AQ=0.5 seconds, NS=32. 1H-13C HSQC: A phase- sensitive 2D HSQC (hsqcgpph) with no 13C decoupling during acquisition was used with the following parameters: TD=2048x4096, SW=6x120 ppm, TR=1.5 seconds, AQ = 0.297 seconds, NS=2.
Absolute concentrations (nmol/mg) of 23 steady state metabolites that showed well-resolved resonances were determined from 13C-decoupled 1H presaturation spectra of 13C-labeled tissue extracts using MestreNova (version 12). The relative concentrations of 5 steady state metabolites that were not well-resolved in 1D spectra were determined using 2D TOCSY cross peaks. The concentration of 13C-labeled metabolites was quantified from 1H-13C HSQC. Fractional enrichment (FE) was quantified as [13C-labeled metabolite] HSQC/[total metabolite]{13C}1H.
Multivariate analysis was performed on the steady state concentrations of metabolites using the MetaboAnalyst 4.0. 13C Isotopomer modeling of [U-13C] glucose-labeled tissues were performed using tcaCALC software (http://www.invivometabolism.org/tca.html).
Results and Discussion
Figure 1 shows comparison of steady state metabolite levels between aCRPC and SCNC PDXs. SCNC PDXs significantly differed from aCRPC PDXs in glutamine, taurine, myo-inositol, tyrosine and GPC. The unsupervised Principal Component Analysis (PCA) and supervised Partial Least Square Discriminant Analysis (PLS-DA) plots showed distinct clustering between aCRPC and SCNC PDXs (R2 = 0.98 and Q2=0.81, Figure 2A & 2B). In addition to the above-mentioned metabolites, creatine also contributed to the separation between the two groups (Figure 2C). Further, PCA (Figure 2D) and PLS-DA (Figure 2E) score plots showed clear discrimination among different aCRPC and SCNC PDXs, demonstrating within-group (among PDXs) metabolic heterogeneity and potentially capturing the spectrum of disease seen clinically.Figure 3 shows comparison of FE of lactate, alanine and glutamate between aCRPC and SCNC PDXs. Following [U-13C]glucose infusion, SCNC PDXs had elevated lactate, alanine and glutamate FE compared to aCRPC tumors (Figure 4A-C). With [U-13C] glutamine infusion, SCNC tumors also showed elevated lactate and glutamate FE compared to aCRPC tumors (Figure 4D,E). Interestingly, the similar FE of glutamate demonstrates that both glucose and glutamine contribute equally towards its synthesis. Additionally, the increased labeling of lactate from glutamine highlights glutamine as a significant anaplerotic source in SCNC tumors. Together these results suggest that glycolysis, alanine aminotransferase (ALT) and tricarboxylic acid cycle (TCA) metabolism are upregulated in SCNC. This is consistent with the hypothesis that these pathways may be upregulated in SCNC due to increased MYC overexpression6.
13C isotopomer modeling showed distinct TCA activity in aCRPC and SCNC PDXs labeled with [U-13C] glucose using tcaCALC software (Figure 4). All aCRPC PDXs showed the basic metabolic model in which glucose was a diminutive carbon source. The very low value of pyruvate dehydrogenase (PDH) activity implies that acetate is the major carbon source feeding the TCA cycle in aCRPC. However, in all SCNC PDXs except LuCaP 145.1, glucose is the sole source of carbons of the acetyl coA pool entering the TCA cycle. In addition, the anaplerotic substrates contributes 50% of the TCA cycle carbons to SCNC PDXs, LuCaP 93, LTL352 and LTL610. In LuCaP 145.1, pyruvate cycling is present as evidenced by the PDH and pyruvate carboxylase activity. Further, these results showed that the TCA metabolism of SCNC PDXs is different from the aCRPC PDXs.
Conclusion
Targeted metabolomics demonstrated distinct metabolic profiles of aCRPC and SCNC PDXs. From the stable isotope resolved analysis, it is evident that SCNC PDXs had elevated glycolysis, ALT activity and TCA metabolism as compared to aCRPC PDXs. Future studies will correlate these findings with transcriptomics to understand the underlying basis of the metabolic alterations between aCRPC and SCNC subtypes of CRPC.Acknowledgements
This work was supported by the following grants: NIH P41EB013598, NIH R01CA215694, DoD PC160630.
References
1. Aggarwal R, Zhang T, Small EJ, Armstrong AJ. Neuroendocrine Prostate Cancer: Subtypes, Biology, and Clinical Outcomes. J Natl Compr Canc Netw. 2014;12(5):719-726.
2. Vlachostergios PJ, Papandreou CN. Targeting Neuroendocrine Prostate Cancer: Molecular and Clinical Perspectives. Front Oncol. 2015;5:3072.
3. Nguyen HM, Vessella RL, Morrissey C, et al. LuCaP Prostate Cancer Patient-Derived Xenografts Reflect the Molecular Heterogeneity of Advanced Disease and Serve as Models for Evaluating Cancer Therapeutics. Prostate. 2017;77(6):654-671.
4. Lin D, Wyatt AW, Xue H, et al. High Fidelity Patient-Derived Xenografts for Accelerating Prostate Cancer Discovery and Drug Development. Cancer Research. 2014;74(4):1272-1283.
5. Lane AN, Yan J, Fan TWM. 13C Tracer Studies of Metabolism in Mouse Tumor Xenografts. Bio-protocol. 2015;5(22).
6. Beltran H, Rickman DS, Park K, et al. Molecular Characterization of Neuroendocrine Prostate Cancer and Identification of New Drug Targets. Cancer Discovery. 2011;1(6):487-495.
Figures
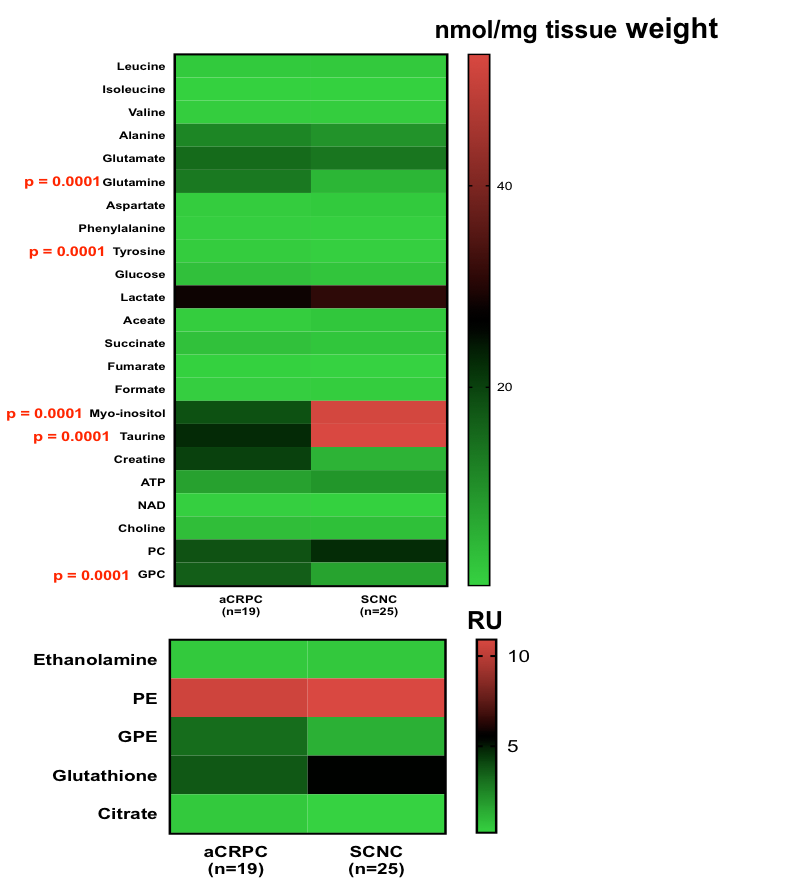
Figure 1. Comparison of steady state concentrations of metabolites between aCRPC and SCNC PDXs.
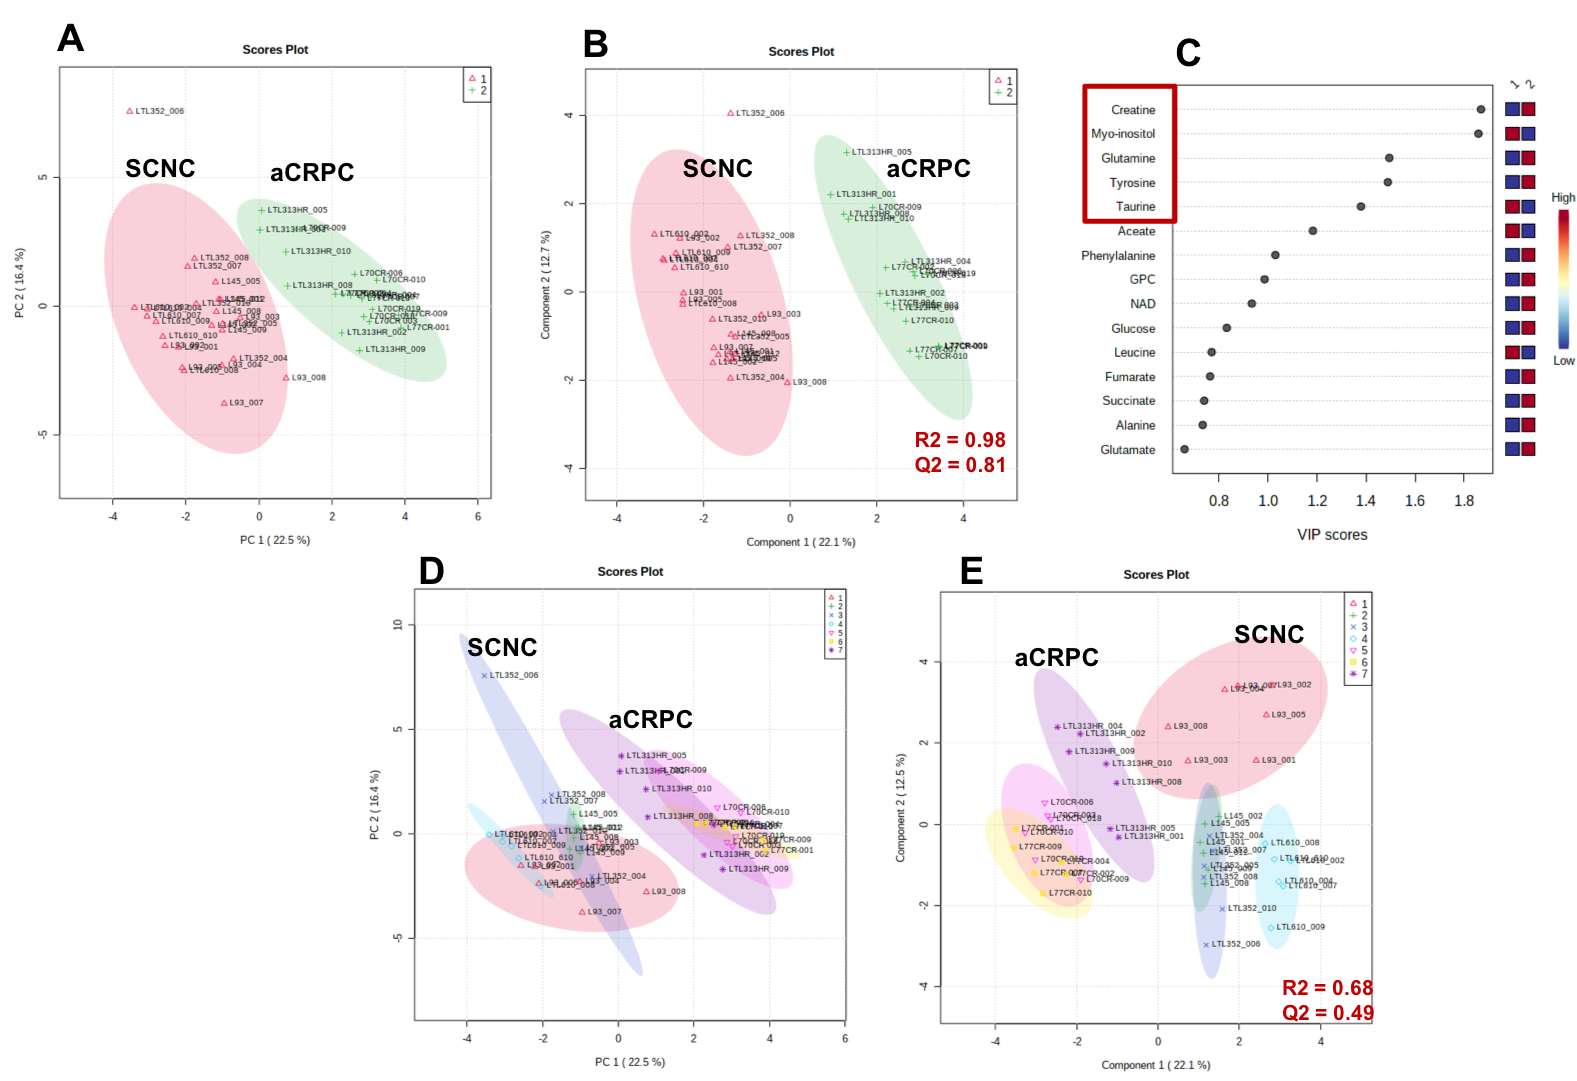
Figure 2. (A) PCA score plot, (B) PLS-DA score plot and (C) VIP plot based on the steady state concentration of metabolites quantified from 13C decoupled 1D proton NMR spectra of [U-13C] glucose or [U-13C] glutamine of adenocarcinoma and SCNC PDXs. (D) PCA score plot and (E) PLS-DA score plot of each PDX to demonstrate within-group variability.
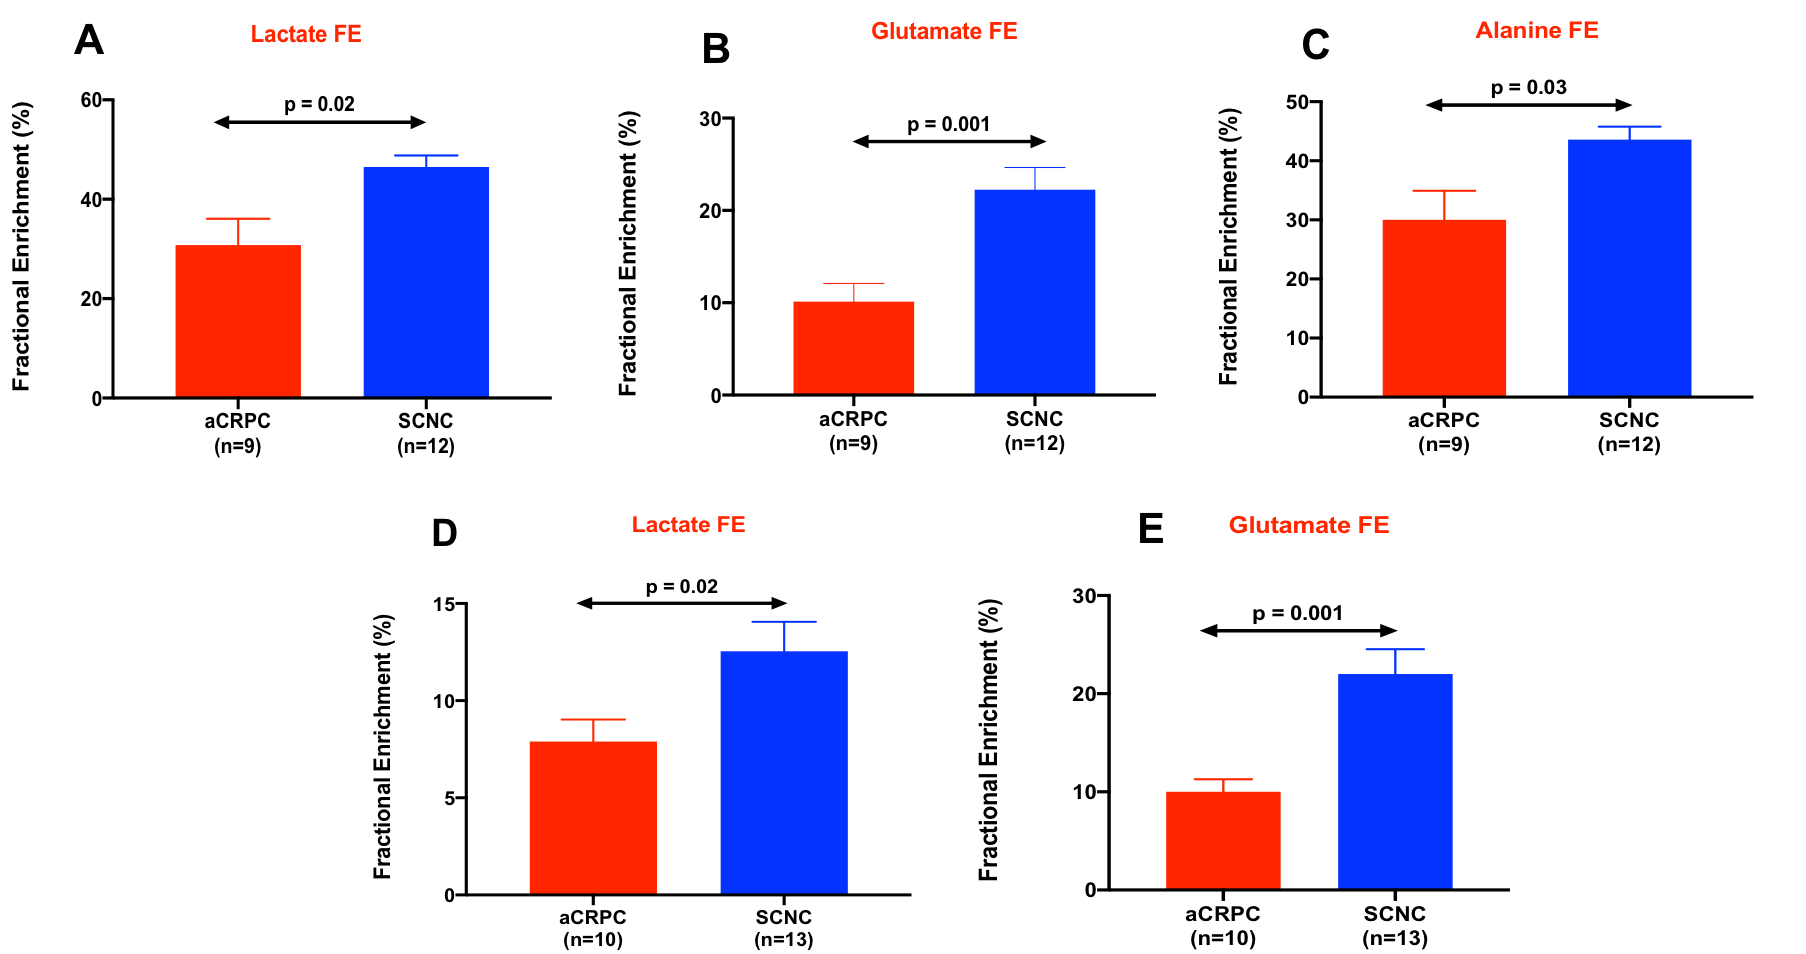
Figure 3. Fractional enrichment of lactate (A), glutamate (B), and alanine (C) of [U-13C] glucose-labeled aCRPC and SCNC PDXs while (D) and (E) show the fractional enrichment of lactate and glutamate from [U-13C] glutamine-labeled aCRPC and SCNC PDXs. [ n=3 for each PDX except glutamine-labeled LuCaP 93 and LTL-313HR PDX (n=4)]
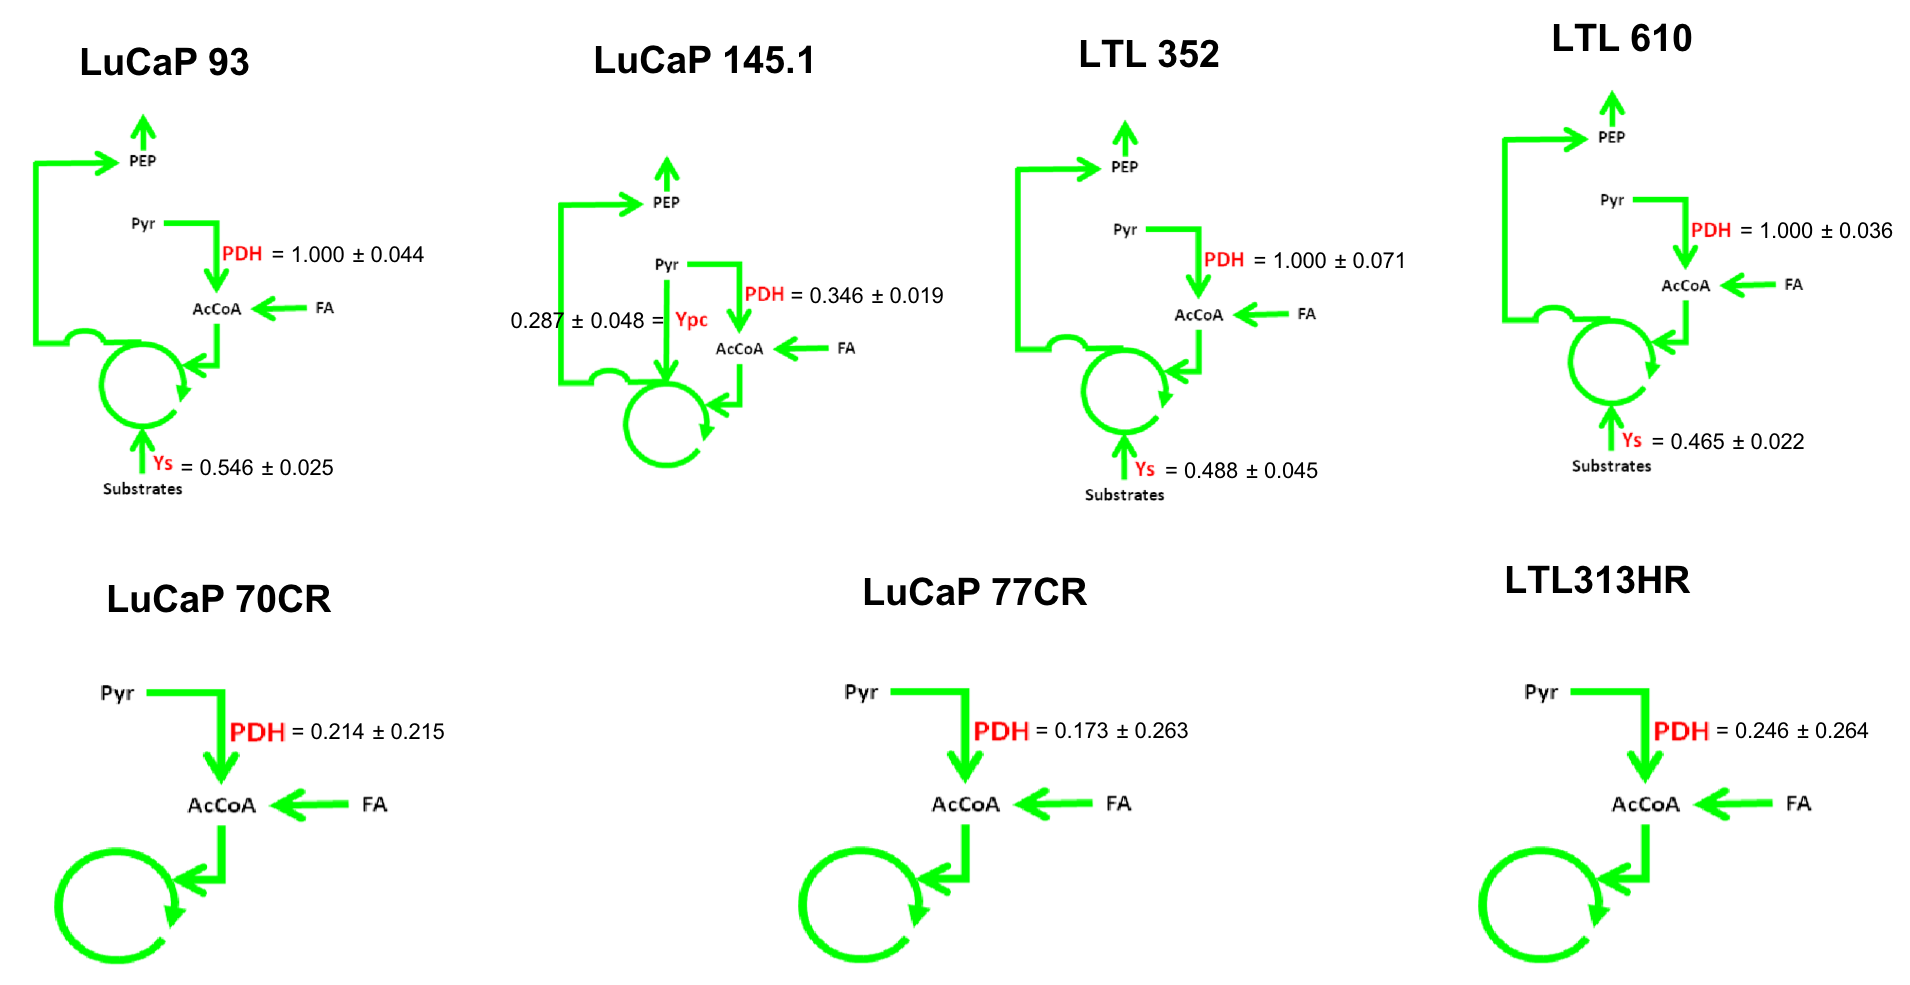
Figure 4. 13C Isotopomer modeling of [U-13C] glucose-labeled aCRPC and SCNC PDXs using tcaCALC software. (PDH - Pyruvate dehydrogenase, Ypc - Pyruvate Carboxylase and Ys- anaplerosis via succinyl CoA, glutaminolysis)