3406
Investigating spatial heterogeneity in diffuse gliomas with ultra-high gradient diffusion MRI and a model-free diffusion tensor distribution1Massachusetts General Hospital, Boston, MA, United States, 2Department of Biomedical Engineering, College of Precision Instruments and Optoelectronics Engineering, Tianjin University, Tianjin, China, 3Brigham and Women's Hospital, Boston, MA, United States
Synopsis
Diffuse gliomas demonstrate significant spatial heterogeneity which is not captured on standard anatomical MRI or with existing diffusion MRI (dMRI) methods. This is because current dMRI approaches provide voxel-averaged information about tissue composition and are based on a priori assumptions about underlying tissue microstructure, thus providing a simplified model of tissue properties. Here, we apply an unbiased, model-agnostic dMRI method (model-free diffusion tensor distribution (FDTD) and K-means clustering) to seven subjects with diffuse gliomas. We confirm the presence of intratumoral heterogeneity and find distinct differences in diffusion properties between gliomas of different histologic grades and pre- and post-treatment.
Introduction
Diffuse gliomas are a group of benign and malignant tumors of the central nervous system and include World Health Organization (WHO) grade 2, 3, and 4 astrocytomas and grade 2 and 3 oligodendrogliomas1. Histopathologically, they are spatially heterogeneous, demonstrating co-existing areas of solid and infiltrative tumor cells, necrosis, inflammation, and vasogenic edema that are not distinguishable from each other on T2/FLAIR sequences on standard MRI2. Diffusion MRI (dMRI) is a more sensitive technique for in vivo characterization of tissue heterogeneity. However, conventional trace diffusion-weighted imaging, diffusion tensor imaging, and advanced dMRI methods (e.g. NODDI3, RSI4,5) provide either voxel-averaged information about tissue composition or are based on a priori assumptions about underlying tissue microstructure and restrict tissue compartments to a few components and symmetries6-9. Thus, existing dMRI methods fail to capture variable diffusion properties within one MRI voxel and the full extent of tissue heterogeneity in diffuse gliomas. We have developed a model-free diffusion tensor distribution (FDTD) analysis approach to characterize tissue microstructure which does not rely on a priori assumptions of underlying tissue orientation and composition. The FDTD is obtained by expanding the range of diffusion tensors. This requires MRI data for a wide range of diffusion weightings and directions which is afforded by the high diffusion gradients achieved by the Connectome MRI scanner.Methods
Study design: Subjects with non-enhancing T2/FLAIR-hyperintense lesions suspicious for diffuse gliomas were scanned pre-surgery, at least 4 weeks post-surgery, at least 4 weeks post-radiotherapy, and after 3 cycles of chemotherapy.Data acquisition: Subjects were scanned on a high-gradient 3T MRI scanner (MAGNETOM CONNECTOM, Siemens Healthcare) with maximum gradient strength of 300 mT/m and maximum slew rate of 200 T/m/s10. Sagittal 2-mm isotropic resolution diffusion-weighted spin echo EPI images were acquired using simultaneous multislice (SMS) imaging10 and zoomed/parallel imaging11 for high-resolution whole-brain coverage. The following parameters were used: δ/∆=8/19, 8/49ms, 4-5 diffusion gradient increments linearly spaced from 55-293 mT/m per ∆, TE/TR: 77/3600ms, GRAPPA acceleration factor R=2, and SMS MB factor=2. Diffusion gradients were applied in 32-64 non-collinear direction with interspersed b=0 images every 16 directions. The maximum b-value was 17,800 s/mm2. Additionally, T1-MPRAGE and T2-SPACE-FLAIR sequences were obtained. Acquisition time was 56 minutes.
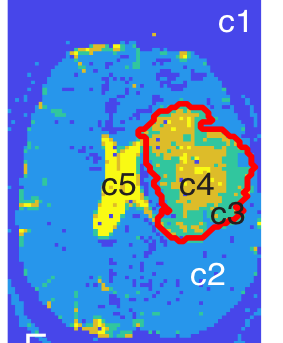
Data analysis: Standard pre-processing was performed to correct for gradient non-linearity-, susceptibility-, motion-, and eddy current-induced distortions12. We used spherical harmonics expansion of order 6/8 with Laplace-Beltrami regularization (λ=0.006)13 to interpolate the diffusion signal on each q-shell. Tumor ROIs were outlined, excluding necrotic, hemorrhagic, and resected areas. The T2/FLAIR-hyperintense region was defined as the “tumor ROI”. For improved visualization of FDTD results, we applied a data-centric K-means clustering algorithm to whole-brain images, which groups voxels with similar FDTD characteristics14, resulting in five clusters (c1-c5; Figure 1). The fraction of voxels corresponding to each cluster was calculated (number of voxels of a cluster divided by total number of voxels in ROI). The cluster criteria defined by one subject (Patient 1; Figure 1) were applied to other subjects’ dMRI data. FDTD-K-means clustering maps were correlated with histopathology obtained at surgery.
Results
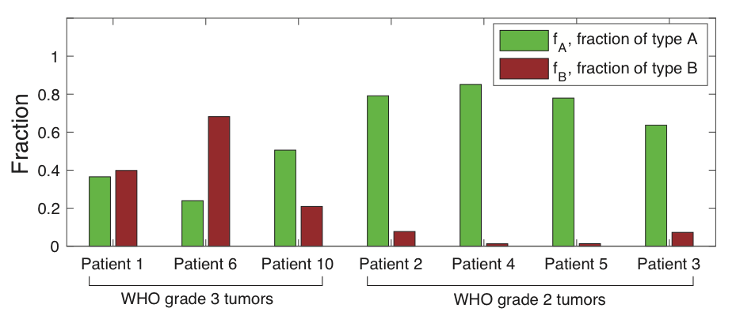
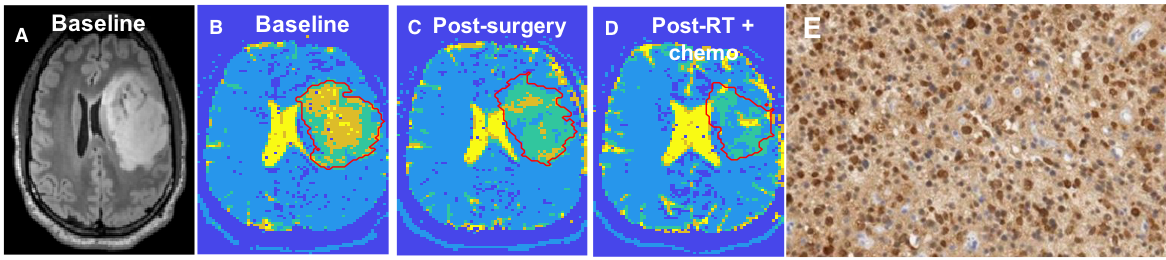
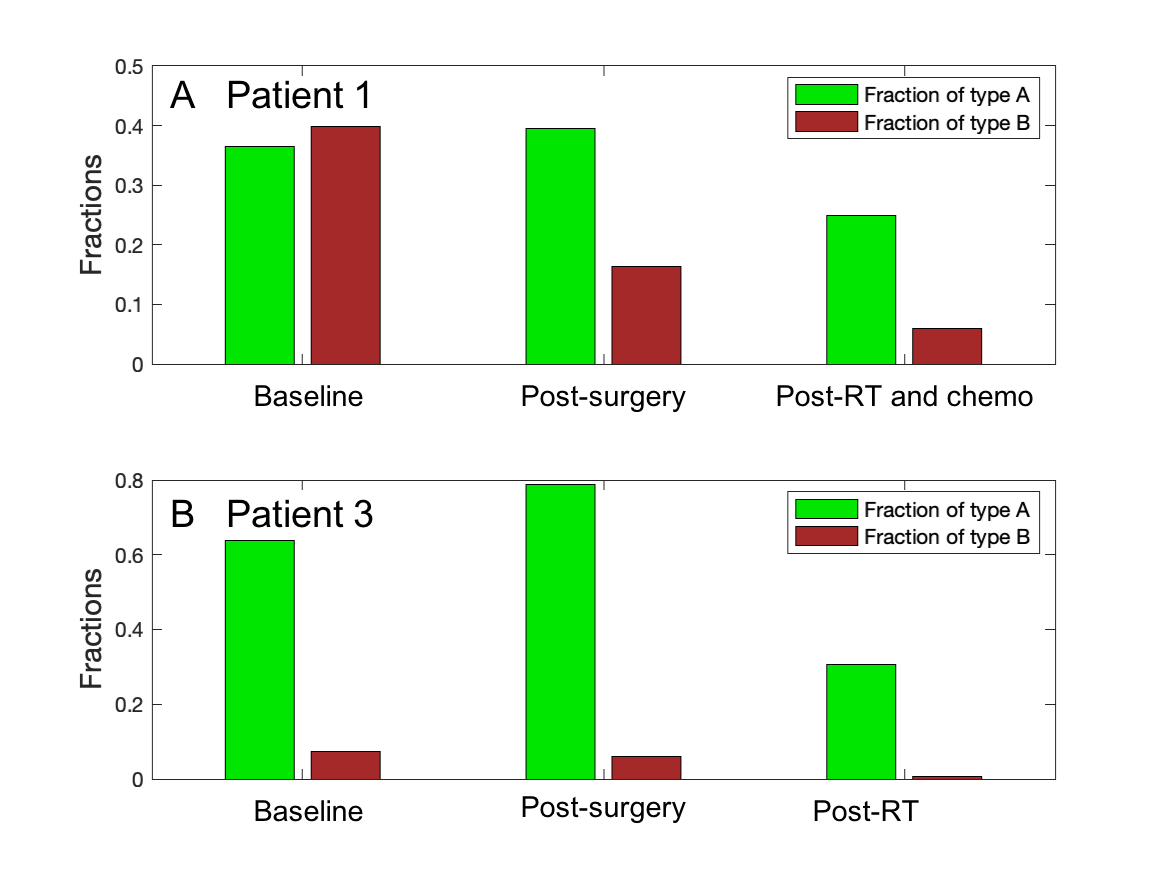
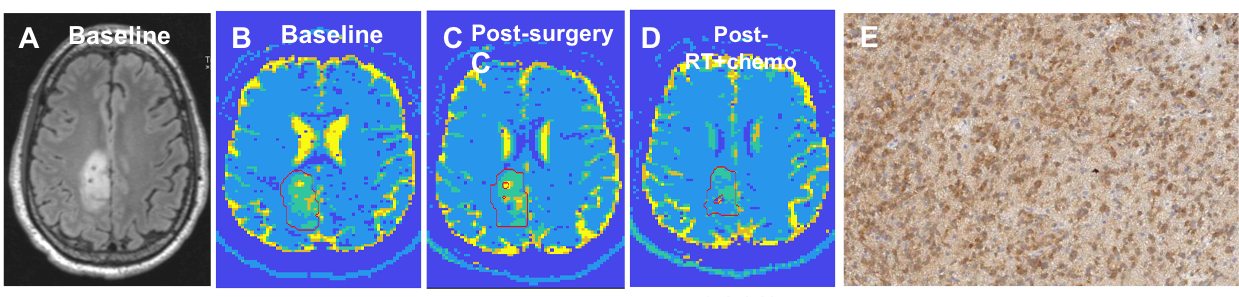
Seven subjects were included (three grade 3 astrocytomas, three grade 2 astrocytomas, one grade 2 oligodendroglioma; all isocitrate dehydrogenase (IDH)-mutant). In all subjects, the tumor ROI predominantly contained c3 (“Type A tissue”) and c4 (“Type B tissue”). Pre-surgery, we found a greater fraction of Type B tissue (fB) in grade 3 than grade 2 tumors (grade 2 tumors: mean fB 0.044, SD 0.036; grade 3 tumors: mean fB 0.43, SD 0.238; p=0.034; Figure 2). Furthermore, we found a greater fraction of Type A tissue (fA) in grade 2 than grade 3 tumors (grade 2 tumors: mean fA 0.765, SD 0.091; grade 3 tumors: mean fA 0.37, SD 0.131; p=0.034; Figure 2). Precise histopathologic correlation was possible in Patients 1 and 3. In Patient 1, Type B tissue corresponded to areas of solid tumor (Figure 3E). In Patient 3, Type A tissue corresponded to areas of diffusely infiltrative and less dense tumor cells (Figure 5E). Longitudinal analysis in Patient 1 revealed a significant decrease in Type B tissue post-treatment (Figure 3, 4A). In Patient 3, post-treatment maps primarily demonstrated a decrease in Type A tissue (Figure 4B, 5).Discussion
Applying a new model-free approach to characterize diffusion properties in IDH-mutant diffuse gliomas, we detect intratumoral spatial and temporal heterogeneity that is not visualized on standard MRI. Based on K-means clustering analysis, diffuse gliomas primarily contain Type A and Type B tissue, with different distributions of these tissue types in grade 2 and 3 gliomas. These distributions may reflect differences in tumor cellularity, with Type A tissue corresponding to less cellular tissue and Type B tissue reflecting highly proliferative tumor cells. Type A tissue could also reflect areas of vasogenic edema, given that this is a common finding in diffuse gliomas and post-treatment. Additional histopathologic studies are underway. If validated, our approach could have clinical applications, including improving surgical and radiotherapy planning and assessing treatment response and tumor recurrence.Conclusion
Our study demonstrates the feasibility of the FDTD-K-means clustering analysis approach using high-gradient dMRI data and reveals distinct microstructural diffusion changes in grade 2 and 3 diffuse gliomas pre- and post-treatment.Acknowledgements
No acknowledgement found.References
1. Louis DN, Perry A, Wesseling P, et al. The 2021 WHO Classification of Tumors of the Central Nervous System: a summary. Neuro Oncol. 2021;23(8):1231-1251.
2. Louis DN, Ohgaki H, Wiestler OD, et al. WHO Classification of Tumours of the Central Nervous System. 4th ed. Lyon: International Agency for Research on Cancer; 2016.
3. Zhang H, Schneider T, Wheeler-Kingshott CA, Alexander DC. NODDI: practical in vivo neurite orientation dispersion and density imaging of the human brain. Neuroimage. 2012;61(4):1000-1016.
4. White NS, Leergaard TB, D'Arceuil H, Bjaalie JG, Dale AM. Probing tissue microstructure with restriction spectrum imaging: Histological and theoretical validation. Hum Brain Mapp. 2013;34(2):327-346.
5. White NS, McDonald CR, Farid N, Kuperman JM, Kesari S, Dale AM. Improved conspicuity and delineation of high-grade primary and metastatic brain tumors using "restriction spectrum imaging": quantitative comparison with high B-value DWI and ADC. AJNR Am J Neuroradiol. 2013;34(5):958-964, S951.
6. Chenevert TL, Sundgren PC, Ross BD. Diffusion imaging: insight to cell status and cytoarchitecture. Neuroimaging Clin N Am. 2006;16(4):619-632, viii-ix.
7. Nicholson C. Factors governing diffusing molecular signals in brain extracellular space. J Neural Transm (Vienna). 2005;112(1):29-44.
8. Basser PJ, Mattiello J, LeBihan D. MR diffusion tensor spectroscopy and imaging. Biophys J. 1994;66(1):259-267.
9. Pierpaoli C, Jezzard P, Basser PJ, Barnett A, Di Chiro G. Diffusion tensor MR imaging of the human brain. Radiology. 1996;201(3):637-648.
10. Setsompop K, Kimmlingen R, Eberlein E, et al. Pushing the limits of in vivo diffusion MRI for the Human Connectome Project. Neuroimage. 2013;80:220-233.
11. Eichner C, Jafari-Khouzani K, Cauley S, et al. Slice accelerated gradient-echo spin-echo dynamic susceptibility contrast imaging with blipped CAIPI for increased slice coverage. Magn Reson Med. 2014;72(3):770-778.
12. Fan Q, Nummenmaa A, Witzel T, et al. Axon diameter index estimation independent of fiber orientation distribution using high-gradient diffusion MRI. Neuroimage. 2020;222:117197.
13. Descoteaux M, Angelino E, Fitzgibbons S, Deriche R. Regularized, fast, and robust analytical Q-ball imaging. Magn Reson Med. 2007;58(3):497-510.
14. Bishop
CM. Pattern recognition and machine
learning New York: Springer Science + Business Media; 2006.
Figures