3404
Using DL Reconstruction and 3D Directionally-Selective Crusher Gradients to Improve 3D Brachial Plexus Magnetic Resonance Neurography1GE Healthcare, New York, NY, United States, 2Department of Radiology and Imaging, Hospital for Special Surgery, New York, NY, United States, 3GE Healthcare, Waukesha, WI, United States
Synopsis
To improve vascular suppression in 3D brachial plexus MR neurography (MRN) with FSE readouts, 3D directionally-selective crusher gradient technique was implemented. 3D Deep learning reconstruction (DLRecon 3D) with denoising and sharpening properties was applied to improve nerve conspicuity. Preliminary data showed that using both DLRecon 3D reconstruction and 3D crusher gradients resulted in improved image quality, image sharpness, and vascular suppression.
INTRODUCTION
In MR neurography of the brachial plexus imaging, 3D T2-weighted short-tau inversion recovery (STIR) fast-spin-echo (FSE) sequences provides excellent isotropic 3D visualization of the longitudinal course of nerves. However, due to the similar relativity values and morphologies between blood vessels and nerves, it may be challenging to distinguish the two when they are in close proximity. To improve vascular suppression, we implemented a 3D directionally-selective crusher gradient along the direction of vascular flow. To improve sharpness of nerve boundaries, we applied the existing DLRecon algorithm (1) adapted for 3D (2), which includes denoising and sharpening properties, to further improve the visualization of brachial plexus using 3D FSE.METHODS
The default 3D FSE sequence that includes only two non-selectable crusher gradient directions (Z and X only) was modified to enable 3D vectorial crusher gradient selection by implementing amplitude and polarity selection of crusher gradient amplitude on all 3 axes. The sequence was tested on a 3T clinical scanner (Signa Premier, GE Healthcare). Under an IRB-approved study, 6 patients subjects undergoing routine unilateral brachial plexus exams (3 left, 3 right) were additionally scanned with the modified sequence keeping all other imaging parameters constant (FOV=25.6cm, 1x1x1mm, TR/TE=3300/60ms, time=6.5 minutes). The amplitudes for X, Y (if enabled), Z crusher were respectively 1.5, 1, and 1 cycles/cm, to approximate the mean directionalities of vessels in the field-of-view, with Y-polarity flipped depending for right vs left brachial plexus imaging. To compare the effects of the directionally-selective crusher sequence on vascular suppression, voxel-by-voxel signal intensity in posterior humerus circumflex vein (PHCV), normalized to muscle signal intensity, were measured and compared between the prototype and product scans using a non-parametric Wilcoxon signed rank test (p<0.05 was deemed statistically significant).To evaluate the sharpening properties of DLRecon 3D, the data from the default sequence were first reconstructed using DLRecon 3D. An image where the brachial plexus bundles were visible was then selected, and signal profiles across the nerves were manually extracted to compute the full width half maxima (FWHM) whereby decreased FWHM indicates improved sharpness.
RESULTS
A representative case shown in figure 2 demonstrates better vascular suppression using the custom sequence in the suprascapular vein (Figure 2A) and PHCV (Figure 2B). The boxplot in Figure 2C shows that the median PHCV signal intensity from the custom sequence is smaller than that from the product sequence; paired t-test indicates a significant difference between two (p=0).The signal profiles across the nerves (example in one case shown in Figure 2, yellow dotted line) were measured in both the product reconstructions and the DLRecon 3D reconstructions in the 6 patients. The average FWHM of the profile peaks from the product reconstructions were greater than that of the DLRecon 3D reconstructions by 0.0341±0.0473 mm (p<0.05). Shown in Figure 3 is a representative case that demonstrates the denoising and the sharpening properties of DLRecon 3D.
DISCUSSION
The preliminary data suggested that enabling 3D vectorial selection of crusher gradient direction can improve vascular suppression in brachial plexus MRN. Specifically, vessels in the brachial plexus such as the PHCV are generally oriented predominantly in the left to right direction, which is along the phase-encoding (Y) direction that currently lacks a crusher gradient in the default FSE sequence. Hence, additional Y crusher gradients will improve suppression of left-right flow signal. However, the similar vascular suppressions were not consistently observed in all vessels running in the left-right directions, which may suggest that stronger Y crushers gradients are needed. However, stronger crusher gradients generally increase inter-echo spacing that increases blurring in FSE; nevertheless, a stronger 3D directionally-selective crusher gradients may improve general vascular suppression, especially if applied in combination with sharpening algorithms such as DLRecon 3D.DLRecon 3D demonstrated sharpening of nerve in addition to appearing less noisy. When 3D directionally-selective crusher gradients are combined with DLRecon 3D reconstruction, it is possible to achieve better overall image quality and better vascular suppression (Figure 3).
CONCLUSION
This work showed that using both DLRecon 3D reconstruction and additional Y crusher gradients, we were able to improve the image quality, image sharpness, and vascular suppression of the 3D FSE brachial plexus images. Further systematic assessments on the clinical significances of these improvements are the natural continuation of this work.Acknowledgements
No acknowledgement found.References
1. Lebel RM. Performance characterization of a novel deep learning-based MR image reconstruction pipeline. Arxiv 2020.
2. Sun S, Tan ET, Carrino J, Mintz D, Sahr M, Endo Y, et al. Evaluation of Deep-Learning Reconstructed High-Resolution 3D Lumbar Spine MRI to Improve Image Quality. Proc ISMRM 2021
Figures
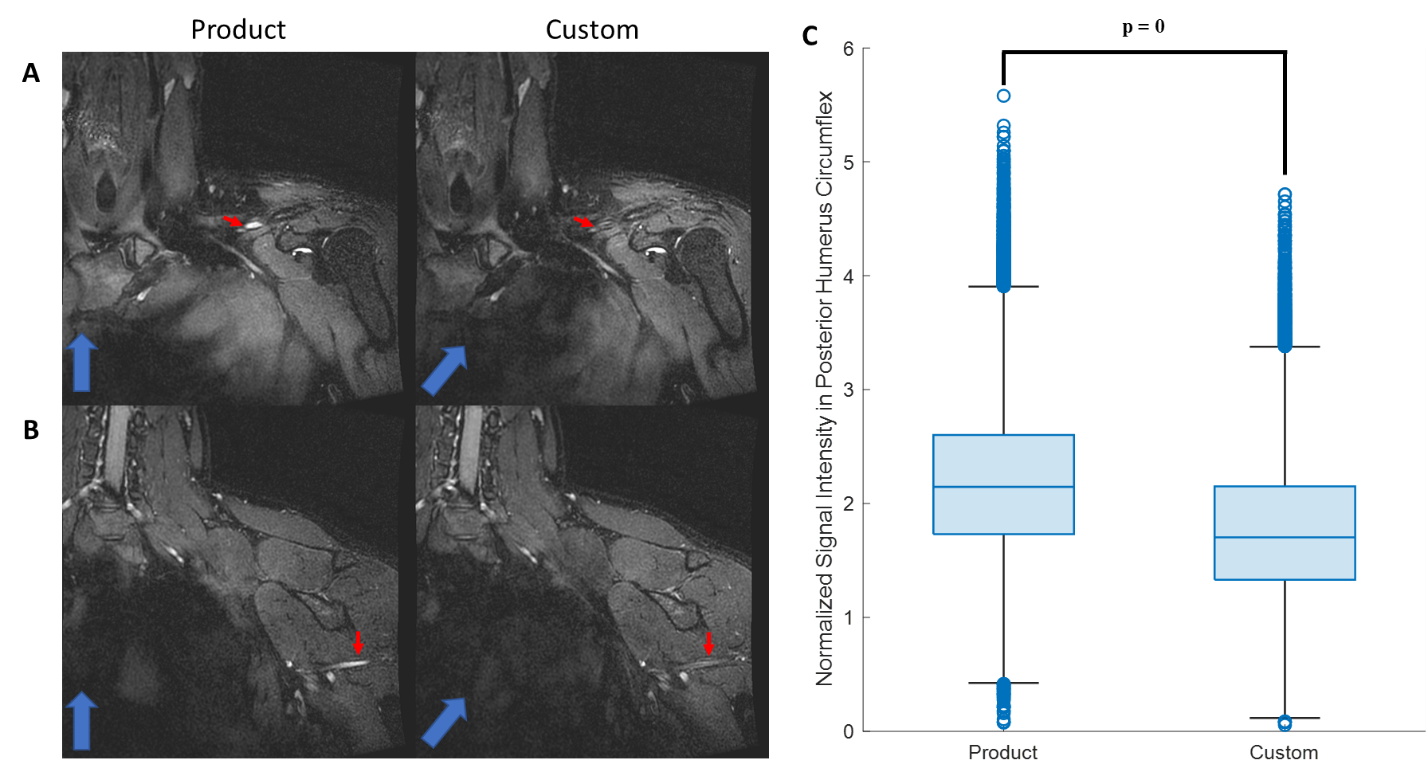
Figure 1. A representative case showing better vascular suppression using the custom sequence (A and B, red arrows). Blue arrow indicates the in-plane direction of the crusher gradient. Boxplot (C) shows that the signal intensity in PHCV has smaller median in the custom sequence compared to the product sequence.


Figure 3. Compared to the product images, DLRecon 3D reconstruction on the custom sequence demonstrated better overall image quality and better vascular suppression in PHCV.