3403
In vivo metabolic characterization of vegetarian diet effects on skeletal muscle using magnetic resonance spectroscopy1Aix-Marseille Université, CNRS, CRMBM, Marseille, France, 2AP-HM, Hôpital universitaire Timone, CEMEREM, Marseille, France
Synopsis
Vegetarian nutrition may contribute for metabolic differences that we proposed to explore non-invasively. 6 omnivores and 6 lacto-ovo-vegetarians underwent a 7T MRI exam including proton and phosphorus magnetic resonance spectroscopy to measure creatine (tCr), phosphocreatine (PCr) and triglyceride components in the soleus muscle. tCr and unsaturated fatty acids concentration were reduced in vegetarians but similar PCr/γ-ATP ratios were found. We show that vegetarian diet induces lower skeletal muscle creatine and different lipid profiles, which was not associated with altered bioenergetic reserve. This protocol opens new avenues to explore the impact of diet in skeletal muscle.
Background
Vegetarian nutrition is becoming increasingly common for various ethical, health and ecological reasons and may contribute for metabolic differences. A reduction in total creatine has been measured by skeletal muscle biopsies in lacto-ovo-vegetarians1. Plus, vegetarian diet provides lower plasma fatty acid levels compared to omnivores2 with high omega-6 intakes but lower intake of omega-3 polyunsaturated fatty acids3. In this proof-of-concept study, we investigated a protocol for non-invasive exploration of skeletal muscle metabolic pattern in vegetarians by non-invasive magnetic resonance spectroscopy (MRS).Methods
A total of 12 healthy subjects (6 omnivores and 6 lacto-ovo-vegetarians) underwent a dietary intake questionnaire followed by 7T MRI exam including proton (1H-MRS) and phosphorus magnetic resonance spectroscopy (31P-MRS) to measure in vivo metabolic markers in the soleus muscle, including creatine, phosphocreatine and triglyceride components. Data were acquired with a dual-tuned 1H/31P 14cm loop coil in supine position.A single-voxel 1H-MRS acquisition with a voxel size of 10x10x30 mm3 was placed in the soleus muscle using the semi-adiabatic Localization by Adiabatic SElective Refocusing (sLASER) sequence. Automatic projection-based first-order B0 shimming was performed in the same voxel with FAST(EST)MAP4.
A first acquisition was done with water saturation and the following parameters: TE=50ms, TR=4.9s, 4096 sampling points, 10kHz bandwidth, 4 dummy scans, excitation centered at 3ppm, 10 averages. Suppression of water (W) signal was accomplished using variable pulse power and optimized relaxation delays (VAPOR)5. Outer-volume suppression (OVS) bands were placed on the 4 transverse sides of the voxel of interest.
A second acquisition was done without water saturation (VAPOR flip angles set at 0) using one single excitation without dummy scans to assess unsaturated skeletal muscle water content.
For 31P-MRS, an ultra-short echo-time 3D chemical shift imaging (CSI) acquisition of the lower leg was used6. Acquisition parameters were: 16 x 16 x 8 matrix and a 200 x 200 x 240-mm3 FOV, using elliptical k-space weighting acquisition with ten averages at k = 0, 50° non-selective excitation, TE=0.2ms, TR=280ms, 8kHz bandwidth, 1024 sampling points. The flip angle was calibrated prior to the CSI acquisition using a non-selective single-pulse FID acquisition with incrementing power (TR = 15s) representing the weighed-average muscle signal contained in the coil’s sensitive volume. The soleus is naturally positioned at a distance corresponding to the calibrated flip angle. A multi-slice FLASH 1H image stack was acquired with identical orientation and position as the CSI volume, serving as morphological reference during post-processing.
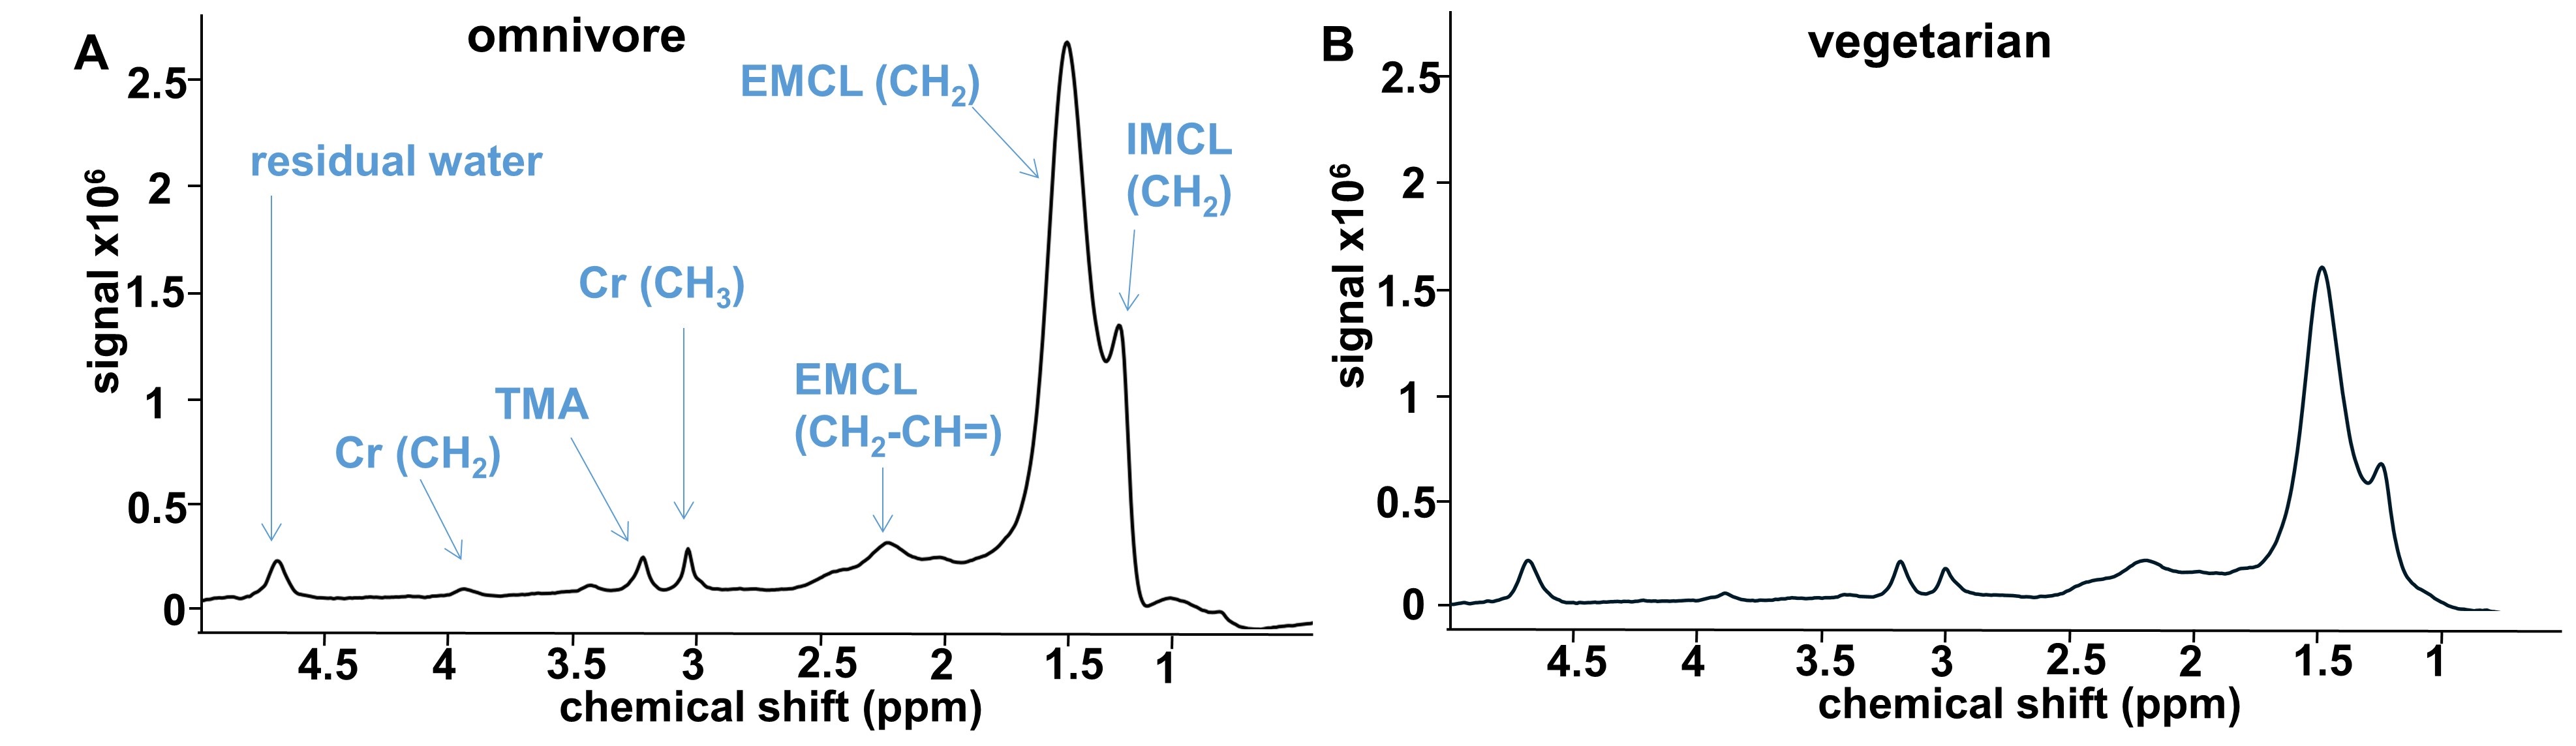
1H-MRS data were quantified using home-made Python software7,8. Briefly, a fitting algorithm and a pyGAMMA simulation library9 were employed to quantify skeletal muscle components10 such as trimethyl amide (TMA, 3.2 ppm), total creatine (tCr, free creatine + phosphocreatine, 3.1 ppm) and TG resonance, which include intramyocellular lipids (IMCL, 1.3 ppm), extramyocellular lipids (EMCL, 1.6 ppm) and unsaturated fatty acids from EMCL (e-UFA, 2.3 ppm) as shown in Figure 1. Relative metabolites concentrations were corrected for T1, T2 and the number of protons.
31P data were processed using in-house software (CSIAPO 11). Voxels of interest were positioned in the soleus for all subjects. The calculated signals at these locations were filtered using an exponential function (width: 15 Hz) and analyzed using AMARES fitting (MRUI, 12) of Pi, PCr and ATP time-domain signal components. Signal amplitudes were corrected for partial saturation with literature T1 values 13. PCr/gATP ratio was used to represent PCr concentrations assuming that ATP concentrations remained constant14.
Results
There was a 36% lower protein intake in the vegetarian group compared with omnivores (p<0.01) but no difference in total energy intake was found. Quantitatively, soleus muscle tCr concentration was significantly lower (p=0.013) in vegetarians than in omnivores (30.7 ± 5.2 µmol/g vs. 62.0 ± 20.6 µmol/g). Moreover, it is important to note that tCr concentrations varied substantially in the omnivore group (F-test; p=0.009). A trend toward lower mean skeletal muscle EMCL was measured in vegetarians (60.9 ± 23.5 vs. 135.5 ± 86.2 µmol/g in omnivores). IMCL levels were not different (18.7 ± 11.5 vs. 26.4 ± 15.7 µmol/g) between the two groups.Lipid profiles tended to differ between vegetarians and omnivores: e-UFA were reduced in the vegetarian group (80.9 ± 36.5 vs. 220.9 ± 107.9 % in omnivores; p=0.053) (Figure 3), this was associated with significantly different variances between groups (F-test; p=0.03). The e-UFA/EMCL ratio was slightly lower in vegetarians (6.8 ± 1.6 vs. 9.6 ± 3.6 % in omnivores). Bioenergetic reserve was not altered by diet based on equal PCr/γ-ATP ratios between vegetarians and omnivores (2.9 ± 0.1 vs. 3.0 ± 0.1 and 0.22 ± 0.04 vs. 0.24 ± 0.02, respectively) (Figure 2).
Discussion & Conclusion
We show that lower creatine was not associated with lower PCr in vegetarian skeletal muscle. This study demonstrates for the first time the ability of MRS to detect metabolite content differences in skeletal muscle of vegetarians as an alternative to invasive biopsy. This protocol opens new avenues to explore the impact of diet and could further benefit muscular metabolism monitoring.Acknowledgements
The authors thank Véronique Gimenez, Lauriane Pini and Claire Costes for their great help in organization. CRMBM is member of France Life Imaging network (grant ANR-11-INBS-0006).
References
1. Burke DG., Chilibeck PD., Parise G., et al. Effect of creatine and weight training on muscle creatine and performance in vegetarians. Med Sci Sports Exerc 2003;35(11):1946–55. Doi: 10.1249/01.MSS.0000093614.17517.79.
2. Rosell MS., Lloyd-Wright Z., Appleby PN., et al. Long-chain n-3 polyunsaturated fatty acids in plasma in British meat-eating, vegetarian, and vegan men. Am J Clin Nutr 2005;82(2):327–34. Doi: 10.1093/ajcn.82.2.327.
3. Salvador AM., García-Maldonado E., Gallego-Narbón A., et al. Fatty Acid Profile and Cardiometabolic Markers in Relation with Diet Type and Omega-3 Supplementation in Spanish Vegetarians. Nutrients 2019;11(7). Doi: 10.3390/nu11071659.
4. Gruetter R., Tkác I. Field mapping without reference scan using asymmetric echo-planar techniques. Magn Reson Med 2000;43(2):319–23. Doi: 10.1002/(sici)1522-2594(200002)43:2<319::aid-mrm22>3.0.co;2-1.
5. Tkác I., Starcuk Z., Choi IY., et al. In vivo 1H NMR spectroscopy of rat brain at 1 ms echo time. Magn Reson Med 1999;41(4):649–56. Doi: 10.1002/(sici)1522-2594(199904)41:4<649::aid-mrm2>3.0.co;2-g.
6. Robson MD., Tyler DJ., Neubauer S. Ultrashort TE chemical shift imaging (UTE-CSI). Magn Reson Med 2005;53(2):267–74. Doi: 10.1002/mrm.20344.
7. Roussel T., Le Fur Y., Ranjeva J-P., et al. Respiratory-triggered quantitative MR spectroscopy of the human spinal cord at 7 T. ISMRM Annual Meeting 2020.
8. Sourdon J., Roussel T., Costes C., et al. Comparison of single-voxel 1H-cardiovascular magnetic resonance spectroscopy techniques for in vivo measurement of myocardial creatine and triglycerides at 3T. J Cardiovasc Magn Reson 2021;23:53. Doi: 10.1186/s12968-021-00748-x.
9. Smith SA., Levante TO., Meier BH., et al. Computer Simulations in Magnetic Resonance. An Object-Oriented Programming Approach. Journal of Magnetic Resonance, Series A 1994;106(1):75–105. Doi: 10.1006/jmra.1994.1008.
10. Ren J., Sherry AD., Malloy CR. 1H MRS of intramyocellular lipids in soleus muscle at 7 T: spectral simplification by using long echo times without water suppression. Magn Reson Med 2010;64(3):662–71. Doi: 10.1002/mrm.22345.
11. Le Fur Y., Nicoli F., Guye M., et al. Grid-free interactive and automated data processing for MR chemical shift imaging data. MAGMA 2010;23(1):23–30. Doi: 10.1007/s10334-009-0186-y.
12. Vanhamme L., van den Boogaart A., Van Huffel S. Improved Method for Accurate and Efficient Quantification of MRS Data with Use of Prior Knowledge. Journal of Magnetic Resonance 1997;129(1):35–43. Doi: 10.1006/jmre.1997.1244.
13. Rodgers CT., Clarke WT., Snyder C., et al. Human cardiac 31P magnetic resonance spectroscopy at 7 Tesla. Magn Reson Med 2014;72(2):304–15. Doi: 10.1002/mrm.24922.
14. Sourdon J., Lewsey SC., Schär M., et al. Measuring Myocardial Energetics with Cardiovascular Magnetic Resonance Spectroscopy. Heart Fail Clin 2021;17(1):149–56. Doi: 10.1016/j.hfc.2020.08.011.
Figures
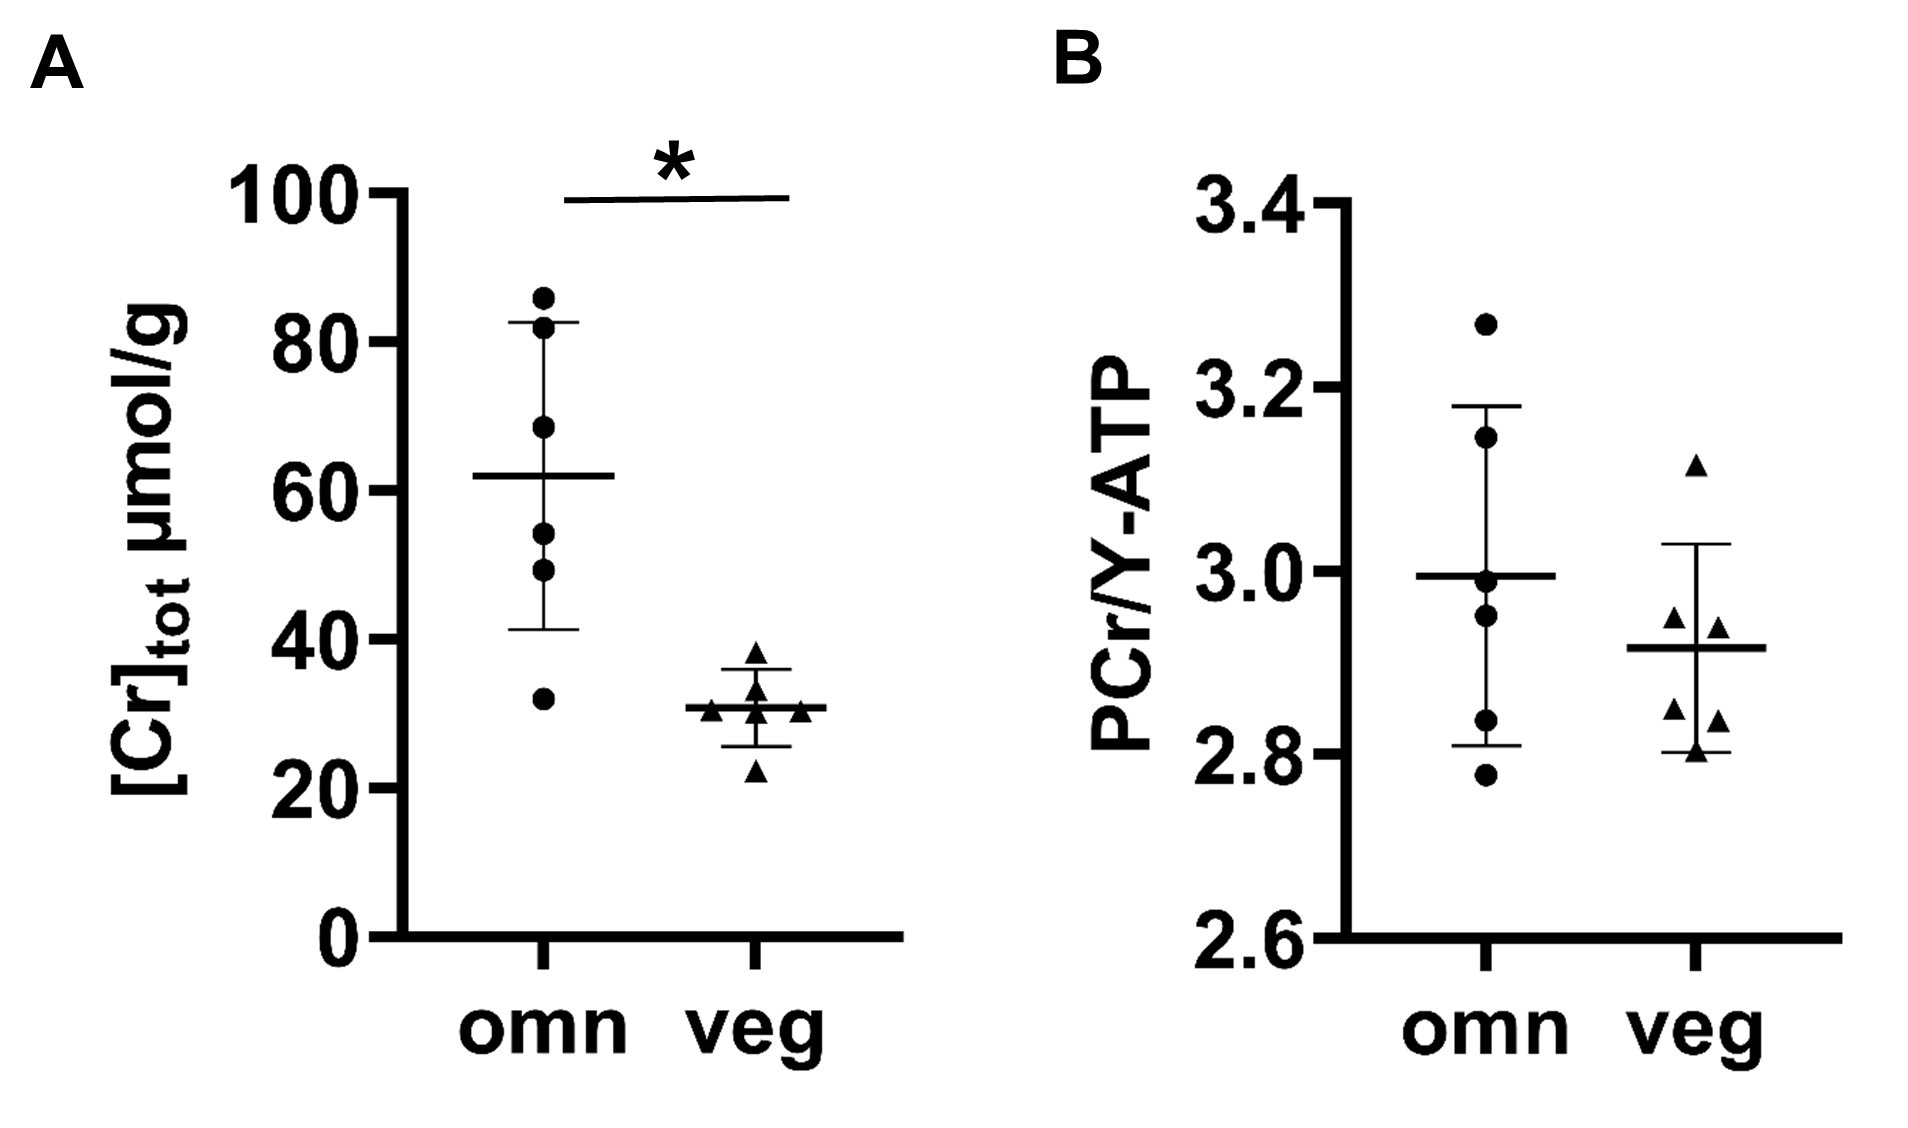
(A) Plot of mean total creatine (Cr) concentration. (B) plot of mean PCr/γ-ATP ratio. Data expressed as mean ± SD. n=6 in each group. *: p<0.05.
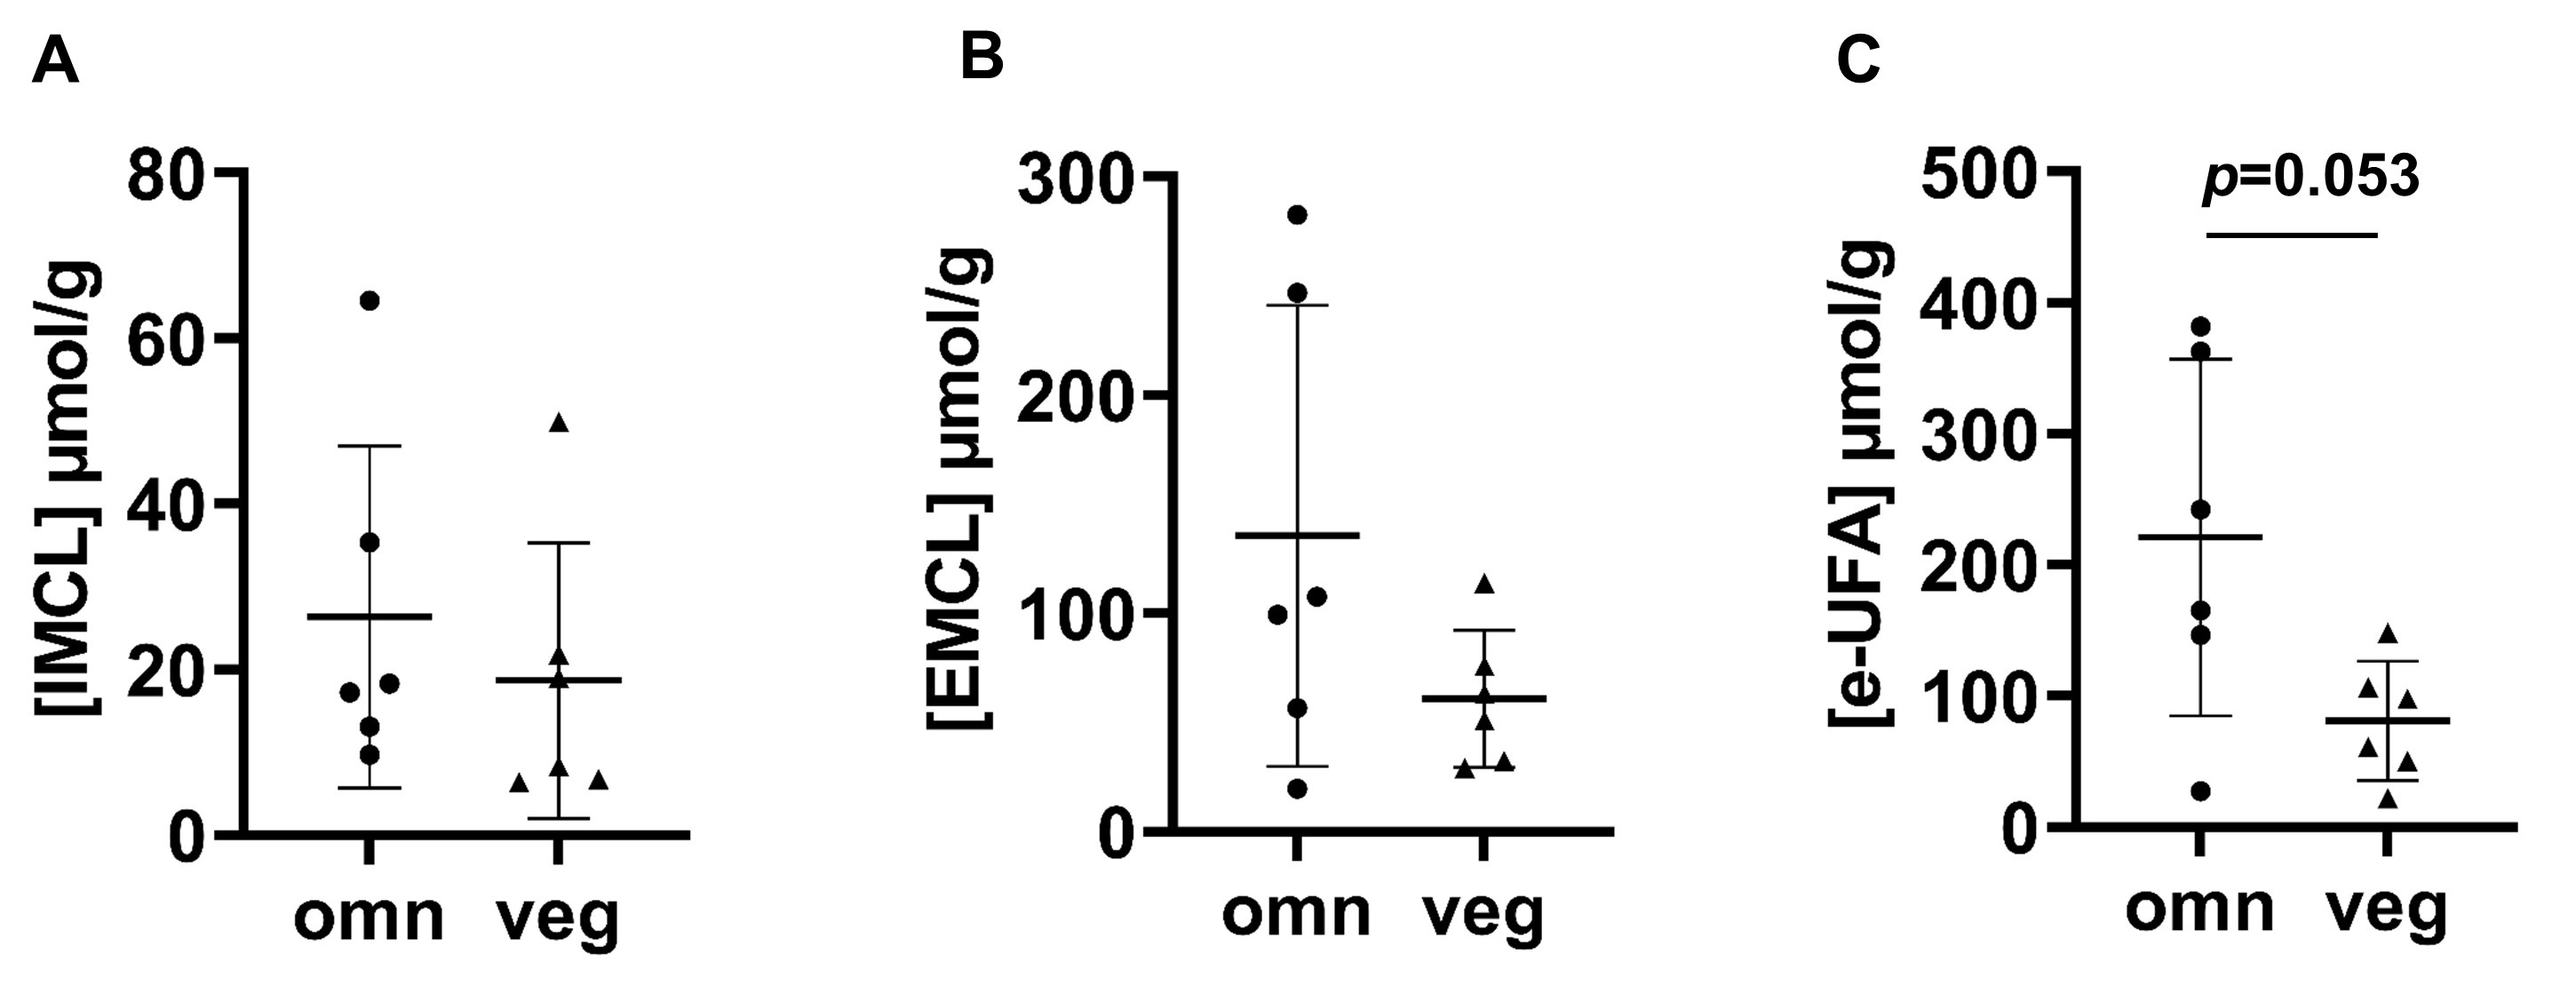
Plots of skeletal muscle concentrations of extramyocellular lipids (EMCL) (A), intramyocellular lipids (IMCL) (B) and unsaturated fatty acids from EMCL concentration (C). Data expressed as mean ± SD. n=6 in each group.