3400
A comparison of muscle pennation angles measured with DTI fiber tractography and 3D-ultrasound1Biomedical Engineering and Physics, Amsterdam University Medical Center, Amsterdam, Netherlands, 2Laboratory for Myology, Department of Human Movement Sciences, Faculty of Behavioural and Movement Sciences, Vrije Universiteit Amsterdam, Amsterdam, Netherlands, 3Department of Rehabilitation Medicine, VU University Medical Center Amsterdam, Amsterdam Movement Sciences, Amsterdam, Netherlands, 44 Department of Radiology and Nuclear Medicine, Amsterdam University Medical Centers, University of Amsterdam, Amsterdam, Netherlands
Synopsis
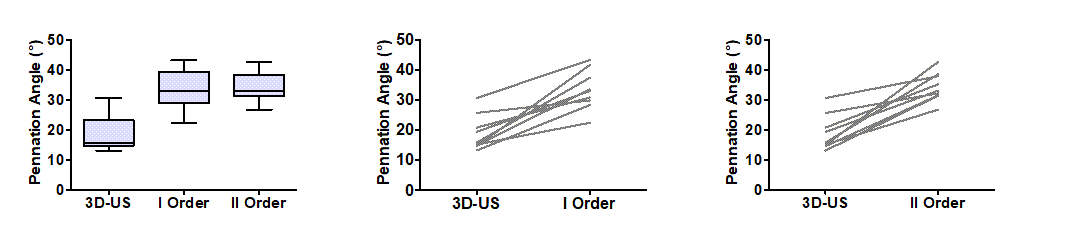
Pennation angle is an important architecture parameter to understand muscle functioning. It is commonly measured using 2D ultrasound. However, it is difficult to infer 3D muscle architecture from 2D imaging. Therefore, we compare the pennation angle measurements obtained with 3D-DTI fiber-tractography and 3D-ultrasound (3D-US). We acquired data of the Vastus Lateralis muscle in 9 healthy subjects. The mean pennation angle with 3D-US was 18.9°± 5.9°, whereas we found 33.3°±6.7° (straight fiber approximation) and 34.5°±4.8°(curved fiber fit) for DTI fiber-tractography. These differences between 3D-US and DTI could be of technical or physiological origin.
Introduction
Knowledge on skeletal muscle architectural parameters, such as pennation angle, allow for a better understanding of how muscle architecture and function are related in health and disease. The most commonly used definition of pennation angle is the angle between the muscle fascicle and aponeuroses, commonly assessed using 2D B-mode ultrasound imaging[1]. However, it is challenging to align the imaging plane with the line of pull and it is generally difficult to correctly infer 3D architecture from 2D imaging. Alternatively, both Diffusion-Tensor-Imaging (DTI) and 3D-ultrasound (3D-US) facilitate a 3D assessment of muscle fiber orientations and pennation angles [2,3]. However, so far little is known about how these two modalities compare. The purpose of this study was therefore to compare the quantification of pennation angles of the Vastus Lateralis muscle using DTI fiber-tractography and 3D-US.Methods
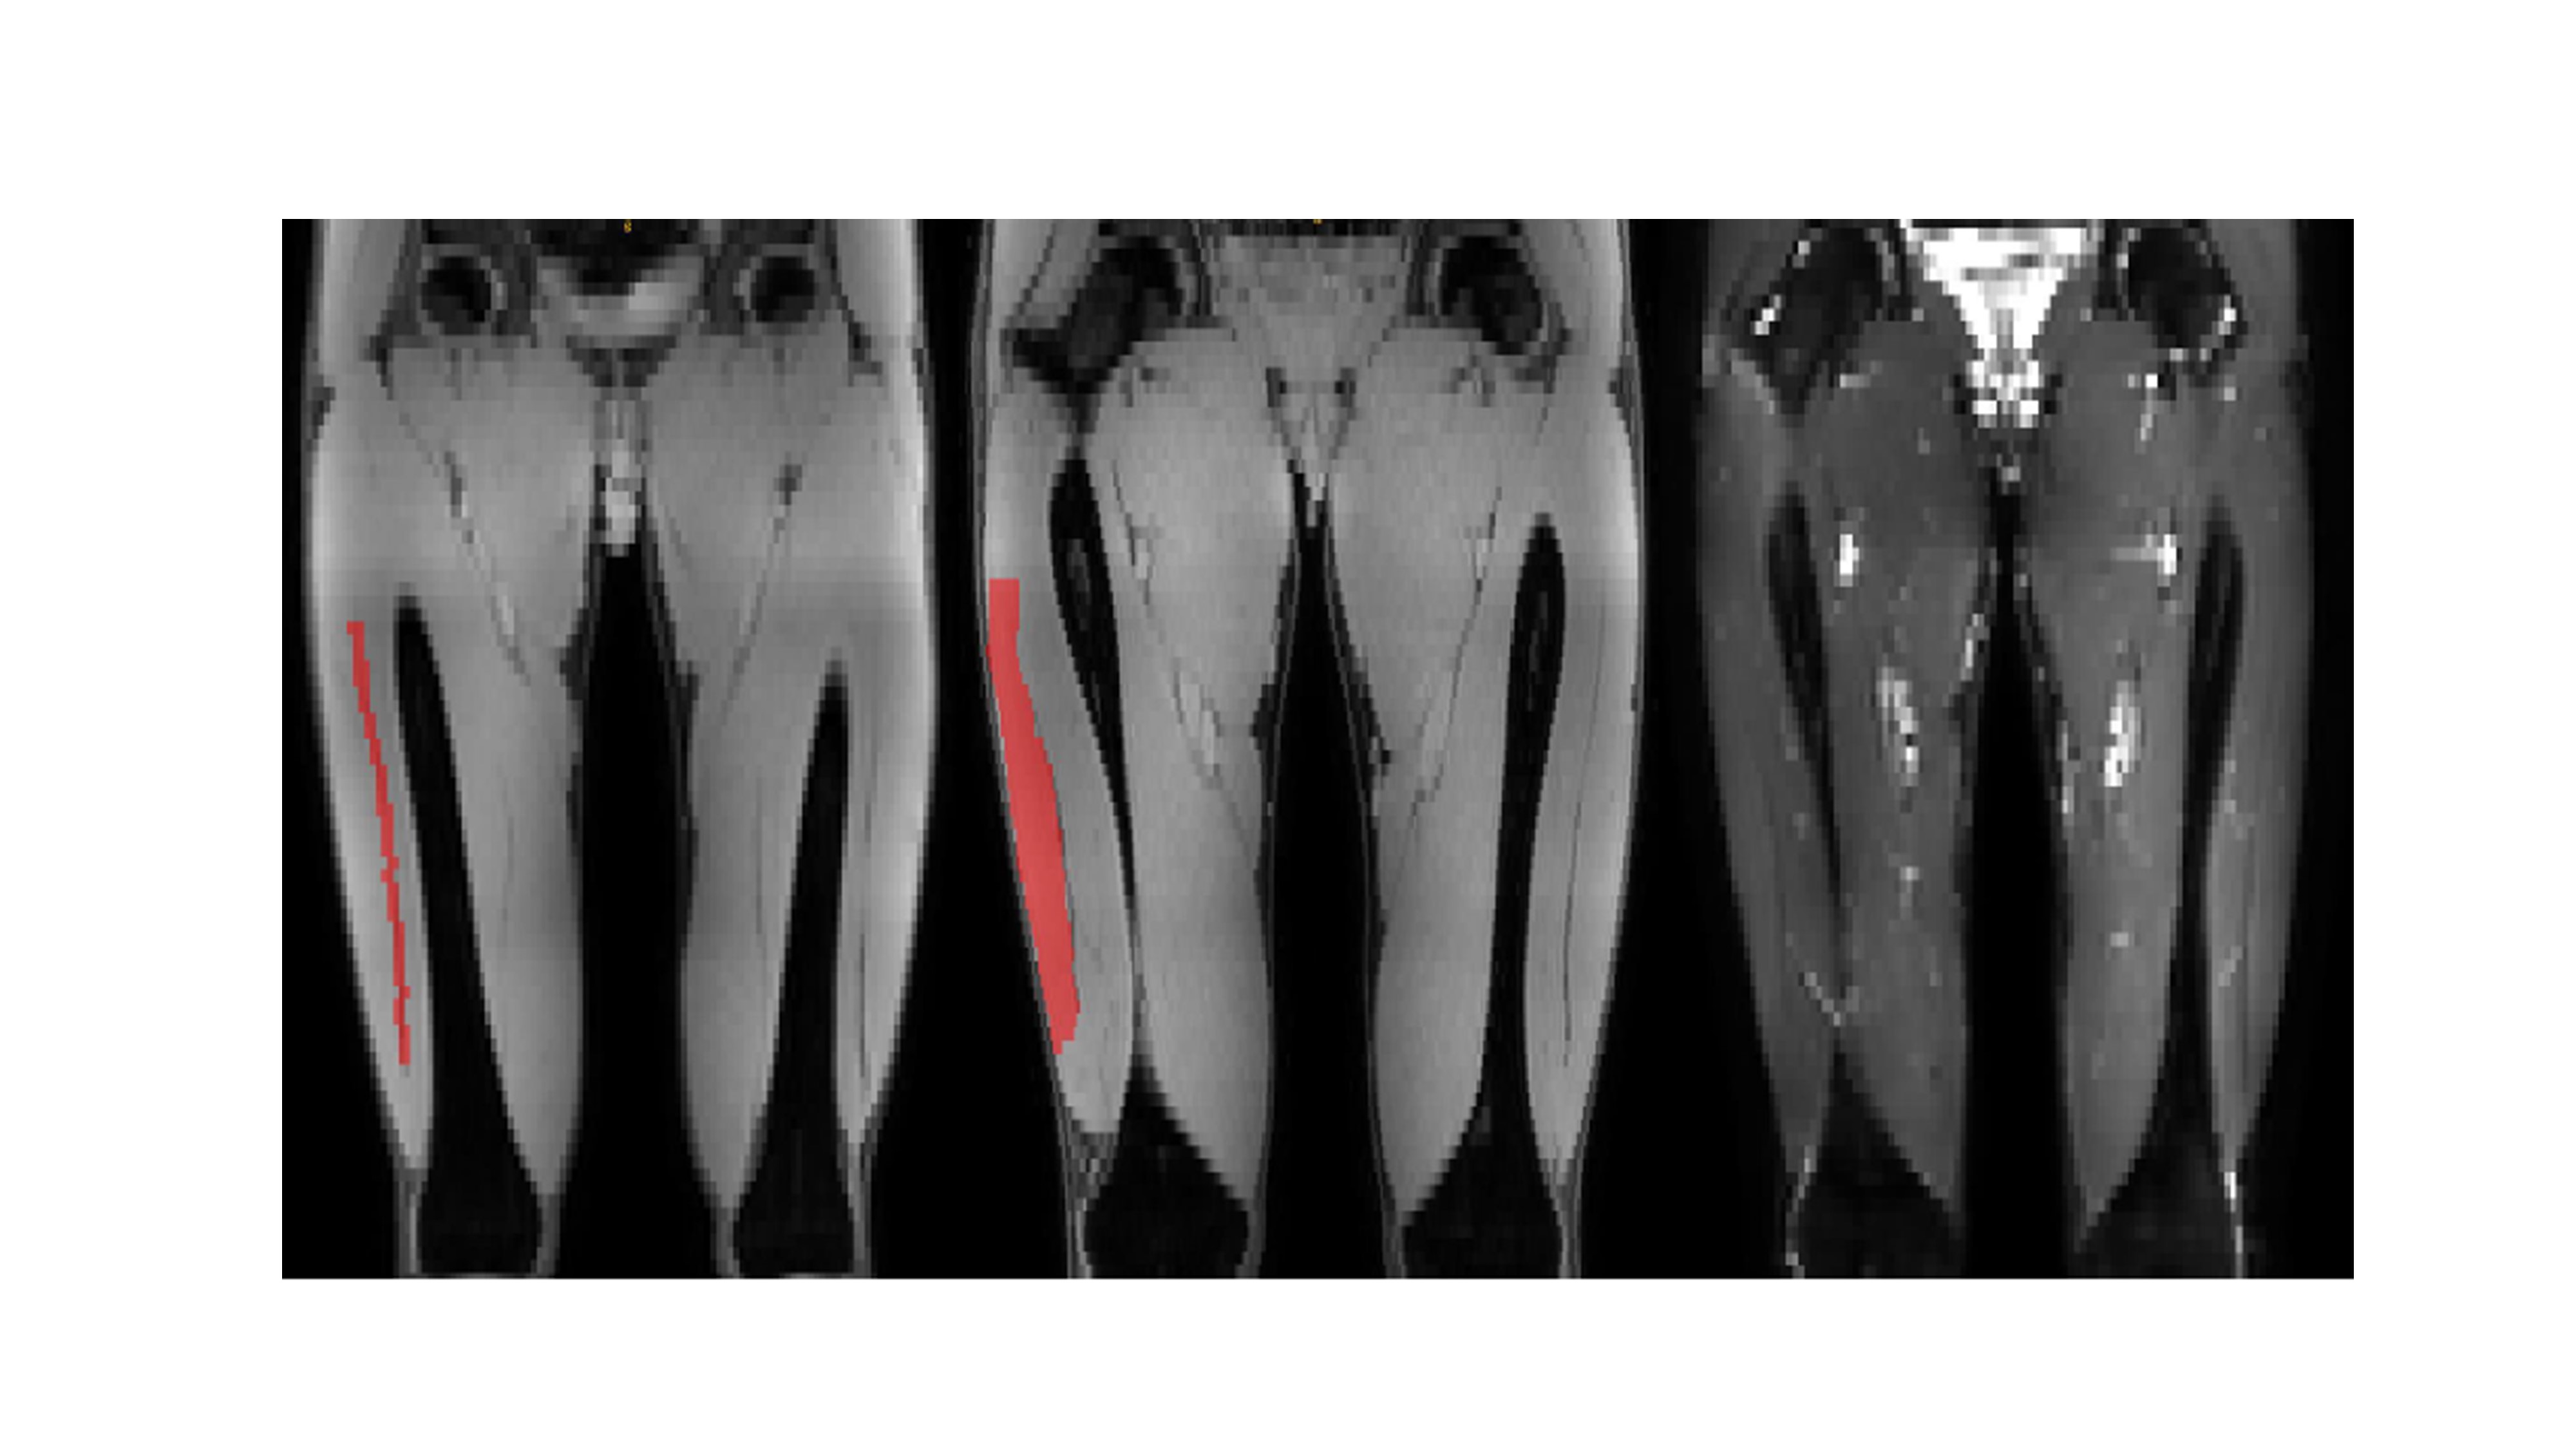
MRI of the upper legs was performed in supine position with the legs stretched in nine healthy participants (age range: 22-64 years; 5 males) at 3T (Philips ingenia) using a 16-channel anterior coil and the 10-channel table posterior coil. MRI consisted of a 3-point Dixon scan as anatomical reference (FFE; TR/TE1/ΔTE=8/1.33/1.1ms, FOV=480x276 x186mm3, voxel-size=1.5x1.5x3.0mm3, 4 echoes) and a DTI scan (SE-EPI; 48 gradient directions, b-value=0 & 400s/mm2, FOV=480x276x186mm3, voxel-size=3.0x3.0x6.0mm3, TR/TE=4630/53ms, fat-suppression: SPAIR and SSGR [4], NSA: 3) for the pennation-angle assessment (Figure 1). On the same day 3D-US acquisitions of the Vastus Lateralis muscle were obtained in the same position as for the MRI with a 5-cm 12.5MHz linear-array probe (imaging depth: 8cm, acoustic frequency: 30Hz).Data-Analysis
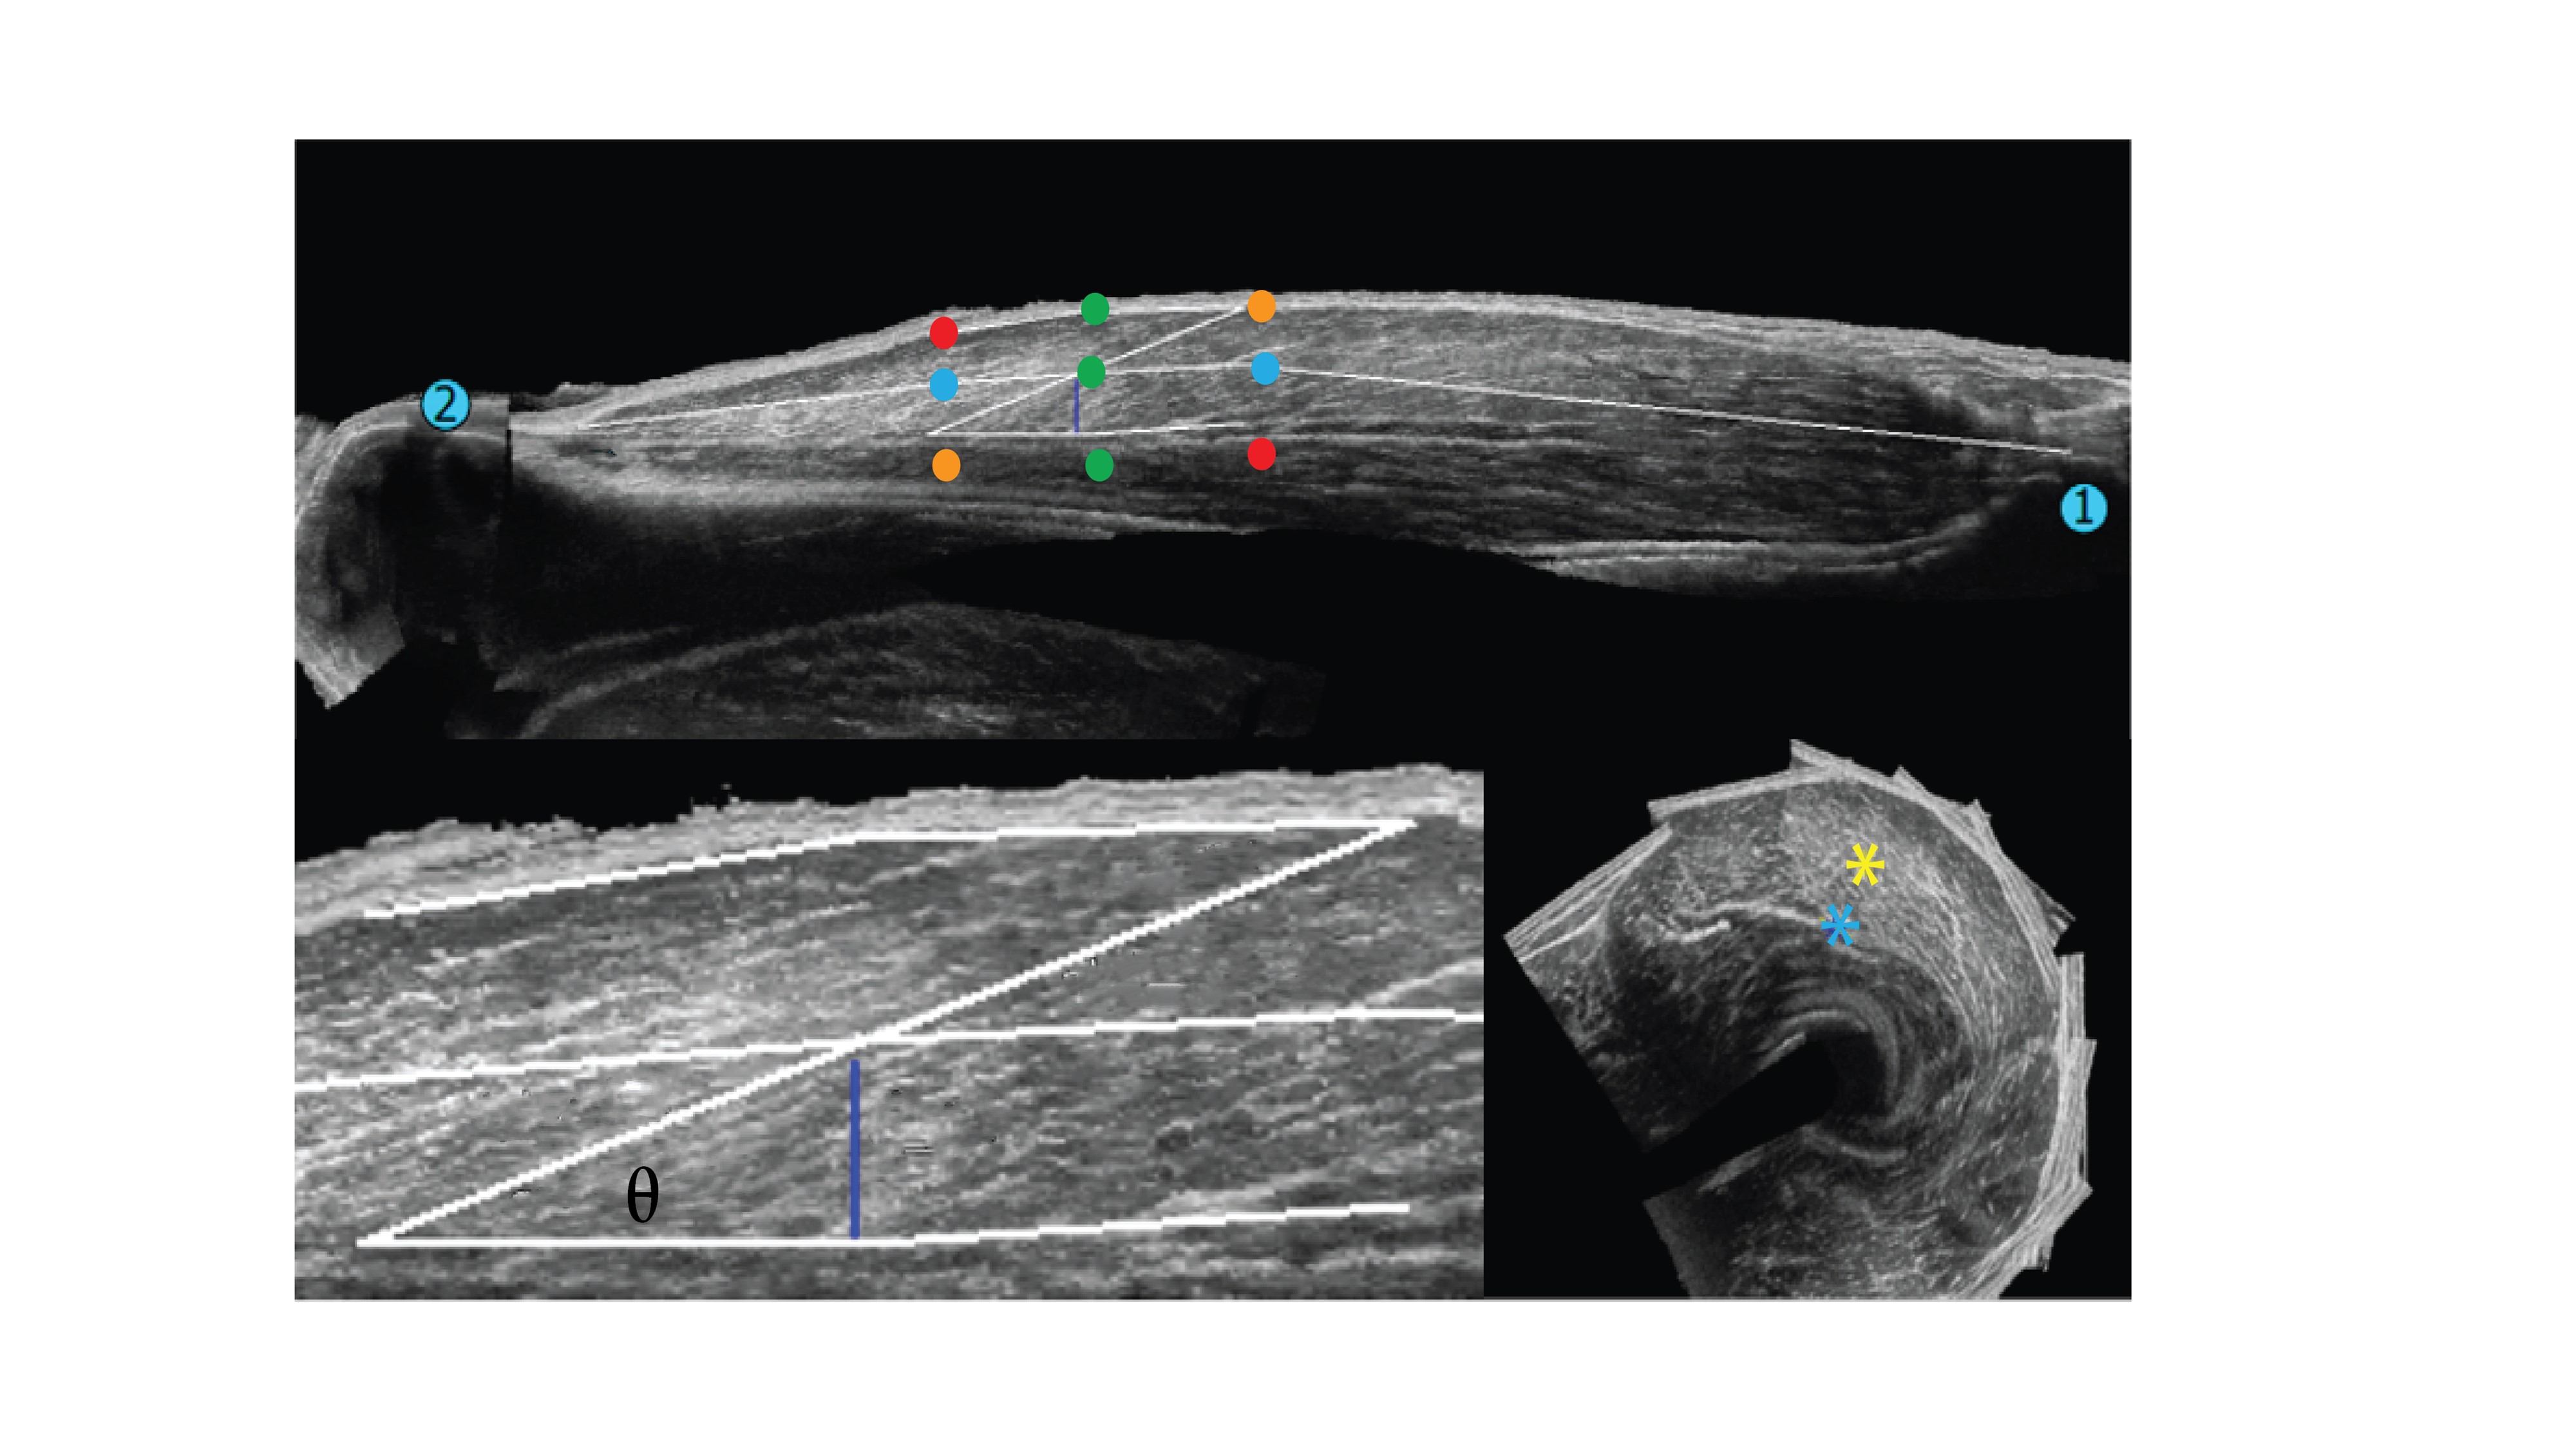
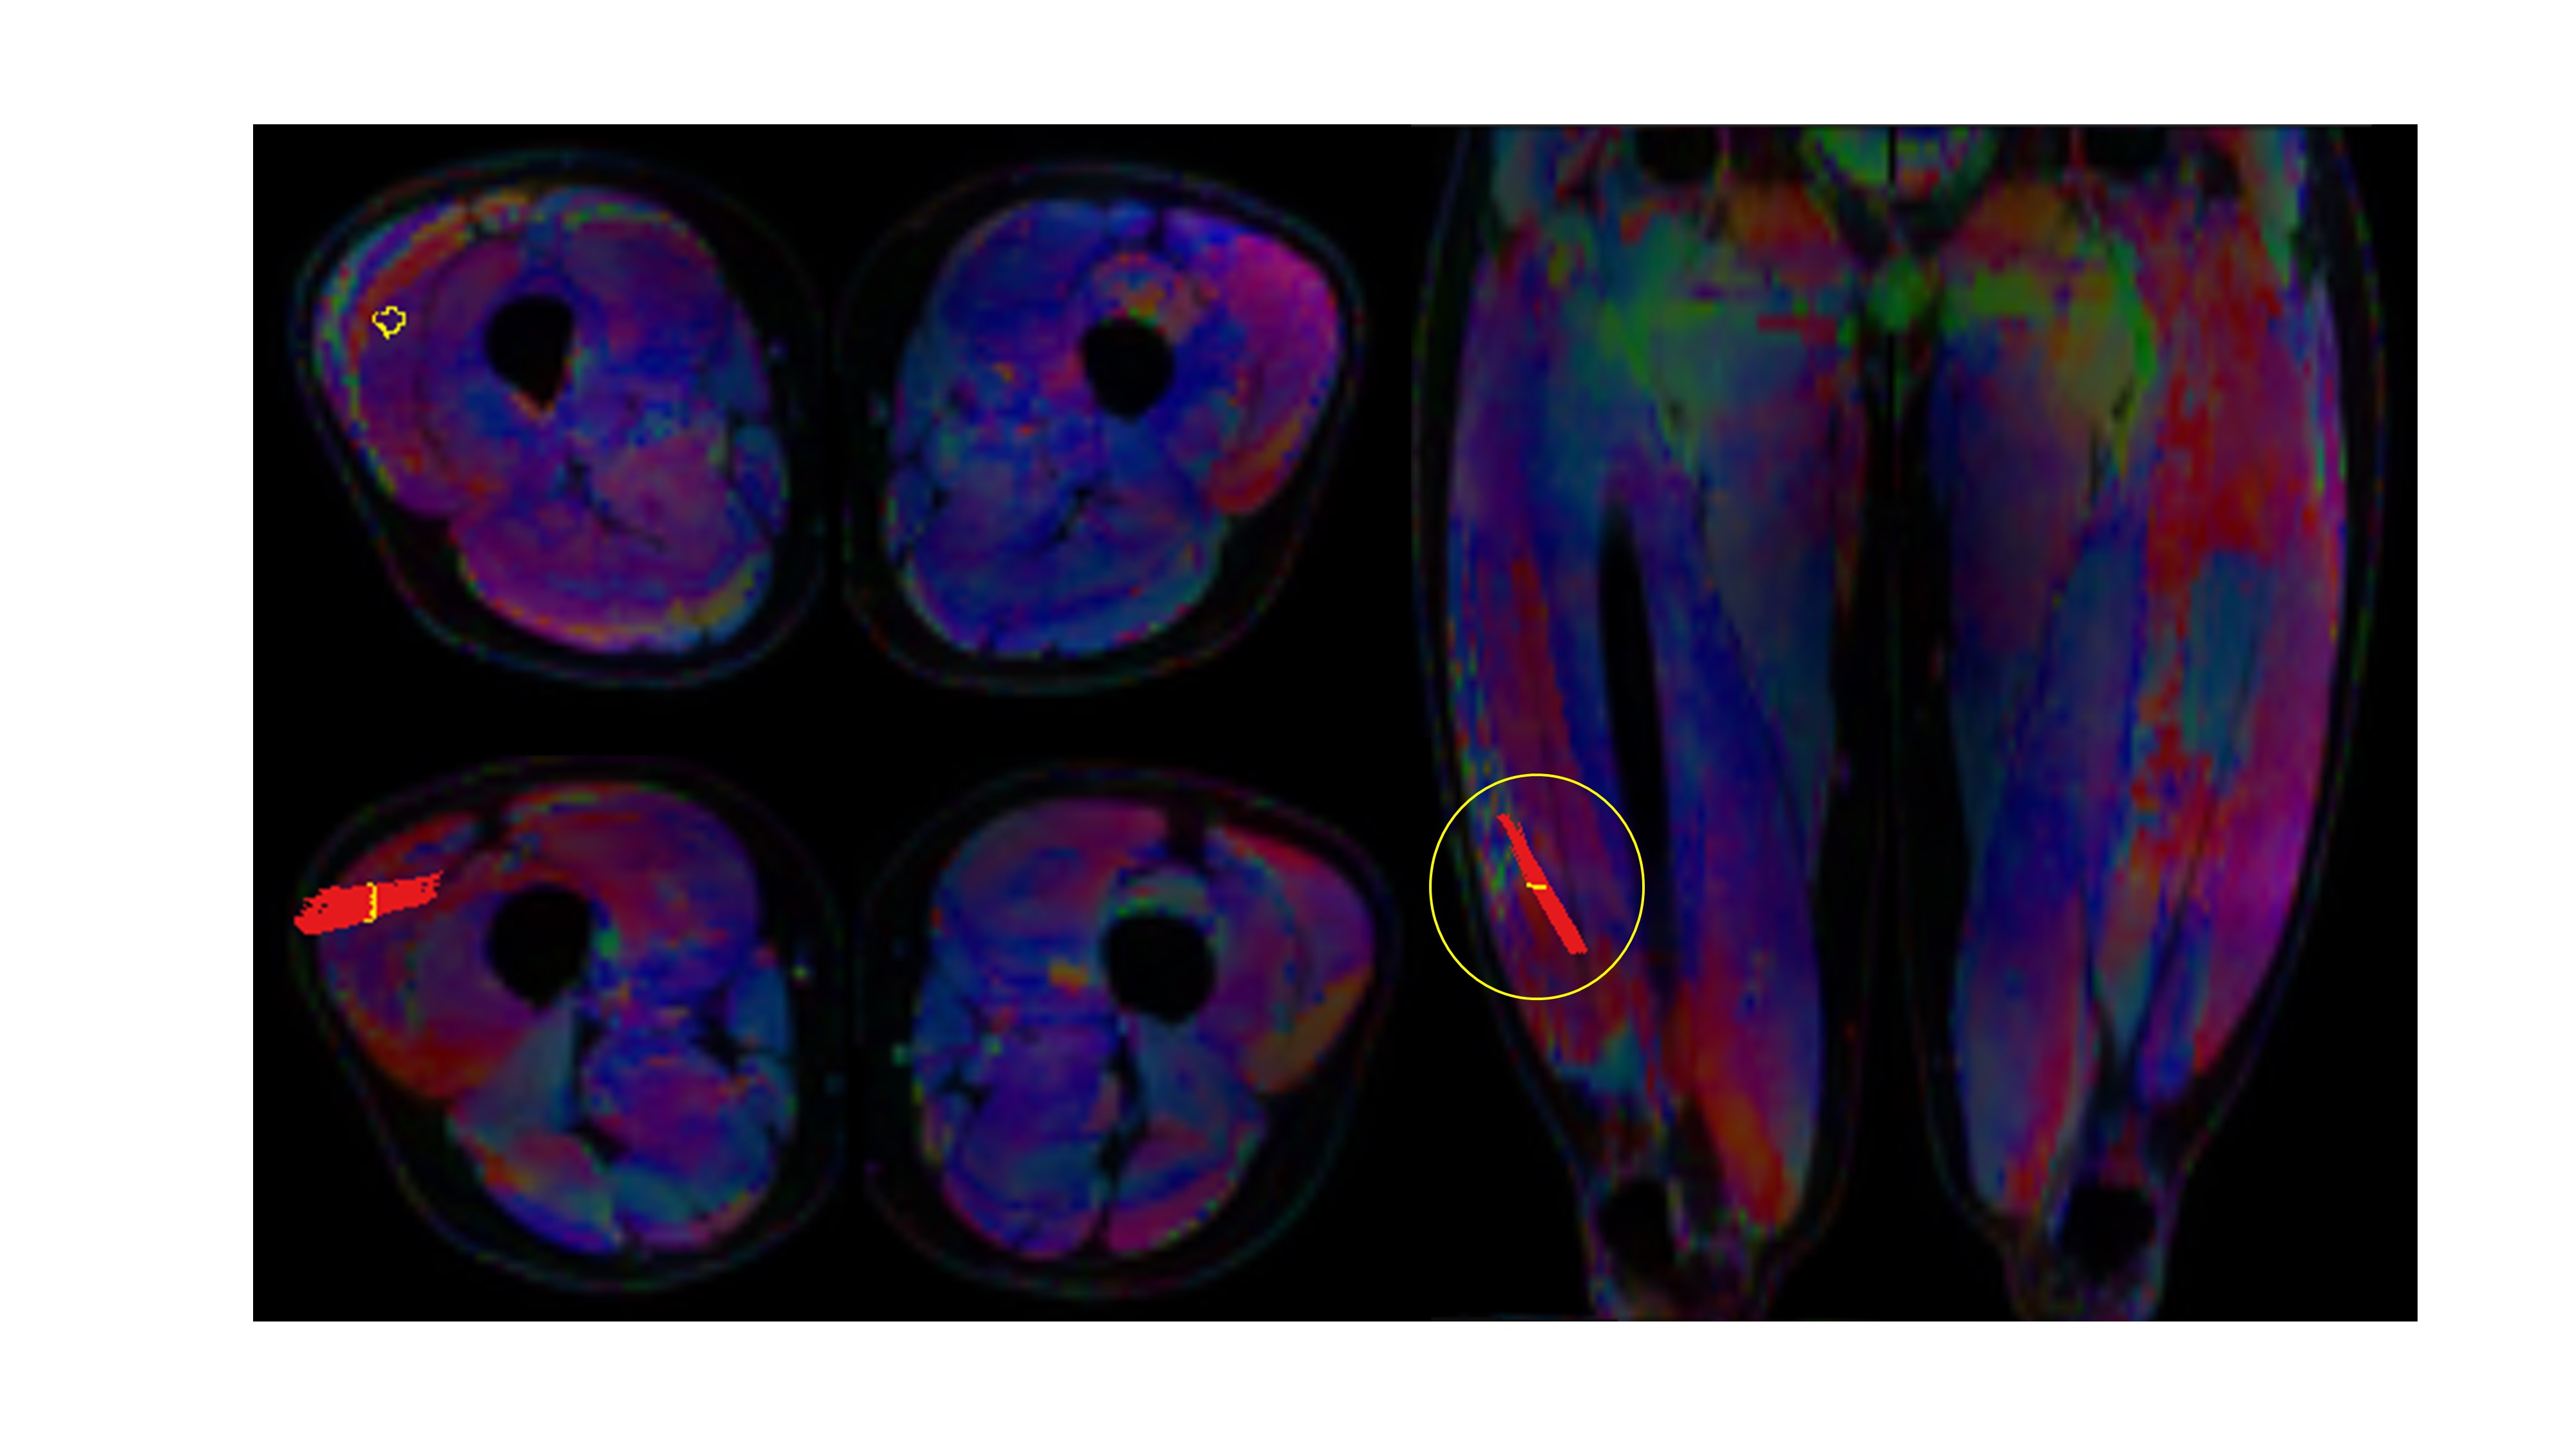
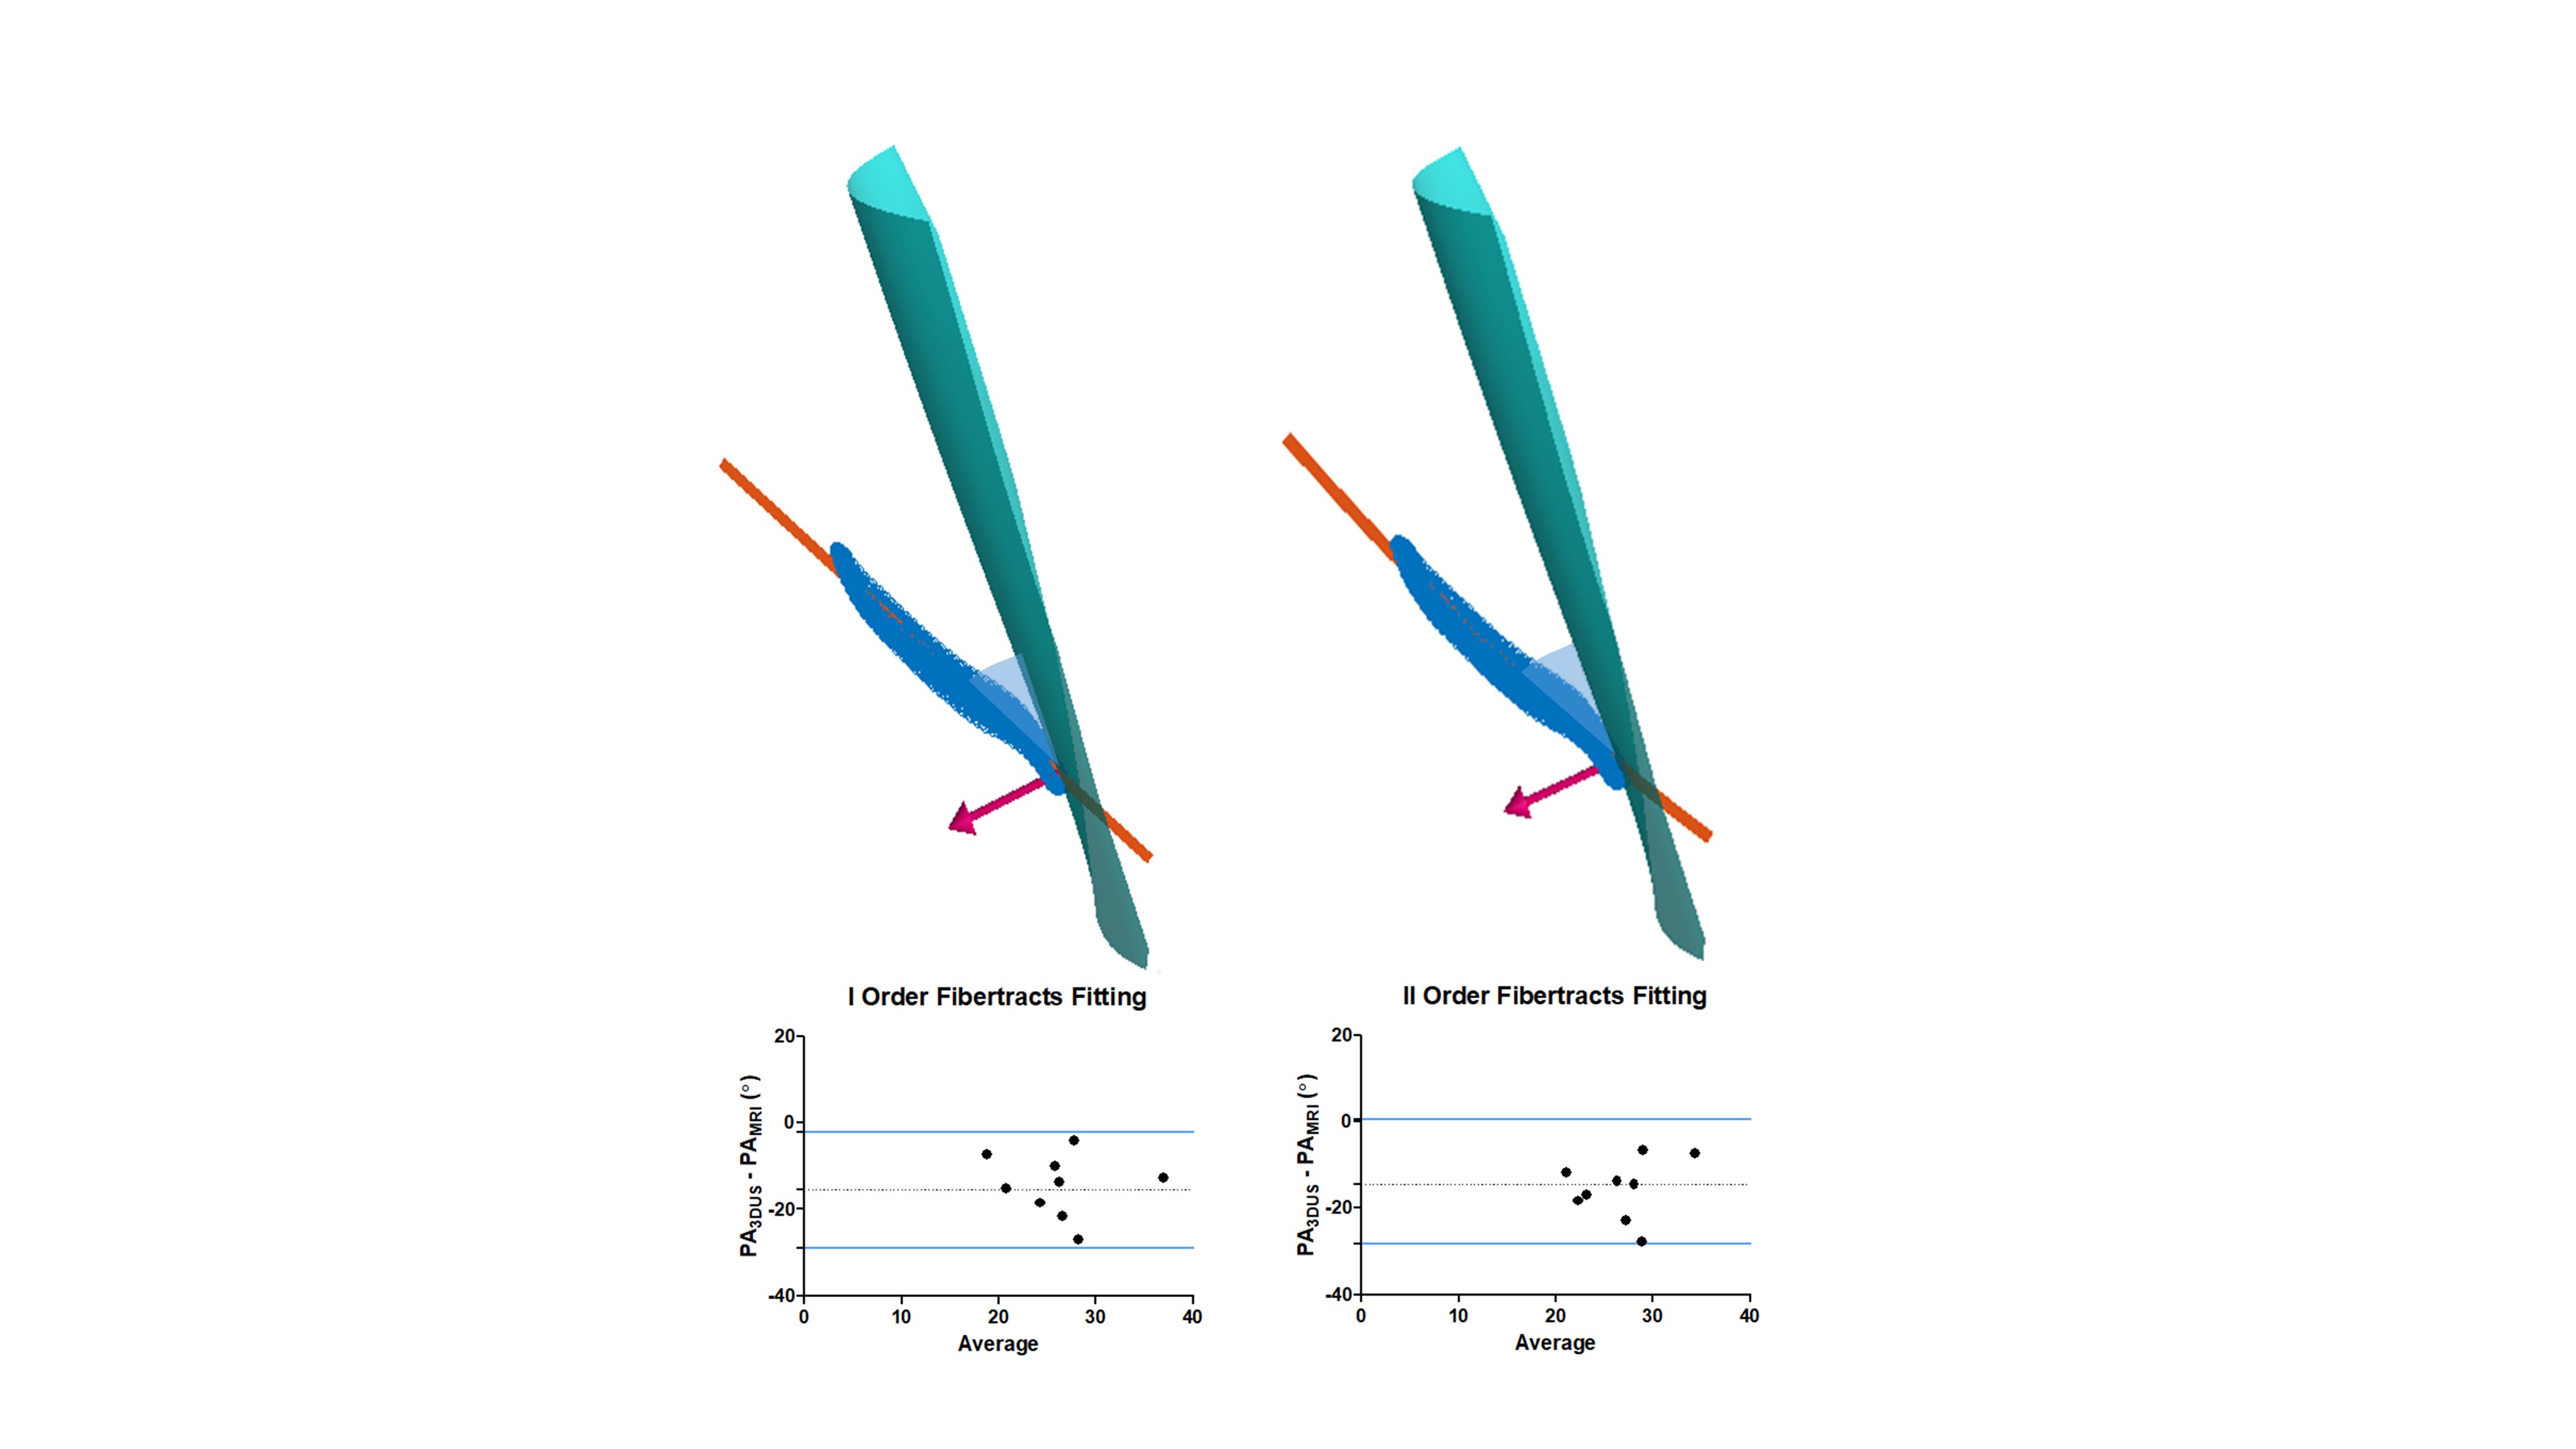
For both modalities the pennation angle was defined as the angle between the aponeurosis and the muscle fascicles passing by the central point at two third point within the muscle belly in the mid-longitudinal plane (Figure 2). More details on 3D-US pennation angle measurements were previously described [5]. DTI data were acquired in 3 stacks, joined and post-processed using QMRITools for Mathematica [6]. The post-processing consisted of denoising, registration and tensor calculation. DTI fibertracts were obtained from the fitted tensor starting in a 3 by 3 pixel Region-Of-Interest (ROI) located in the center of the muscle (settings: max angle=15°, step-size=1.5mm, FA range=[0.1-0.6] [7]) (Figure 3). Fibertracts were fitted to 1st- (linear) and 2nd-order polynomial lines. The deep aponeurosis of the Vastus Lateralis was manually segmented using ITK-snap [8], fitted to a polynomial surface after which the surface normals and tangents were calculated. The pennation angle was defined as the angle between the fitted aponeurosis surface and the fitted fibertracts at the intersection point between aponeurosis and fibers (Figure 4). For the comparison of the pennation angles between the two modalities, Bland-Altman analysis, paired t-test and the intra-class correlation coefficient (ICC) (two-way random effect, consistency agreement, multiple measurements) were used [9].Results
A total of nine datasets were successfully acquired and measurements of the pennation angles were calculated from both imaging modalities. The average pennation angle measured with 3D-US was 18.9°± 5.9°, whereas the pennation angles measured with the DTI fiber-tractography based approach were systematically and substantially higher, 33.3°±6.7° for the straight line fit, and 34.5°±4.8° for the 2nd order polynomial fit. The Bland-Altman analysis between 3D-US and DTI resulted in bias:-14.4° ±7.1°, LoA=[-28.4° 0.4°], p=0.0001 , ICC=0.5, 95% confidence interval= [0.5° 0.9°] for the straight line fiber fit and bias:-15.5°±6.9°, LoA=[-29.0° -2.0°], p= 0.0003, ICC= 0.3, 95% confidence interval = [0.3° 0.8°] for the 2nd order polynomial fit (Figures 4 and 5).Discussion
The pennation angles which were obtained with DTI fiber-tractography were larger than the ones which were obtained with 3D-US. Previous studies show values in the range between 6° and 28° [10, 11]. Although both techniques separately resulted in consistent pennation angle values, the reason for this discrepancy between techniques needs further investigation. There are a couple of reasons, both of technical and physiological nature, that could have contributed to the difference. First of all, 3D-US involves in-painting of a 3D volume by sweeping a linear ultrasound probe across the muscle and 3D position tracking with an external device, which involves several registration steps. Similarly, the DTI dataset needs registration to the anatomical DIXON data to compensate for field-inhomogeneity induced distortions of the EPI-based diffusion-weighted acquisitions. We will further investigate to which extent 3D-US and DTI Vastus Lateralis volumes match and/or whether post-processing in one of the two imaging modalities has introduced a systematic bias. Moreover, in 3D-US the analysis was done in 2D by selecting a plane in the 3D volume. Secondly, due to space limitations in the MRI, DTI and 3D-US measurements were performed in supine position with the leg stretched. The sarcomeres of the resting Vastus Lateralis, however, would be at near optimal length at 60° of knee flexion [12]. The lower knee angle could have resulted in wavy and curved relaxed fibers, which is probably somewhat more difficult to quantify using 3D-US as opposed to 3D DTI.Conclusions
We have compared two advanced 3D imaging modalities for the assessment of pennation angle. Future research will be aimed at further investigating the nature of the differences and to assess the reliability and the applicability of the pennation angle quantification.Acknowledgements
No acknowledgement found.References
1. Kwah, Li Khim, et al. "Reliability and validity of ultrasound measurements of muscle fascicle length and pennation in humans: a systematic review." Journal of applied physiology 114.6 (2013): 761-769.
2. Hiblar T, Bolson EL, Hubka M, Sheehan FH, Kushmerick MJ. Three dimensional ultrasound analysis of fascicle orientation in human tibialis anterior muscle enables analysis of macroscopic torque at the cellular level. In Molecular and Cellular Aspects of Muscle Contraction
3. Damon, B. M., Froeling, M., Buck, A. K. W., Oudeman, J., Ding, Z., Nederveen, A. J., Bush, E. C. & Strijkers, G. J. Skeletal muscle diffusion tensor-MRI fiber tracking: rationale, data acquisition and analysis methods, applications and future directions. Nmr Biomed 30, e3563 (2017).
4. Williams SE, Heemskerk AM, Welch EB, Li K, Damon BM, Park JH. Quantitative effects of inclusion of fat on muscle diffusion tensor MRI measurements. J Magn Reson Imaging. 2013 Nov;38(5):1292-7. doi: 10.1002/jmri.24045. Epub 2013 Feb 15. PMID: 23418124; PMCID: PMC3664247.
5. Weide, Guido, et al. "3D ultrasound imaging: Fast and cost-effective morphometry of musculoskeletal tissue." JoVE (Journal of Visualized Experiments) 129 (2017): e55943.
6. Froeling, Martijn. "QMRTools: a Mathematica toolbox for quantitative MRI analysis." Journal of Open Source Software 4.38 (2019): 1204.
7. Forsting, Johannes, et al. "Diffusion tensor imaging of the human thigh: consideration of DTI-based fiber tracking stop criteria." Magnetic Resonance Materials in Physics, Biology and Medicine 33.3 (2020): 343-355.
8. Paul A. Yushkevich, Joseph Piven, Heather Cody Hazlett, Rachel Gimpel Smith, Sean Ho, James C. Gee, and Guido Gerig. User-guided 3D active contour segmentation of anatomical structures: Significantly improved efficiency and reliability. Neuroimage. 2006 Jul 1; 31(3):1116-28.
9. IBM Corp. (2017). IBM SPSS Statistics for Windows. Armonk, NY: IBM Corp. Retrieved from https://hadoop.apache.org
10. Rutherford, O. M., and D. A. Jones. "Measurement of fibre pennation using ultrasound in the human quadriceps in vivo." European journal of applied physiology and occupational physiology 65.5 (1992): 433-437.
11. Chauhan, Bhawesh, Maher A. Hamzeh, and Antonio I. Cuesta-Vargas. "Prediction of muscular architecture of the rectus femoris and vastus lateralis from EMG during isometric contractions in soccer players." Springerplus 2.1 (2013): 1-8
12. Chen, Xuefeng, et al. "Changes in sarcomere lengths of the human vastus lateralis muscle with knee flexion measured using in vivo microendoscopy." Journal of biomechanics 49.13 (2016): 2989-2994.
Figures