3399
Transient Biochemical Recovery of Skeletal Muscles Post-exercise with Simultaneous Dynamic T1rho and T2 Mapping1Department of Radiology, Albert Einstein College of Medicine and Montefiore Medical Center, Bronx, NY, United States, 2Department of Medical Physics, Memorial Sloan Kettering Cancer Center, New York, NY, United States
Synopsis
T1ρ and T2 contrasts provide complementary information on tissue properties. Therefore, their transient recovery after exercise to pre-exercise equilibria is potentially a functional biomarker for muscle disorder diagnosis and treatment evaluation. In this pilot study, we implemented and tested a high-temporal-resolution dynamic MRI sequence for simultaneous T1ρ and T2 mapping immediately after exercise. T1ρ and T2 contrasts presented unique transient recovery time courses in different skeletal muscles. Dynamic information derived from our imaging approach could potentially lead to greater sensitivity and specificity in evaluating muscle conditions compared with traditional methods with either T1ρ or T2 contrast alone.
Introduction
Quantitative biochemical MRI techniques including T1ρ and T2 mapping have been applied to characterize biochemical microenvironment alterations in muscle tissues.1, 2 For example, muscle fibrosis is associated with loss of macromolecules such as proteoglycans with excessive collagen. T1ρ contrast is sensitive to interactions related to the chemical exchange between extra-cellular water and macromolecules (such as proteoglycans in muscles), while T2 contrast is sensitive to water content and collagen content and structure.3 Therefore, T1ρ and T2 contrasts provide complementary information on tissue properties. Previous research studies have utilized only one of the contrast mechanisms, typically under a static setting. It has been shown that exercise transiently increases the skeletal muscle water, and the associated T1ρ and/or T2 changes. Therefore, their transient recovery to pre-exercise equilibria is potentially a functional biomarker for muscle disorder diagnosis and treatment evaluation.4, 5 In this pilot study, we implemented and tested a high-temporal-resolution dynamic MRI sequence for simultaneous T1ρ and T2 mapping on a cohort of healthy young volunteers to investigate the transient biochemical recovery of skeletal muscles post-exercise to: 1) demonstrate the technical feasibility; 2) compare the T1ρ and T2 recovery response characteristics for different muscle groups; and 3) identify possible quantitative biomarkers for muscle tissue evaluation.Methods
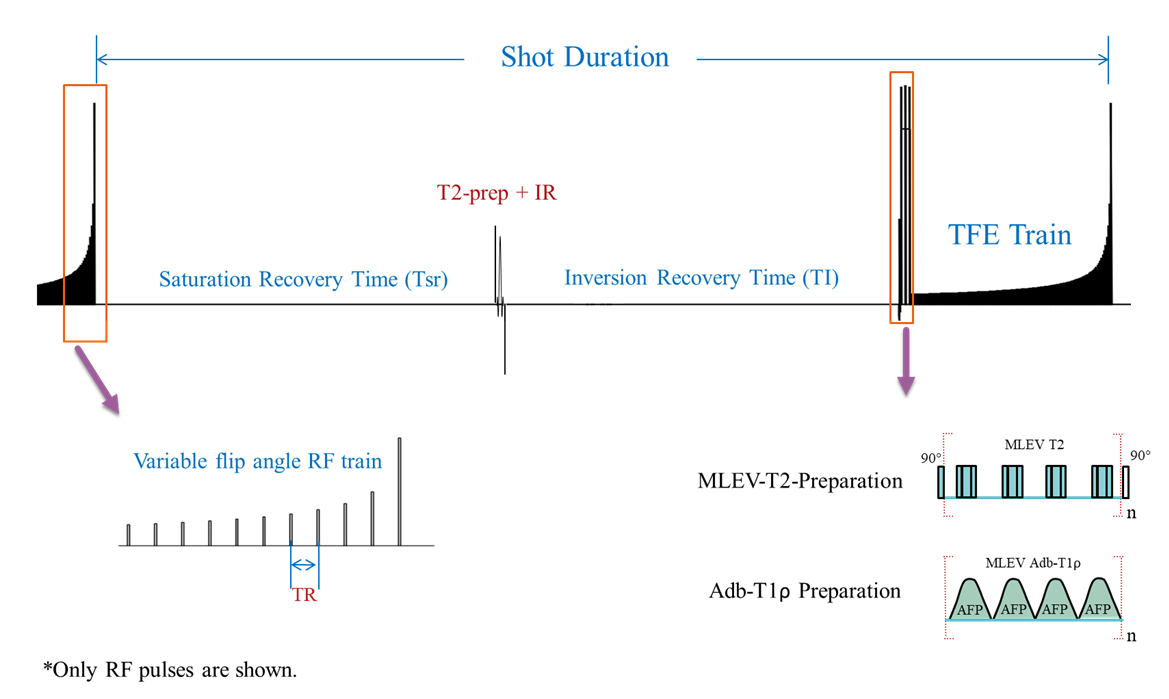
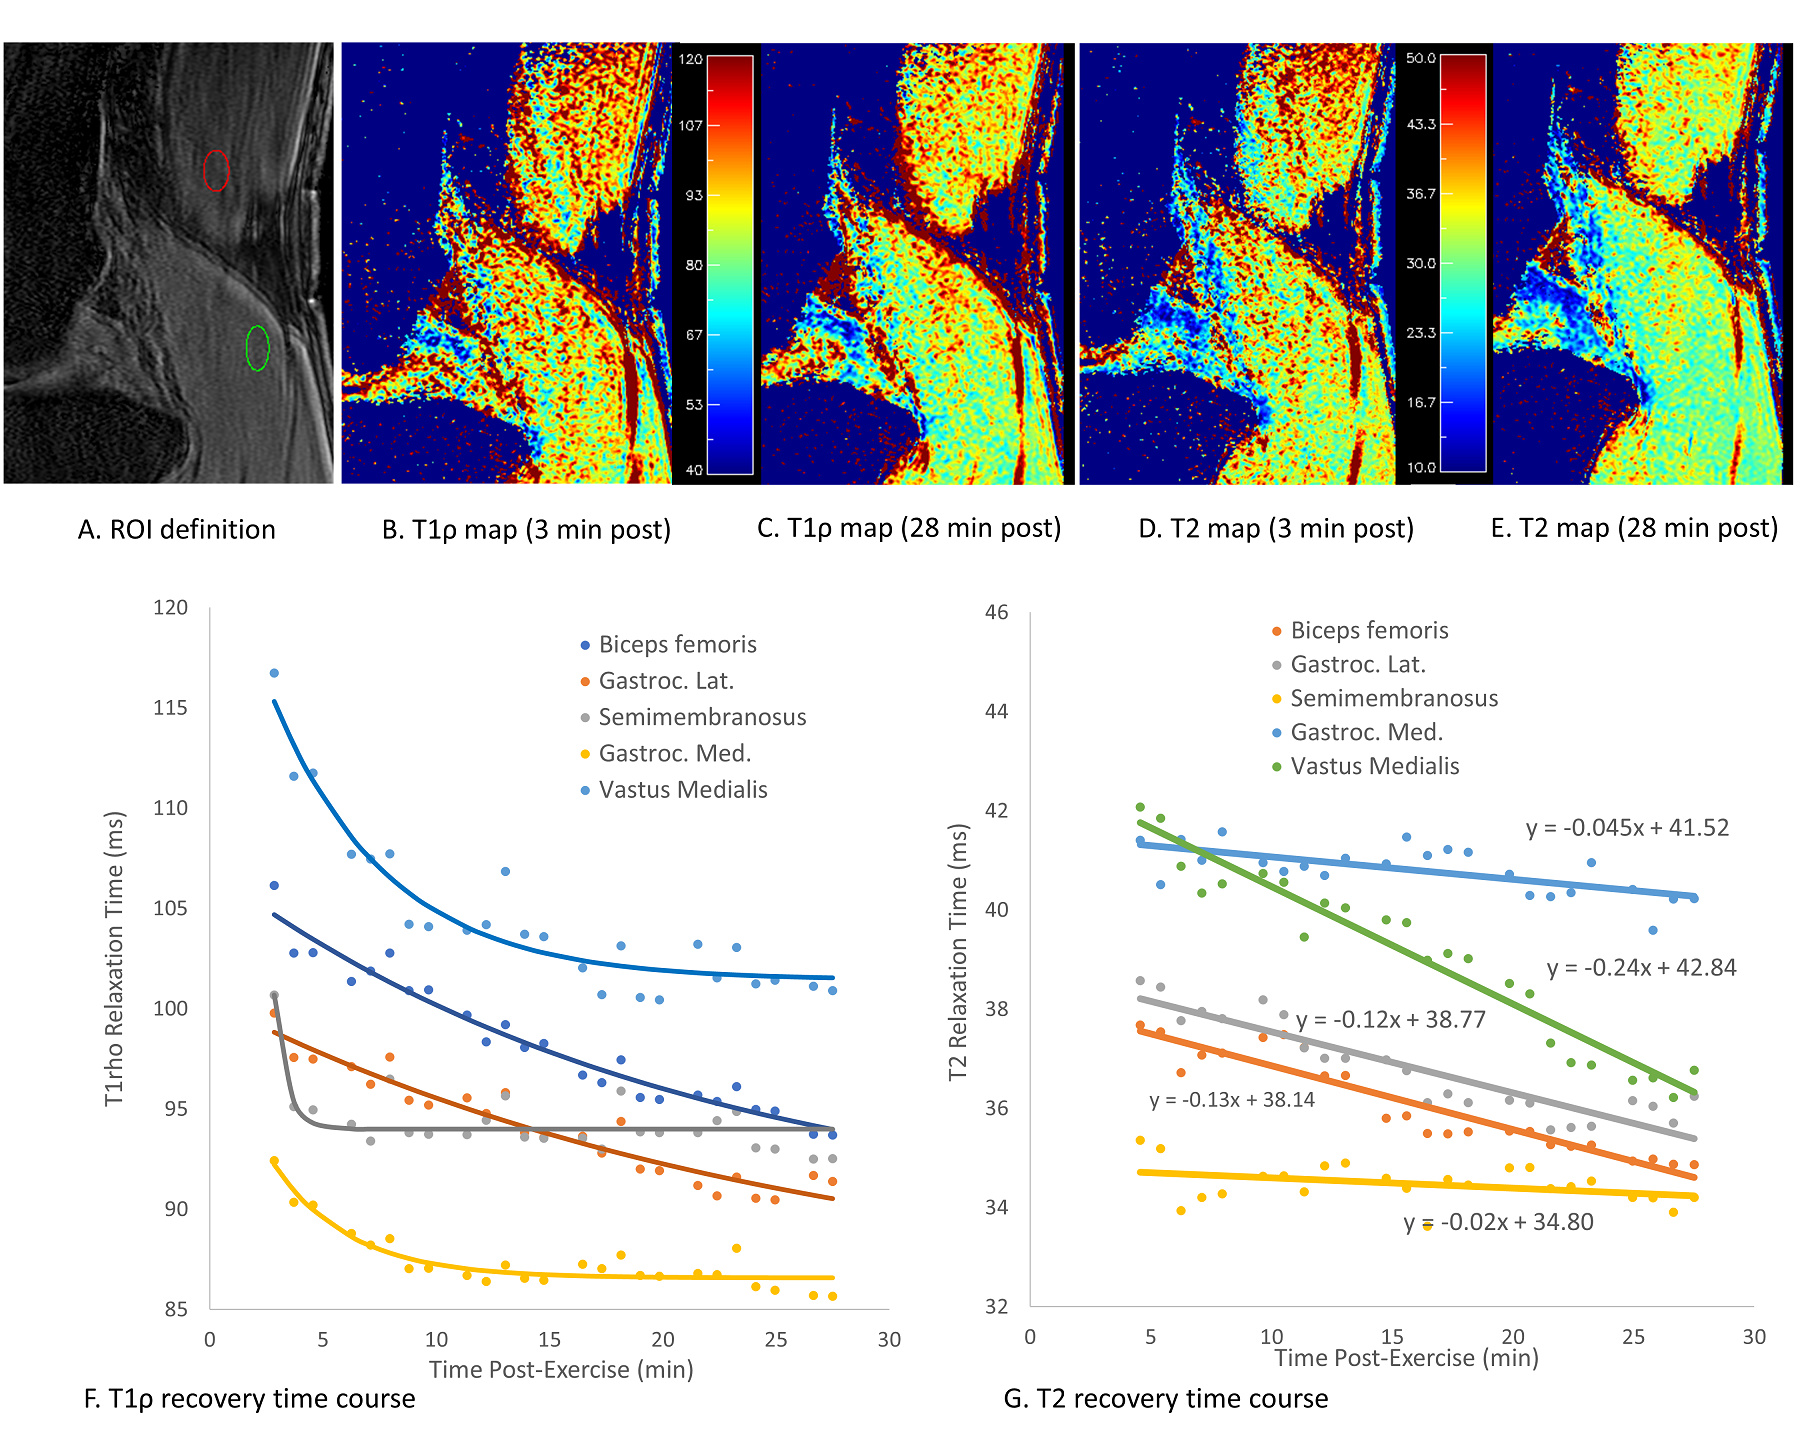
Six healthy volunteers (5 male, 1 female, ages 27-33) with no known muscle-related conditions were recruited. Participants avoided strenuous activity for 24 hours, prior to 20 min of stair-climbing activity. Subjects were immediately scanned (<2.5 min post-exercise) on a 3T whole-body MR scanner (Philips Ingenia Elition) with a 1Tx/16Rx knee coil. Both adiabatic T1ρ (adb-T1ρ) and T2 mapping were integrated into a single MAPSS sequence using an unpaired phase-cycling scheme to improve imaging speed (Figure 1).6-8 The sequence schematic is shown in Figure 1. The adb-T1ρ preparation had an RF train of adiabatic pulses (HS1), B1max = 26.19µT, ωmax=1.27kHz, and R=6.9 The adb-T1ρ and T2 preparations had 3D acquisitions with TSL=96+, 96- and TE = 40+, 40- ms acquired in an interleaved fashion with alternating phase-cycling, in addition to sharing the same TSL/TE=0ms acquisition.6, 7 Other parameters included Tsr=2.5s, TI=1480ms, GRE readout train length=128, and compressed SENSE factor of 4. The 3D dynamic sequence had ~1 min temporal resolution with 0.4×0.7×4mm3 spatial resolution for ~25 minutes. Dynamic T1ρ and T2 maps were generated simultaneously using a moving window approach sequentially along the dynamic (temporal) direction after motion correction using Elastix.7 In each curve fitting, complex-valued images were used in an optimization algorithm based on Powell minimization function in IDL. Seven regions-of-interest (ROIs) were drawn on five muscles around the knee joint (medial and lateral heads of gastrocnemius, short head of biceps femoris, semimembranosus, and vastus medialis) (Figure 2A). T1ρ changes over time of these ROIs were curve-fitted using a mono-exponential recovery model to obtain the characteristic recovery time. Similarly, T2 changes over time were fitted with a linear model to obtain the recovery rate (defined as the slope). The T1ρ and T2 recovery characteristics were compared for different muscle groups.Results
Representative T1ρ and T2 maps at ~3 min and ~28 min post-exercise are shown in Figures 2B-2E. The recovery time courses of T1ρ and T2 are shown in Figures 2F and 2G, respectively. Both T1ρ and T2 values for all muscles decreased from the initial values during the dynamic scan duration. However, T1ρ and T2 of different muscles had unique recovery amplitudes and time characteristics. Among all, vastus medialis had both high recovery amplitude and fast recovery (T1ρ characteristic recovery time of 5.12 min, and T2 recovery rate -0.24ms/min). Biceps femoris and lateral gastrocnemius had slower T1ρ recovery time of 20.5 and 25 min respectively, while those of semimembranosus and medial gastrocnemius were less than 4 min. For T2 recovery, medial gastrocnemius and semimembranosus underwent the smallest decrease in T2 values within the scan duration, while vastus medialis had greatest reduction. T1ρ contrast showed much higher dynamic range than T2 contrast, potentially leading to higher sensitivity for muscle biochemical changes post-exercise.Discussion
We demonstrate the technical feasibility for simultaneous T1ρ and T2 mapping during the transient recovery phase post-exercise. The major novel finding was the different transient recovery characteristics between T1ρ and T2 contrasts, as well as among different muscle groups around the knee joint following 20-min stair-climbing. Notable, the T1ρ and T2 recovery time courses seemed to follow exponential decay and linear decay respectively. Although T1ρ and T2 contrasts are correlated, this observation further supports that they offer complementary information of tissue properties. Therefore, imaging both simultaneously may provide synergistic information to unravel the complicated biochemical, hemodynamic, and functional processes during the transient recovery phase after exercise, especially in myopathic conditions. Dynamic information derived from our imaging approach could potentially lead to greater sensitivity and specificity in evaluating muscle conditions compared with traditional methods with either T1ρ or T2 contrast alone.Acknowledgements
No acknowledgement found.References
1. Laakso H, Wirth G, Korpisalo P, et al. T2 , T1rho and TRAFF4 detect early regenerative changes in mouse ischemic skeletal muscle. NMR Biomed. 2018;31(5):e3909.
2. Zhao Y, Guo L, Jiang Y, et al. Assessment of Calf Skeletal Muscle in Male Type 2 Diabetes Mellitus Patients with Different Courses Using T1rho Mapping. J Clin Endocrinol Metab. 2021.
3. Noehren B, Hardy PA, Andersen A, et al. T1rho imaging as a non-invasive assessment of collagen remodeling and organization in human skeletal muscle after ligamentous injury. J Physiol. 2021.
4. Patten C, Meyer RA, Fleckenstein JL. T2 mapping of muscle. Semin Musculoskelet Radiol. 2003;7(4):297-305.
5. Tawara N, Nitta O, Kuruma H, et al. T2 mapping of muscle activity using ultrafast imaging. Magn Reson Med Sci. 2011;10(2):85-91.
6. Peng Q, Wu C, Kim J, et al. Efficient Phase Cycling Strategy for High Resolution 3D GRE Quantitative MRI Mapping. NMR in Biomedicine. 2021;Under Review.
7. Peng Q, Wu C. High Spatial Resolution Simultaneous Quantitative T1rho and T2 Mapping at 3T. AAPM Annual Meeting. 2021.
8. Li X, Han ET, Busse RF, et al. In vivo T(1rho) mapping in cartilage using 3D magnetization-prepared angle-modulated partitioned k-space spoiled gradient echo snapshots (3D MAPSS). Magn Reson Med. 2008;59(2):298-307.
9. Wu C, Peng Q. 3D MAPSS T1ρ Mapping with Adiabatic Spin-Locking RF Pulses for Knee and Brain at 3T. Proc Intl Soc Mag Reson Med 29. 2021.
Figures