3398
Validation of Muscle Fiber Architecture of the Human Tongue Revealed by Diffusion MRI with Histology Verification1Department of Diagnostic Radiology and Nuclear Medicine, University of Maryland School of Medicine, Baltimore, MD, United States, 2Department of Radiology and Biomedical Imaging, Yale School of Medicine, New Haven, CT, United States, 3Department of Neural and Pain Sciences and Department of Orthodontics, University of Maryland School of Dentistry, Baltimore, MD, United States, 4Department of Electrical and Computer Engineering, Johns Hopkins University, Baltimore, MD, United States, 5Department of Anatomy and Neurobiology, University of Maryland School of Medicine, Baltimore, MD, United States
Synopsis
Advanced dMRI techniques have been used to resolve the complex tongue muscle architecture. However, dMRI-derived tongue muscle architecture has not been validated with histology. In this study, we validated the dMRI-derived tongue muscle architecture with histology of a tongue specimen. dMRI was acquired for a post-mortem head and a healthy volunteer. dMRI-derived muscle fiber orientations, visualized as the tractogram, were compared against microscopic histology slices of the tongue specimen. Muscle fibers in the tractograms show good correspondence with those appearing in the histology images. The study demonstrates that dMRI can accurately reveal the complex muscle architecture of the human tongue.
INTRODUCTION
An understanding of muscle architecture of the human tongue is important for research on tongue functionality. Advanced diffusion MRI (dMRI) techniques such as diffusion spectrum imaging (DSI) and high angular resolution diffusion imaging (HARDI) have been shown to successfully delineate the tongue fiber crossings in a bovine tongue1 and ex vivo human tongues2. Despite previous validation studies conducted on mammalian tongues1,3, the dMRI-derived tongue muscle architecture has not been validated against the histology of the human tongue. Our primary goal in this study is to validate the dMRI-derived muscle architecture of the human tongue with histology of an ex vivo tongue. In addition, this study provides muscle fiber visualization in the form of the tractogram for both ex vivo and in vivo human tongues for future anatomical reference.METHODS
MR data acquisitionAll MR data were acquired on a Siemens PrismaFIT 3T scanner. The ex vivo dMRI data were acquired from a whole head specimen of an 86-year-old female around 48 hours post-mortem, using a readout-segmented echo-planar diffusion sequence (RESOLVE) with the parameters: TE/TR=79/5640ms, EPI segment size=3, 36 axial slices, and b-value=2000 s/mm2. The in vivo dMRI data were acquired from a 29-year-old male healthy volunteer, using an echo-planar diffusion sequence with real-time Phase Image Texture Analysis for Motion Detection in Diffusion MRI (PITA-MDD) and re-acquisition4, 5 to minimize motion artifacts with the parameters: TE/TR=48/2600 ms, 34 axial slices, and b-value=500 s/mm2. Both scans used 2.5 mm isotropic voxel and 200 diffusion directions. Non-diffusion-weighted images with reversed phase encoding were acquired to enable distortion correction for in vivo dMRI data using the topup tool6,7 in the FMRIB Software Library (FMRIB, Oxford, UK). T2-weighted images were acquired for both cases.
Histology staining and structure tensor analysis
After MRI, the tongue specimen was excised from the whole head specimen after fixation. The excised tongue was divided along the mid-sagittal plane into a left and a right half. Three sagittal slices, one mid-sagittal and two lateral-sagittal (Fig. 3, first column), and three radial-coronal slices (Fig. 4, first column) were cut from the right and the left half of the tongue, respectively. The six slices were stained with hematoxylin and eosin and then digitized. Structure tensor (ST) images were generated from the digitized stained images using the structure tensor plugin in ImageJ (NIH, Bethesda, Maryland).
Diffusion Reconstruction
Tractogram
The diffusion data were reconstructed with MRtrix3 using the constrained spherical deconvolution (CSD) method8. Fixel-based analysis9-11 was performed to estimate the fiber density and cross-section of fiber bundles. The tractograms were reconstructed using spherical-deconvolution informed filtering of tractograms (SIFT)12.
Tractography
The diffusion data were reconstructed with DSI Studio13 using generalized q-sampling imaging reconstruction14. The fiber tracts were estimated using a streamline tractography algorithm. Streamlining was stopped when a trajectory angle of greater than 15 degrees was predicted and tracts with length less than 5 mm were discarded.
RESULTS
In Fig. 1, the histology images (Figs. 1c&d) show the radiating genioglossus (GG) muscle interdigitating with left-right coursing transverse (T) muscle and anterior-posterior coursing superior longitudinal (SL) muscle. The tractogram (Fig. 1e) shows a mixed blue (GG) and red (T) region and a mixed blue (GG) and green (SL) region, corresponding to histology. Figs. 1f&g shows three perpendicular groups of muscle fibers corresponding to SL, GG, and T, which can be also seen in the tractography (Fig. 1h).In Fig. 2, the histology images (Figs. 2c&d) show T in the mostly left-right direction interdigitating with GG in the superior-inferior direction. The tractogram (Fig. 2e) shows T, a red region along the left-right direction and GG, a blue region along the SI direction, corresponding to histology. Figs. 2f&g shows three perpendicular groups of muscle fibers corresponding to T, verticalis (V), inferior longitudinal (IL) muscle, which can be also seen in the tractography (Fig. 2h).
Fig. 3 shows the mid- and lateral-sagittal slices. The stained and ST images in Figs. 3a are dominated by radiating muscle fibers representing GG. In Figs. 3b&c, the AP-coursing fibers (SL) gradually replace the radiating fibers (GG). In the tractograms, the blue region in the center (GG) in Fig. 3a becomes mixed blue (GG) and green (IL) in Fig. 3b then mostly green (IL) in Fig. 3c, matching the histology results.
Fig. 4 shows the radial-coronal slices from anterior to posterior. In the ST images, fine blue lines representing V can be seen extending to below T in ST images in Fig. 4a&b. In Fig. 4c, fine blue lines are not seen below T. In the tractograms, the mixed blue (V) and green (IL) regions in Fig. 4a&b become the mostly green (IL) region in Fig. 4c, matching the histology results.
Figs. 5 show tractograms derived from in vivo dMRI for the whole tongue at nine sagittal slice locations. IL, geniohyoid (GH), mylohyoid (MH), as well as interdigitation between GG and T, and GG and SL can be discerned.
DISCUSSION & CONCLUSION
This study demonstrates good correspondence between the muscle architecture revealed by dMRI with histology of an ex vivo human tongue. Clear muscle differentiation is possible in in vivo images, potentially beneficial to studying muscle and soft tissue anatomy in healthy and patient subjects.Acknowledgements
The study was conducted at University of Maryland School of Medicine Center for Innovative Biomedical Resources, Translational Research in Imaging @ Maryland (CTRIM) – Baltimore, Maryland. The study is supported by NIH under grant NIH/NIDCD R01 DC014717.
References
1. R. J. Gilbert, V. J. Wedeen, L. H. Magnusson, T. Benner, R. Wang, G. Dai, V. Napadow and K. Roche, "Three-dimensional myoarchitecture of the bovine tongue demonstrated by diffusion spectrum magnetic resonance imaging with tractography," The anatomical record. Part A, Discoveries in molecular, cellular, and evolutionary biology, vol. 288, no. 11, pp. 1173-1182, 2006.
2. N. M. H. Elsaid, M. Stone, S. Roys, R. P. Gullapalli, J. L. Prince and J. Zhuo, "Diffusion Spectrum Imaging Tractography of the Human Tongue," in Proceedings of the 25th Annual Meeting of ISMRM, Honolulu, Hawaii, 2017.
3. T. A. Gaige, H. S. Kwon, G. Dai, V. C. Cabral, A. R. Wang, Y. S. Nam, B. P. Engelward, V. J. Wedeen, P. T. C. So and R. J. Gilbert, "Multiscale structural analysis of mouse lingual myoarchitecture employing diffusion spectrum magnetic resonance imaging and multiphoton microscopy,"
4. Elsaid, N., Prince, J. L., Roys, S., Gullapalli, R. P., & Zhuo, J. (2019). Phase Image Texture Analysis for Motion Detection in Diffusion MRI (PITA-MDD). Magnetic resonance imaging, 62, 228–241.
5. X. Liang, P. Su, S. G. Patil, N. M. H. Elsaid, S. Roys, M. Stone, R. P. Gullapalli, J. L. Prince and J. Zhuo, “Prospective motion detection and re-acquisition in diffusion MRI using a phase image-based method-Application to brain and tongue imaging”. Magnetic resonance in medicine, 86(2), 725–737.
6. J.L.R. Andersson, S. Skare, J. Ashburner. How to correct susceptibility distortions in spin-echo echo-planar images: application to diffusion tensor imaging. NeuroImage, 20(2):870-888, 2003.
7. S.M. Smith, M. Jenkinson, M.W. Woolrich, C.F. Beckmann, T.E.J. Behrens, H. Johansen-Berg, P.R. Bannister, M. De Luca, I. Drobnjak, D.E. Flitney, R. Niazy, J. Saunders, J. Vickers, Y. Zhang, N. De Stefano, J.M. Brady, and P.M. Matthews. Advances in functional and structural MR image analysis and implementation as FSL. NeuroImage, 23(S1):208-219, 2004.
8. J.-D. Tournier, F. Calamante, and A. Connelly. Robust determination of the fibre orientation distribution in diffusion MRI: non-negativity constrained super-resolved spherical deconvolution. Neuroimage, 35 (2007), pp. 1459–72
9. D. Raffelt, J.-D. Tournier, S. Rose, G.R. Ridgway, R. Henderson, S. Crozier, O. Salvado, A. Connelly. Apparent Fibre Density: a novel measure for the analysis of diffusion-weighted magnetic resonance images. NeuroImage 59 (2012), pp. 3976–3994.
10. D.A. Raffelt, R.E. Smith, G.R. Ridgway, J.-D. Tournier, D.N. Vaughan, S. Rose, R. Henderson, A. Connelly. Connectivity-Based Fixel Enhancement: Whole-Brain Statistical Analysis of Diffusion MRI Measures in the Presence of Crossing Fibres. NeuroImage 117 (2015), pp. 40–55.
11. D.A. Raffelt, J.-D. Tournier, R.E. Smith, D.N. Vaughan, G. Jackson, G.R. Ridgway, A. Connelly. Investigating White Matter Fibre Density and Morphology using Fixel-Based Analysis. NeuroImage, 144 (2017), pp. 58-73.
12. R.E. Smith, J.-D. Tournier, F. Calamante, A. Connelly. SIFT: Spherical-deconvolution informed filtering of tractograms. NeuroImage 67 (2013), pp. 298–312.
13. F.-C. Yeh. (2021, May 15). DSI Studio (Version 2021 May). Zenodo. http://doi.org/10.5281/zenodo.4764264
14. F. Yeh, V. Wedeen and W. Tseng, "Generalized q-sampling imaging," IEEE Trans Med Imaging, vol. 29, pp. 1626-1635, 2010.
Figures
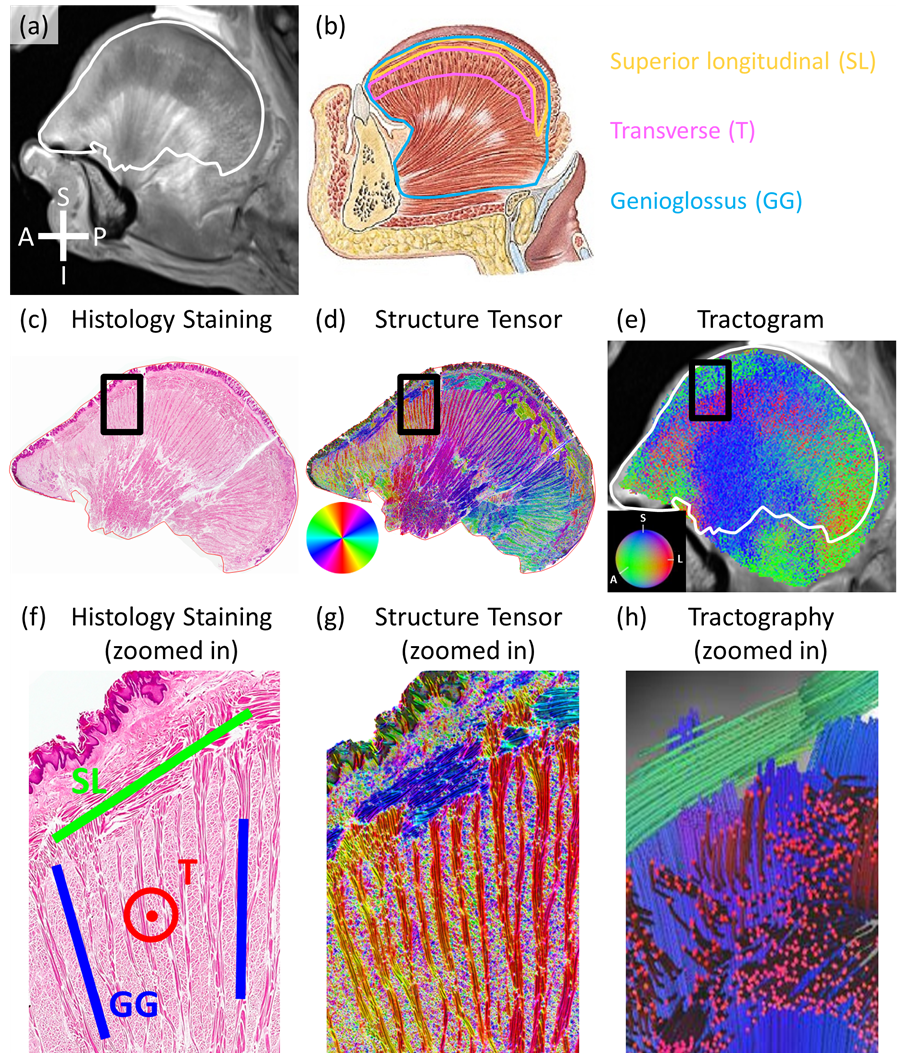
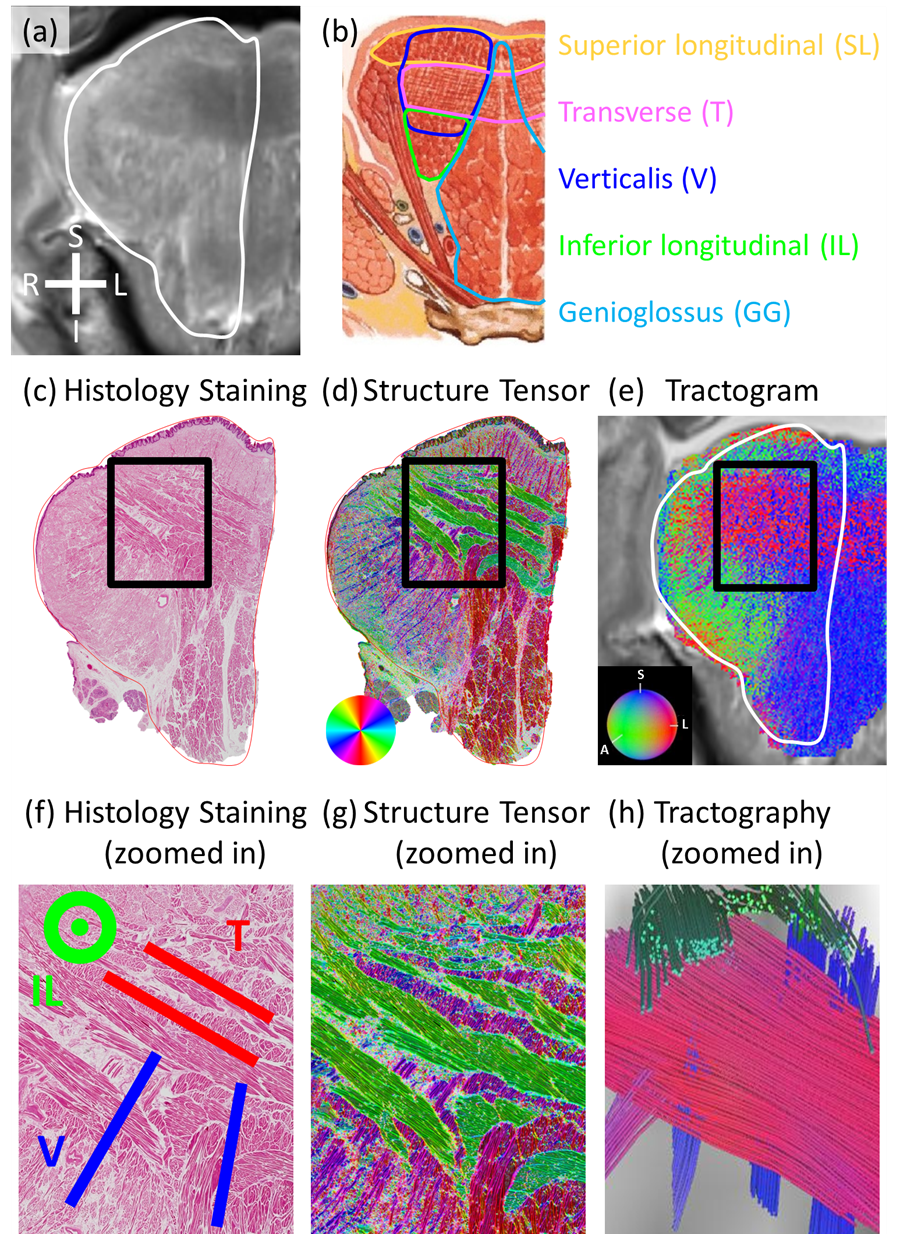
Figure 2. dMRI-derived and histology results in a radial-coronal slice. (a) T2w image. White contour: shape of the histology slice. (b) Major muscles in the coronal slice. (c) Stained histology image. (d) ST image. In-plane fiber orientations color coded as shown in the color disk. (e) Tractogram. 3D fiber orientations color coded as shown in the color sphere. (f) Zoomed-in image of (c). Labeled muscle fibers are T (red), V (blue), and IL (green). (g) Zoomed-in image of (d). (h) Zoomed-in fiber tracts in (e). Muscle fiber tracts represent T (red), V (blue), and IL (green).
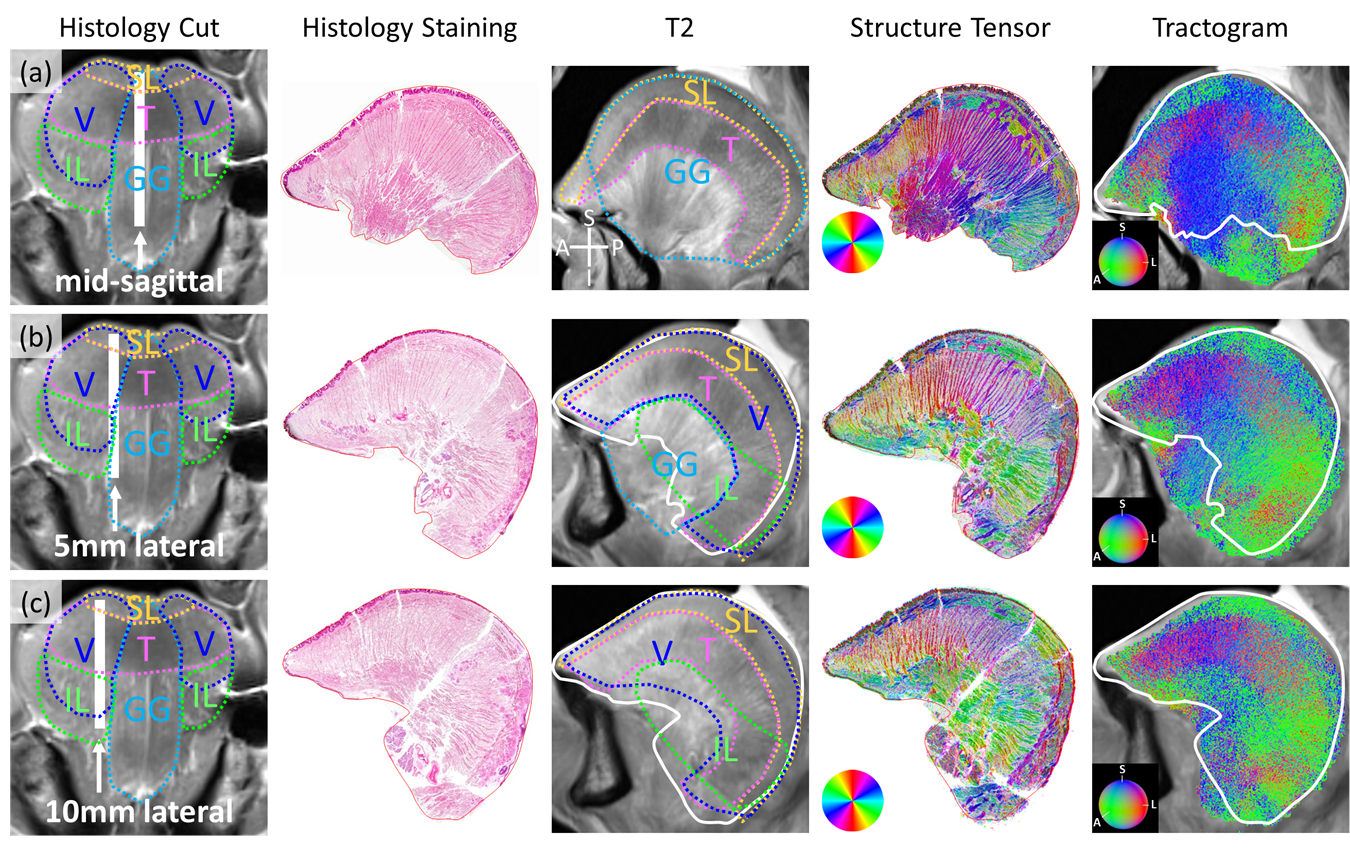
Figure 3. dMRI-derived and histology results for the mid-(a), 5mm lateral-(b) and 10mm lateral-sagittal (c) slices: from left to right, histology slice location; stained image of the histology slice; T2w images overlaid with the contours of the histology slice (white) and muscles; ST image. In-plane fiber orientations color coded as shown in the color disk; Tractogram. 3D fiber orientations color coded as shown in the color sphere.
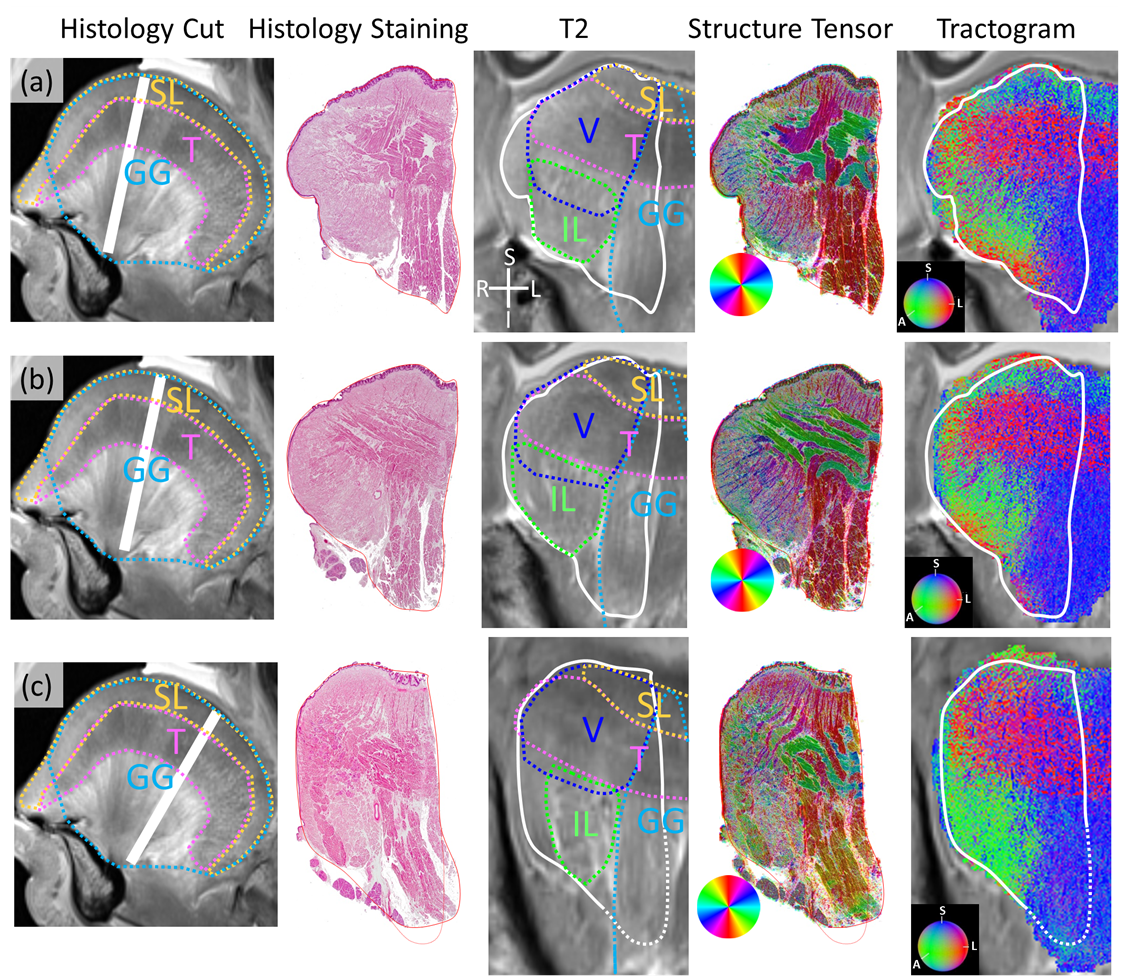
Figure 4. dMRI-derived and histology results for the anterior(a), middle (b) and posterior (c) radial-coronal slices: from left to right, histology slice location; stained image of the histology slice; T2w images overlaid with the contours of the histology slice (white) and muscles; ST image. In-plane fiber orientations color coded as shown in the color disk; Tractogram. 3D fiber orientations color coded as shown in the color sphere.
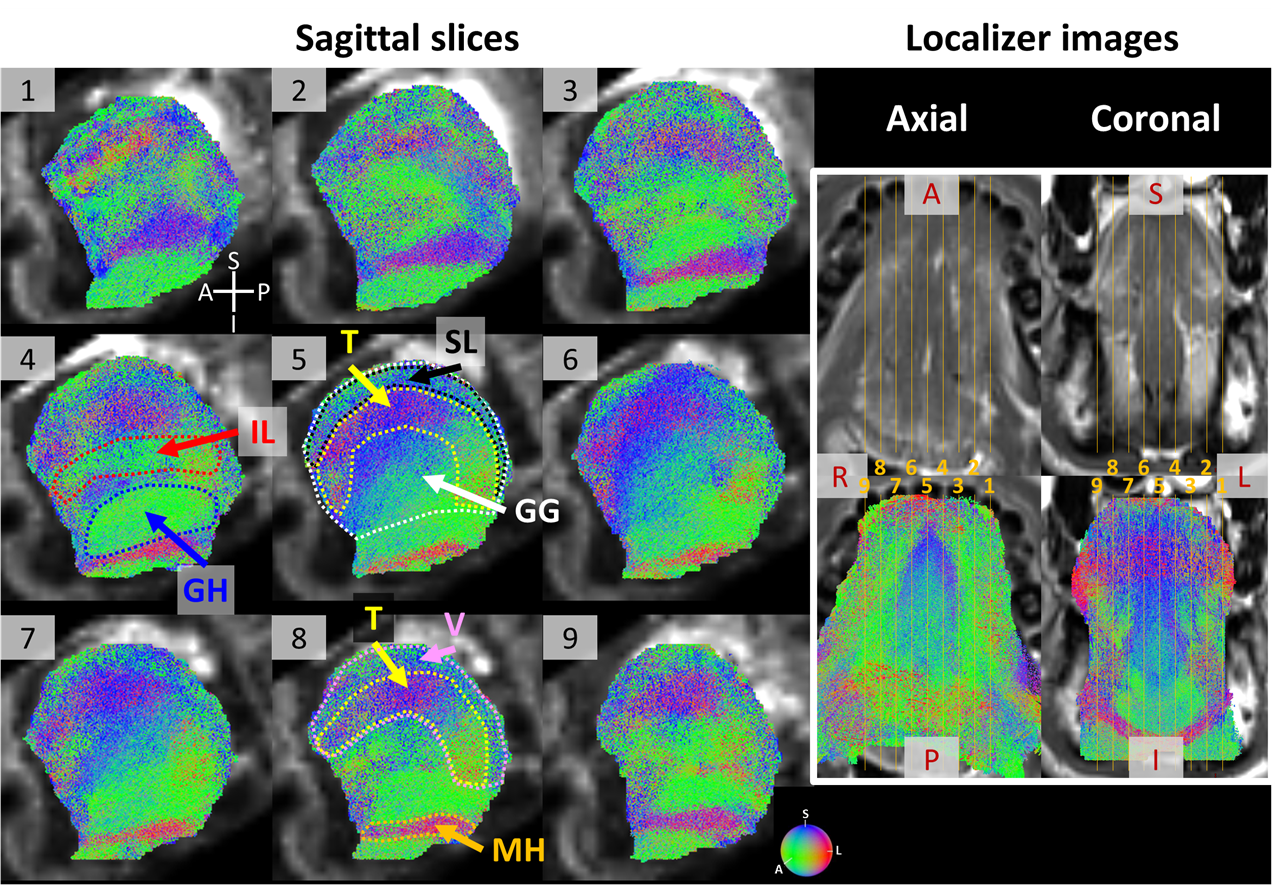
Figure 5. Tractograms in sagittal view for a healthy subject. Sub-figures 1-9 show slices from left to right of the tongue. Muscle fiber orientations are color coded as shown in the color sphere at the bottom right of sub-figure 9. An axial (left) and a coronal (right) localizer images are at the top right, in which the locations of slices 1-9 are marked by orange lines. The following muscles are marked in the figure with contours showing their locations: IL: Inferior Longitudinal, GH: Geniohyoid, SL: Superior Longitudinal, T: Transverse, GG: Genioglossus, V: Verticalis, MH: Mylohyoid.