3397
MRI quantitative assessment of muscular changes associated to a rehabilitation strategy in FSHD patients1Aix Marseille University, Center for magnetic resonance in biology and medecine, Marseille, France, Metropolitan, 2Physical and Rehabilitation Medecine Departement, APHM, Marseille, France, Metropolitan, 3Reference Centre for Neuromuscular Diseases and ALS, APHM, Marseille, France, Metropolitan, 4CNRS, INT UMR 7289, Aix Marseille University, Marseille, France, Metropolitan, 5UGECAM Institut Universitaire de Réadaptation de Valmante Sud, Marseille, France, Metropolitan
Synopsis
Facioscapulohumeral dystrophy is the third genetic myopathy. Given that no therapeutic strategy has proved to be successful, rehabilitation has been considered as an interesting alternative. The aim of this study was to quantitatively evaluate the effects of a personalized rehabilitation strategy using MRI by tracking fat fraction (FF) and contractile volume (CV) over time. The lower limb was scanned before and after a rehabilitation program. FF and CV remained stable over the training period. Clinical parameters evolved positively. FF and CV were correlated to isokinetic strength thereby indicating that both metrics could be considered as biomarkers of the pathology progression.
Abstract
Introduction: Facioscapulohumeral dystrophy (FSHD) is a myopathy characterized by a progressive, descending, asymmetric loss of muscle strength (1-2). Similarly to many other genetic muscles diseases, effective treatments are not available and alternative strategies such as rehabilitation have been tested. More sensitive quantitative biomarkers at the level of individual muscles are needed to monitor therapies (3). The aim of the present work was to quantitatively assess the effects of a personalized rehabilitation strategy on Fat fraction (FF) and Contractile volume (CV) both quantified using MRI.Methods: The rehabilitation program was performed during a 2-month period i.e. 20 rehabilitation sessions.During each session, aerobic exercise on cyclo-ergometer, strength training on isokinetic machine, balneotherapy and ergotherapy were performed. This program was personalized and associated to a dietary program and psychological care. Patients (N = 10) were scanned both before and after the rehabilitation program. MRI was performed at 1.5T (Siemens-Avanto) with the patients in the supine position. The entire lower limb (20 cm for the thigh and 20 cm for the leg) was scanned using T1W and Dixon imaging. Individual muscles were delineated in a limited amount of slices and this segmentation was automatically propagated to the remaining slices as previously reported. (4) In addition to the MRI measurements, the kinetics of oxygen consumption (VO2) and Maximal aerobic power (MAP) were measured during a standardized cyclo-ergometer stress test while knee flexors and extensors strength were assessed isokinetically. Several additional tests (6-minute walk test (6MWT), 10 meters walk test (10MWT) functional, neurological and psychological) were performed.
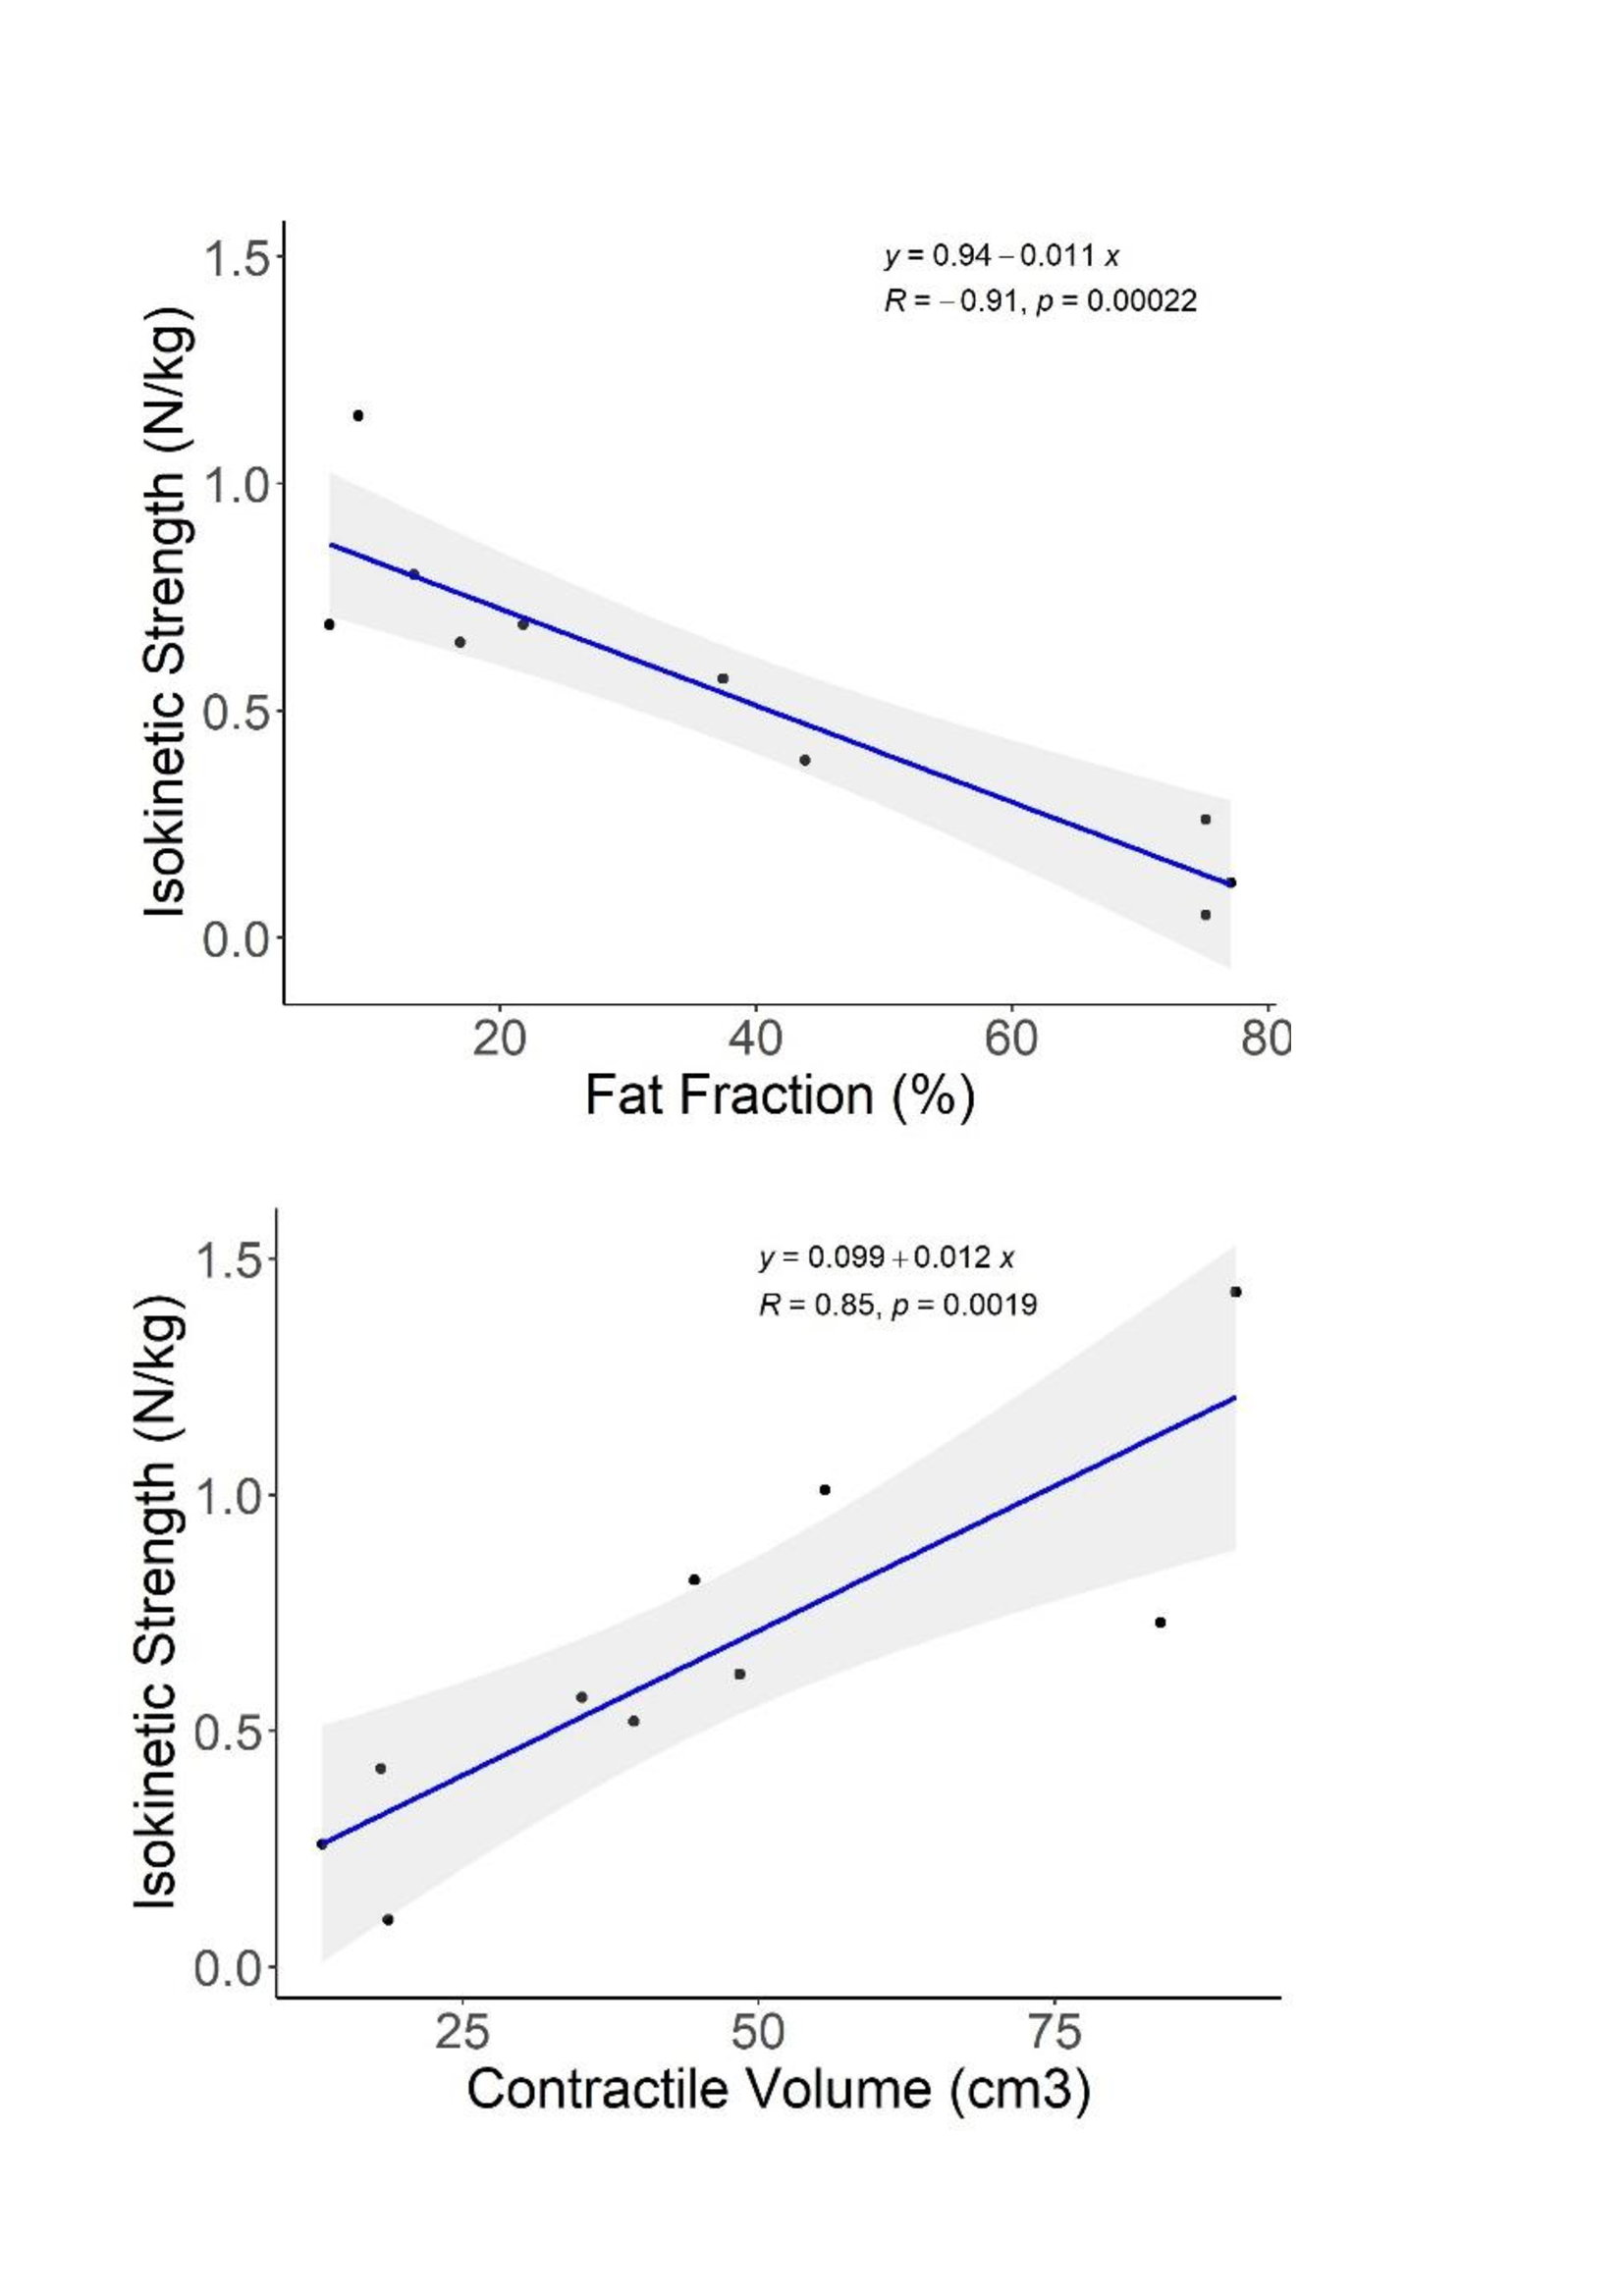
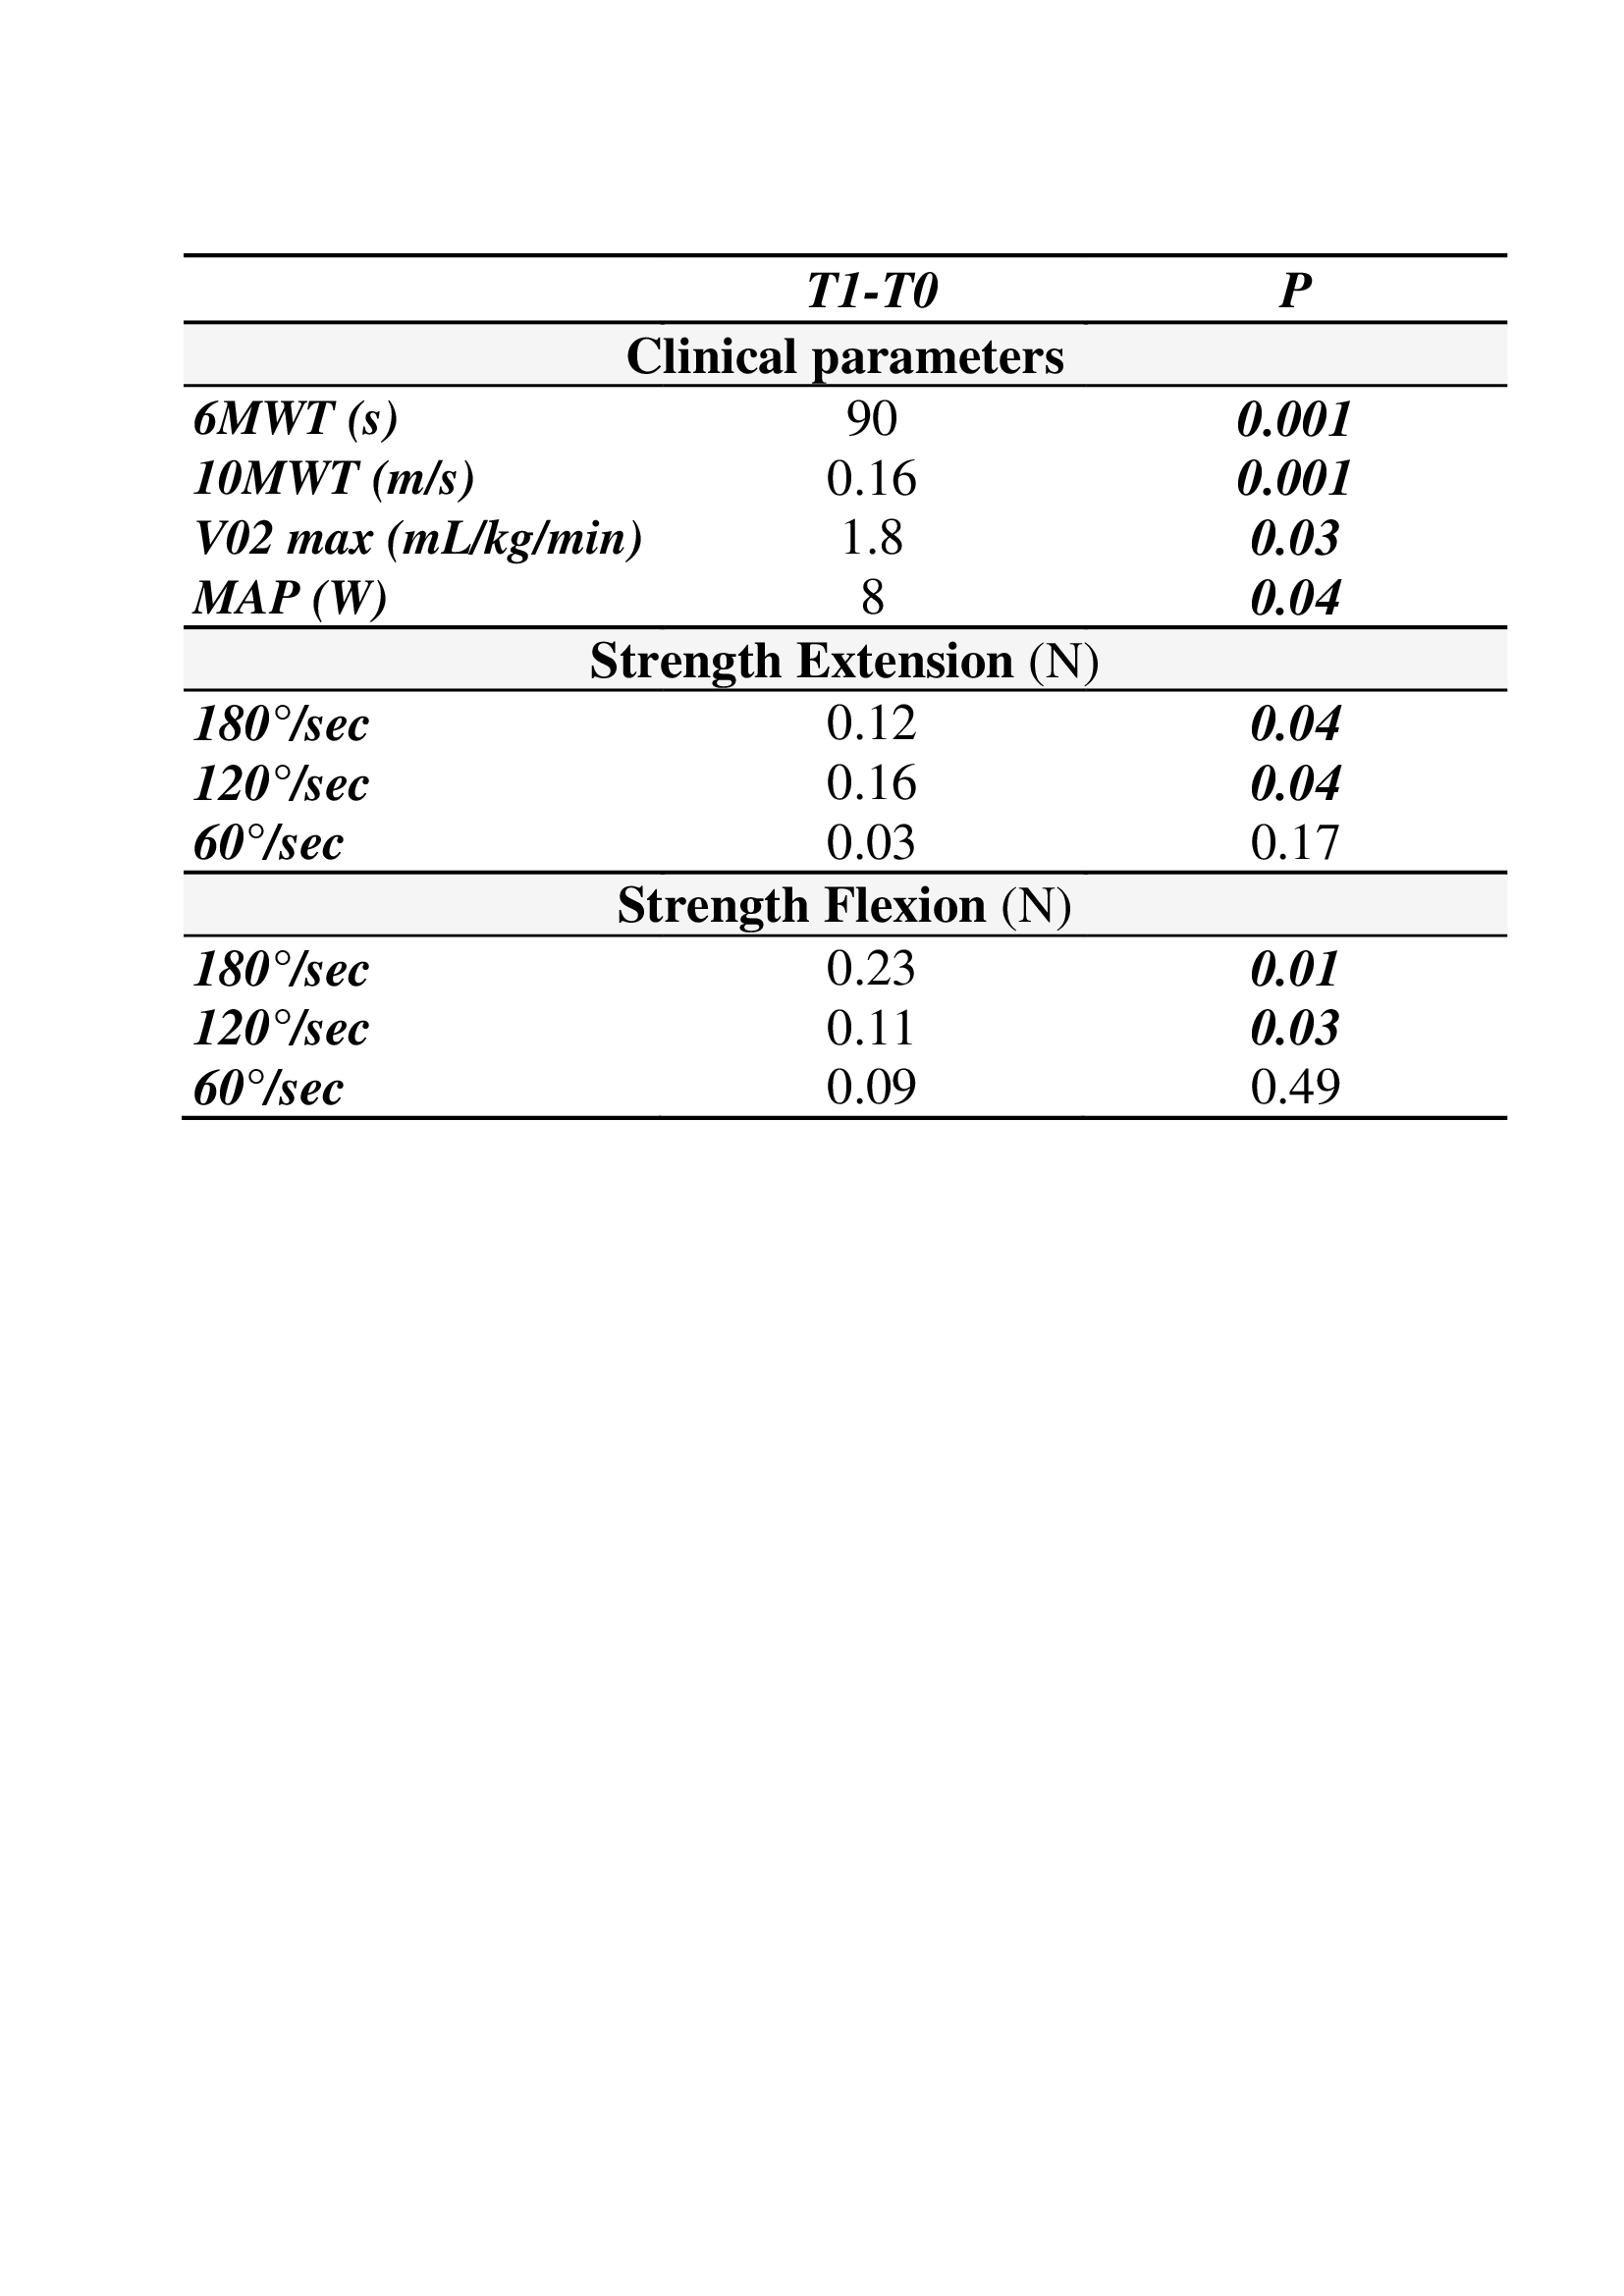
Results: As illustrated in Table1, the rehabilitation program led to a significant improvement of 6MWT and 10MWT while both V02 max and MAP increased. The isokinetic strength produced during knee flexion performed at both 180° and 120°/sec increased significantly (Table 1). Neurological and functional scores remained unchanged whereas fatigue, sleeping problems and depression were improved. Regarding MRI findings, mean FF and CV remained stable. A non significant FF increase was measured for thigh (0.67%) and leg (0.14%).CV did not significantly change over time with a decrease of 0.74cm3 in thigh and 2.59cm3 in leg muscles. As illustrated in figure 1, knee flexors and extensors strength was correlated to the corresponding CV (R2 ranging from 0.5 to 0.89) and FF (R2 ranging from 0.44 to 0.80).
Discussion: Overall, the present results demonstrated that the personalized rehabilitation program was successful for FSHD patients. Our results further support those from previous studies illustrating a significant increase in VO2max and MAP (5,6). The corresponding changes were larger than those reported in the present study likely because the rehabilitation program was longer (5) or using higher intensities (6). In agreement with others, we also reported a significant functional improvement as indicated by the increased distance covered during the 6MWT. Interestingly, our values were larger than those reported after a 24-weeks cyclo-ergometer training program (5) or after a high intensity interval training program (6).Isokinetic strength was significantly improved indicating that patients gained in muscle power and explosiveness. In agreement with Janssen et al (3), FF did not change significantly over the rehabilitation program and this stability has been considered as a positive effects of the training strategy. The correlations between strength and MRI metrics are of high interest given that MRI metrics are obtained non invasively whereas strength measurements might be biased by patients motivation. In that respect, these correlations indicate that MRI metrics might be used as biomarkers of interest for patients follow-up. In FSHD patients, similar correlations have been previously reported between FF and clinical scores such as MRC and MFM32 (2). Regarding more quantitative measurements, the anterior tibial strength measured with a dynamometer (7) has been correlated with FF. The present strength measurements were performed isokinetically and could be considered as more robust given that they are related to the activation of multiple muscles. These correlations with FF and CV strongly support the utilization of MRI metrics as sensitive biomarkers of patients follow-up.
Conclusion: Overall quantitative MRI measurements together with physiological and functional measurements clearly illustrate positive effects of a rehabilitation strategy in FSHD patients.
Acknowledgements
We would like to thank Dr Frédérique Magdinier, Institut Marseille Maladies Rares (MarMaRa) for her fundings.References
1- Janssen, B. H., Voet, N. B. M., Nabuurs, C. I., Kan, H. E., de Rooy, J. W. J., Geurts, A. C., Padberg, G. W., van Engelen, B. G. M., &Heerschap, A. (2014). Distinct disease phases in muscles of facioscapulohumeral dystrophy patients identified by MR detected fat infiltration. PloS One, 9(1), e85416. https://doi.org/10.1371/journal.pone.0085416
2- Fatehi, F., Salort-Campana, E., Le Troter, A., Lareau-Trudel, E., Bydder, M., Fouré, A., Guye, M., Bendahan, D., &Attarian, S. (2017). Long-term follow-up of MRI changes in thigh muscles of patients with Facioscapulohumeral dystrophy : A quantitative study. PloS One, 12(8), e0183825. https://doi.org/10.1371/journal.pone.0183825
3- Janssen, B., Voet, N., Geurts, A., van Engelen, B., &Heerschap, A. (2016). Quantitative MRI reveals decelerated fatty infiltration in muscles of active FSHD patients. Neurology, 86(18), 1700‑1707. https://doi.org/10.1212/WNL.0000000000002640
4- Bankolé, L.-C., Millet, G. Y., Temesi, J., Bachasson, D., Ravelojaona, M., Wuyam, B., Verges, S., Ponsot, E., Antoine, J.-C., Kadi, F., &Féasson, L. (2016). Safety and efficacy of a 6-month home-based exercise program in patients with facioscapulohumeral muscular dystrophy : A randomized controlled trial. Medicine, 95(31), e4497. https://doi.org/10.1097/MD.0000000000004497
5- Ogier, A. C., Heskamp, L., Michel, C. P., Fouré, A., Bellemare, M.-E., Le Troter, A., Heerschap, A., &Bendahan, D. (2020). A novel segmentation framework dedicated to the follow-up of fat infiltration in individual muscles of patients with neuromuscular disorders. Magnetic Resonance in Medicine, 83(5), 1825‑1836. https://doi.org/10.1002/mrm.28030
6- Andersen, G., Heje, K., Buch, A. E., &Vissing, J. (2017). High-intensity interval training in facioscapulohumeral muscular dystrophy type 1 : A randomized clinical trial. Journal of Neurology, 264(6), 1099‑1106. https://doi.org/10.1007/s00415-017-8497-9
7- Wang, L. H., Shaw, D. W. W., Faino, A., Budech, C. B., Lewis, L. M., Statland, J., Eichinger, K., Tapscott, S. J., Tawil, R. N., & Friedman, S. D. (2021). Longitudinal study of MRI and functional outcome measures in facioscapulohumeral muscular dystrophy. BMC Musculoskeletal Disorders, 22(1), 262. https://doi.org/10.1186/s12891-021-04134-7
Figures