3396
Evaluation of Meniscus Degeneration in Patients with Posterior Root Tear of Medial Meniscus Using T2* Mapping at 7T – Comparison with Arthroscopy1Center for Magnetic Resonance Research, University of Minnesota, Minneapolis, MN, United States, 2Department of Radiology, University of Minnesota, Minneapolis, MN, United States, 3Edina-Crosstown Surgery Center, Twin Cities Orthopedics, Minneapolis, MN, United States
Synopsis
Although T2 mapping allows noninvasive evaluation of meniscus degeneration, its application at 7T requires spin echo sequences with relatively long repetition times to meet the specific absorption rate (SAR) limits which can restrict the resolution of maps. This 7T study evaluates the potential of T2* mapping for the assessment of meniscal degeneration in six patients with arthroscopically verified posterior root tears of the medial meniscus and in healthy volunteers. Increased T2* in degenerated meniscus regions suggest T2* mapping is sensitive to meniscus degeneration. T2* mapping is a promising biomarker of early meniscal degeneration which is less SAR-demanding than T2 mapping.
Purpose
Meniscal root tears are one of the highest risk factors for the development and progression of knee osteoarthritis (1). The ability to detect and quantify early changes in meniscal composition, prior to the appearance of morphological changes, will improve the ability to monitor development and progression of meniscus degeneration and study its relationship to knee osteoarthritis. Recent studies have demonstrated a relationship between T2 relaxation times and meniscus degeneration (2, 3). Increased meniscal T2 values were related to collagen network disorganization and decreased collagen content (4). T2 mapping of the meniscus at 7T requires spin echo sequences with relatively long repetition times to meet specific absorption rate (SAR) limits which can limit the spatial resolution.The goal of this 7T study was to evaluate the potential of T2* mapping for the evaluation of meniscal degeneration using multi-echo gradient echo acquisition which is much less SAR demanding. Therefore, we evaluated patients with arthroscopically verified posterior root tears of the medial meniscus and compared T2* between: (i) different meniscus regions, (ii) and between patients and healthy volunteers.
Methods
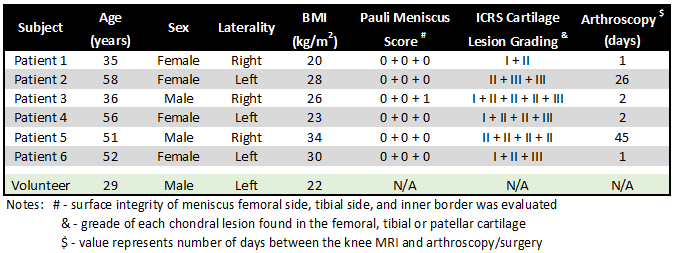
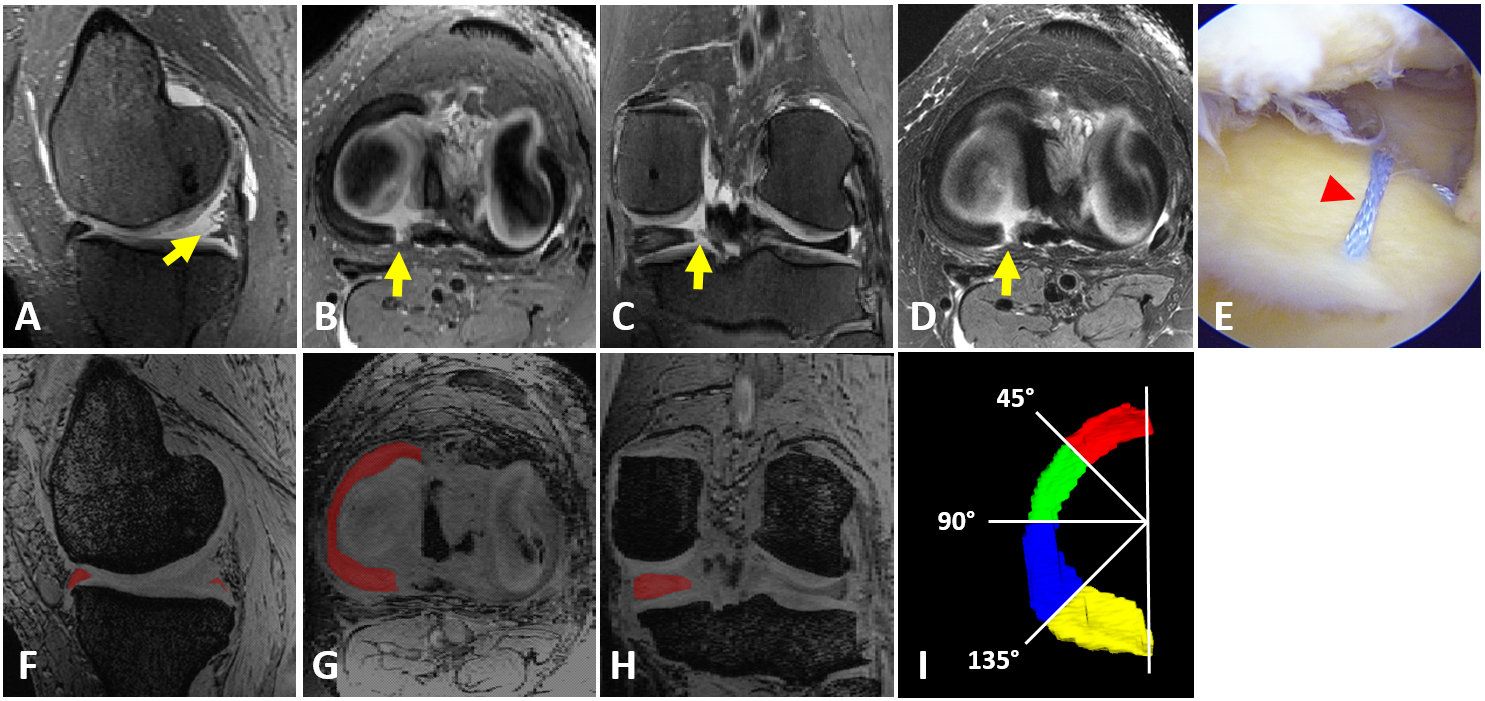
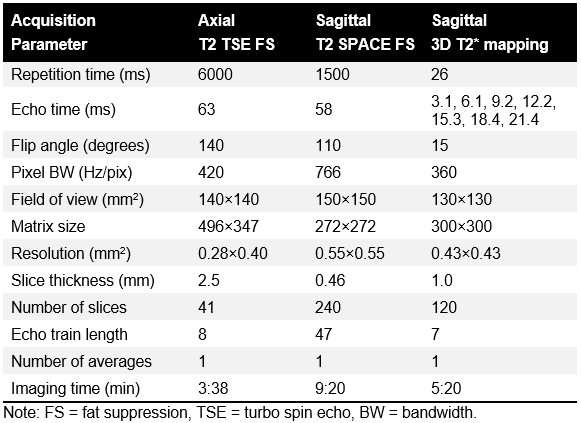
This prospective, ongoing, IRB-approved study compares T2* and arthroscopic results in medial meniscus. Six patients with a Type II posterior root tear of the medial meniscus (mean age, 47 years; 4 women) received 7T MRI and subsequently underwent arthroscopic repair of the root attachment. Additionally, one volunteer with no knee symptoms and no suspicious MRI findings was imaged with an identical protocol. Demographic details are listed in Figure 1.All images were acquired on a 7T MRI (Siemens, Erlangen, Germany) using a birdcage transmit / 28-channel receive phased-array knee coil (Quality Electrodynamics, Mayfield Village, OH). The protocol included T1- and T2-weighted turbo-spin echo sequences and a T2-weighted 3D SPACE acquisition with fat suppression for the morphological evaluation of the knee joint (Figure 2A-D). Additionally, a 3D multi-echo gradient recalled echo (GRE) sequence with seven TEs (3.1 - 21.4 ms) was acquired to calculate T2* relaxation times in the menisci. MRI acquisition parameters are listed in Figure 3.
Arthroscopic evaluation of cartilage and meniscus integrity was performed during the repair of the posterior root attachment of medial meniscus (Figure 2E). All chondral lesions were classified according to the ICRS grading system (5, 6). Meniscus degeneration was assessed by evaluating the surface integrity of i) femoral surface, ii) tibial surface, and iii) inner rim as described in the Pauli grading system (7).
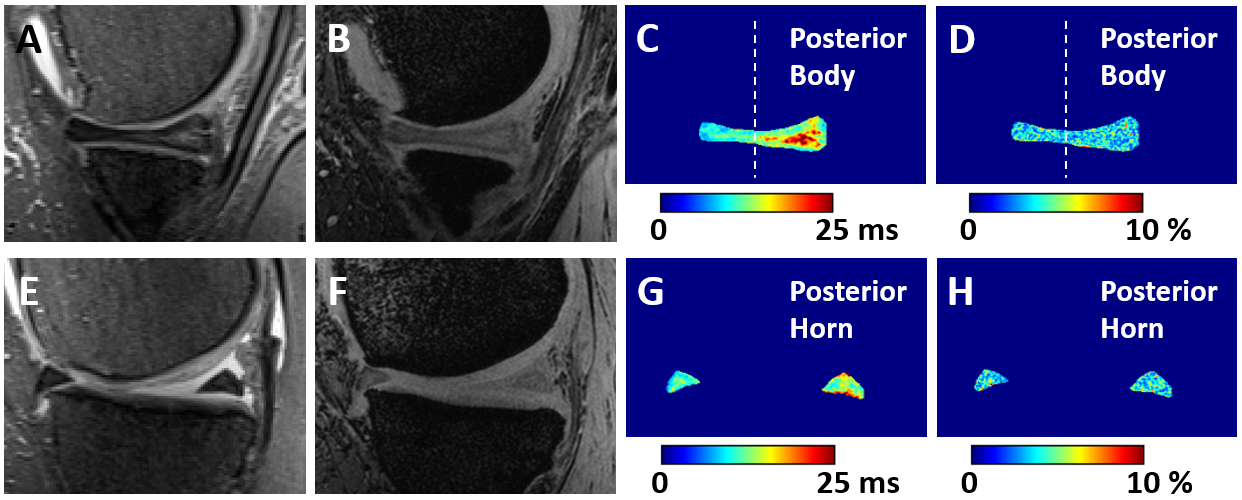
T2* maps were calculated by fitting a mono-exponential decay to the multi-echo data using a two-parametric least-square fitting routine in Matlab (MathWorks) (Figure 4C). For the evaluation of the goodness of fit, the root means square error (RMSE) was normalized to an estimated signal at a TE of 0 ms. Mean T2* was calculated in four 3D-regions segmented on T2*-weighted images (TE= 6.1 ms) using ITK-SNAP (Figure 2F-H). Each medial meniscus, between the anterior attachment and tear, was segmented into four regions: (i) anterior horn, (ii) anterior body, (iii) posterior body, and posterior horn (Figure 2I). For statistical analyses, linear mixed models, with age and body mass index as covariates, followed by Tukey’s post-hoc tests were used to evaluate T2* differences between meniscal regions. All p-values were adjusted for multiple pair-wise comparisons using Bonferroni correction.
Results
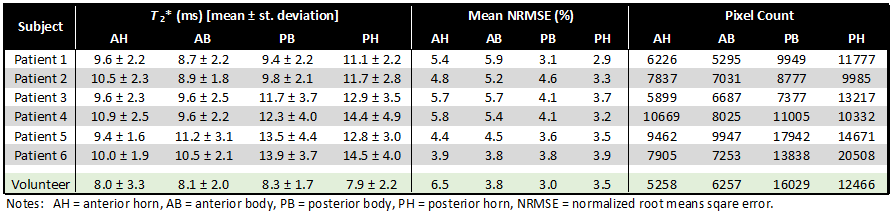
T2* mapping. More than 5000 pixels per meniscal region were evaluated in each subject (Figure 5). We found significantly higher T2* in the posterior horn of medial meniscus, in the region adjacent to the root tear, when compared to the anterior horn (p<0.001) and anterior body (p<0.001) regions. Additionally, T2* in the posterior body was also significantly higher than T2* in the anterior horn (p=0.028) and anterior body (p=0.011) of the medial meniscus. Furthermore, all mean T2* values were higher in patients than in a healthy volunteer (Figure 5). All mean normalized RMSEs were lower than 7% showing reasonable reliability of the fitted results.Arthroscopy. All evaluated medial menisci had complete posterior root tears. Only one meniscus showed slight fibrillation at the inner surface. The rest of meniscal surfaces were smooth. Two to five cartilage lesions per patient were found, and each knee showed a lesion on the medial femoral condyle and patella.
Discussion
We found higher T2* in the posterior compared to the anterior portion of the meniscus in patients with a posterior root tear of the medial meniscus. Assuming that the posterior portion of the meniscus in these patients is more degenerated than the anterior portion of meniscus, our results suggest that T2* mapping is sensitive to meniscal degeneration. This conclusion also agrees with the observation of lower T2* in all meniscal regions of a healthy volunteer when compared to patients with meniscal root tears. Finally, our observation is in line with previous studies reporting increased T2 in degenerated menisci albeit with a higher spatial resolution and less SAR intensive acquisition (2-4).In conclusion, in vivo T2* mapping at 7T seems to be sensitive to changes in meniscal composition and thus may provide a less SAR-demanding biomarker of early meniscal degeneration when compared T2 mapping. Future studies with healthy volunteers and with follow-up of patients after meniscal repair are needed to verify this promising preliminary results.
Acknowledgements
This study was supported by the NIH NIBIB grant (P41 EB027061).References
1.) Floyd ER, et al. The Natural History of Medial Meniscal Root Tears: A Biomechanical and Clinical Case Perspective. Front Bioeng Biotechnol. 2021; 9: 744065.
2.) Son M, et al. Regional variation in T1rho and T2 times in osteoarthritic human menisci: correlation with mechanical properties and matrix composition. Osteoarthritis Cartilage. 2013; 21(6): 796-805.
3.) Wang A, et al. MR T1rho and T2 of meniscus after acute anterior cruciate ligament injuries. Osteoarthritis Cartilage. 2016; 24(4): 631-9.
4.) Eijgenraam SM, et al. T2 mapping of the meniscus is a biomarker for early osteoarthritis. Eur Radiol. 2019; 29(10): 5664-72.
5.) Brittberg M, Peterson L. Introduction of an articular cartilage classification. ICRS Newsletter. 1998; 1(1): 5-8.
6.) Hjelle K, et al. Articular cartilage defects in 1,000 knee arthroscopies. Arthroscopy. 2002; 18(7): 730-4.
7.) Pauli C, et al. Macroscopic and histopathologic analysis of human knee menisci in aging and osteoarthritis. Osteoarthritis Cartilage. 2011; 19(9): 1132-41.
Figures