3394
Quantitative assessment of peripheral metabolism and perfusion with dynamic 1H MRI in healthy and diabetic individuals1Radiology, Washington University School of Medicine, St. Louis, MO, United States, 2Zhejiang University, Hangzhou, China, 3Department of Surgery, Section of Vascular Surgery, Washington University School of Medicine, St. Louis, MO, United States, 4The Program in Physical Therapy, Washington University School of Medicine, St. Louis, MO, United States
Synopsis
The objective of this study is to analyze the efficacy of quantitative PCr MRI in quantifying differing muscle tissue PCr kinetics in healthy individuals and diabetic patients. Healthy subjects and diabetic patients underwent PCr and perfusion imaging in calf muscle at rest, during isometric plantarflexion, and for a recovery period. Only the healthy group displayed moderate correlation between PCr and perfusion. The diabetic patient group displayed attenuated recovery speed of PCr after exercise and no correlation between PCr and perfusion.
Purpose
Type II Diabetes Mellitus (T2D) is a progressive metabolic disorder characterized by resistance to insulin leading to hyperglycemia. Progression of T2D may cause neuropathy, peripheral artery disease (PAD), tissue ischemia/loss, etc.1 In severe cases, PAD may lead to critical limb ischemia, often requiring surgery or endovascular intervention. T2DM is linked to impaired mitochondrial function in muscle tissue that may precede micro-vascular disorders.2 Non-invasive diagnostic methods to characterize the progression of T2D’s effect on mitochondria are desirable to inform long-term care. We recently developed a quantitative phosphocreatine imaging approach with spatial and temporal resolved resolutions (submitted as another abstract to this conference), based on Bloch-McConnell equation curve fitting. The objective of this pilot study is to evaluate this approach in both healthy individuals and T2D patients to develop a non-invasive proxy for the analysis of mitochondrial health.PCr CEST
While ATP is the energy currency of cells, creatine (Cr) is crucial to accommodating muscle contraction. Cr accepts inorganic phosphate (Pi) from surplus ATP, producing phosphocreatine (PCr). PCr then donates Pi to ADP under conditions of ATP depletion: $$ Cr + ATP \leftrightarrow PCr + ADP + H+$$ (1)The kinetics of this reaction are modelled as first-order: $$[PCr](t)=[PCr]_{min}+([PCr]_{max}-[PCr]_{min})(1-e^{(-t/τ)})$$(2)
Healthy and diabetic subjects underwent PCr CEST imaging throughout an exercise-recovery protocol to examine if the differing kinetics of this reaction between healthy and diabetic subjects could be visualized by CEST imaging.
Methods
CEST imaging was conducted on 6 young healthy volunteers (25 – 27 Y), 4 older healthy (54-60Y), and 6 older individuals with T2D and without history of PAD (50-79 Y). Subjects underwent scans at a clinical 3T Prisma MRI system (Siemens Healthineers, Erlangen, Germany). The MRI sequence for PCr measurement was a 2D CEST prepared single-shot turbo-spin-echo (CESTprep-TSE) sequence with a continuous wave saturation module. Saturation power was 0.6 µT and saturation time was 800 ms (ten 80 ms Gaussian shaped pulses). 31 frequency offsets were acquired to generate a Z-spectrum from 1.3 to 3.5 ppm; smaller frequency increments were used near the PCr peak at 2.5ppm. Other imaging parameters for the CEST PCr scan were: TR/TE = 1860 ms/7.5 ms, field-of-view = 220 x 220 mm2, matrix = 76 x 76, slice thickness = 8 mm, single slice, and data acquisition time of 60s for one PCr map. After baseline scans for 3 min, subjects underwent isometric plantarflexion for 4 minutes. Exercise strength was set to 40% of maximal voluntary contraction. PCr CEST scans were performed every 1 min following the start of exercise and continuing throughout the 6 min recovery period.Additionally, subjects underwent a second exercise protocol for imaging of skeletal muscle perfusion by utilizing an established contrast free arterial spin labeling (ASL) method.3 The ASL sequence parameters for calf imaging are: single-shot gradient-echo acquisition, TR/TE = 4.0 msec/1.3 msec; fat saturation; flip angle = 5o; image resolution = 1.7 x 1.7 x 8 mm3; temporal resolution = 1.1 min.Both PCr and perfusion maps were processed offline using custom-made software. For PCr, a Bloch-fitting approach was employed, where raw data was converted to Z-spectra and reverse-fitted to the Bloch-McConnell equations for a 3-pool system (water, PCr, magnetic transfer contrast). Water saturation shift referencing (WASSR) images were collected to correct for underlying Bo inhomogeneity.4 The dynamic PCr concentrations were then fitted to first-order kinetics (Eq. 2) to obtain a time-constant t. One-way analysis of variance method was used to compare differences among three groups with a Tukey-Kramer post-hoc test.
Results
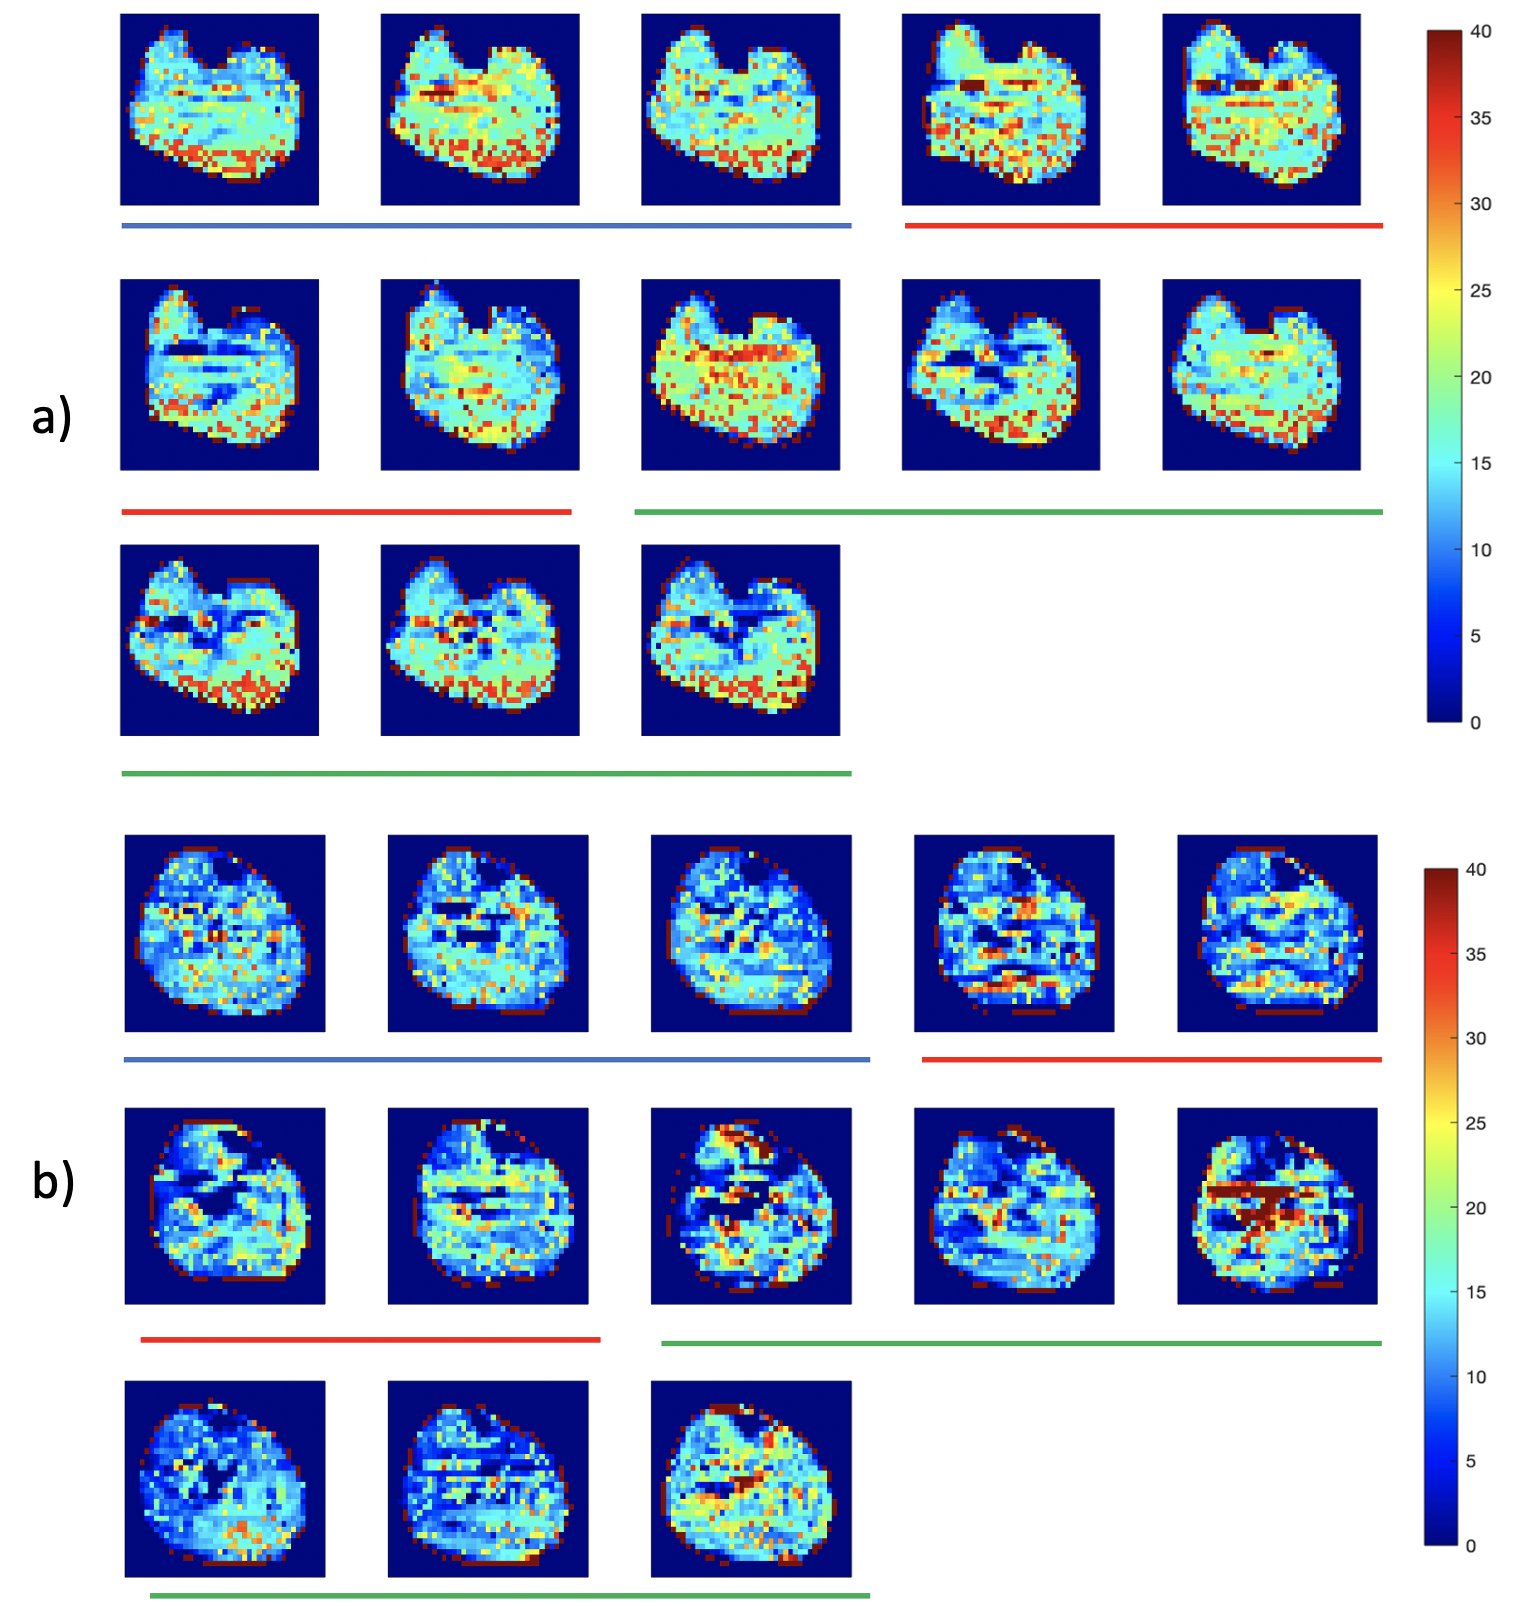
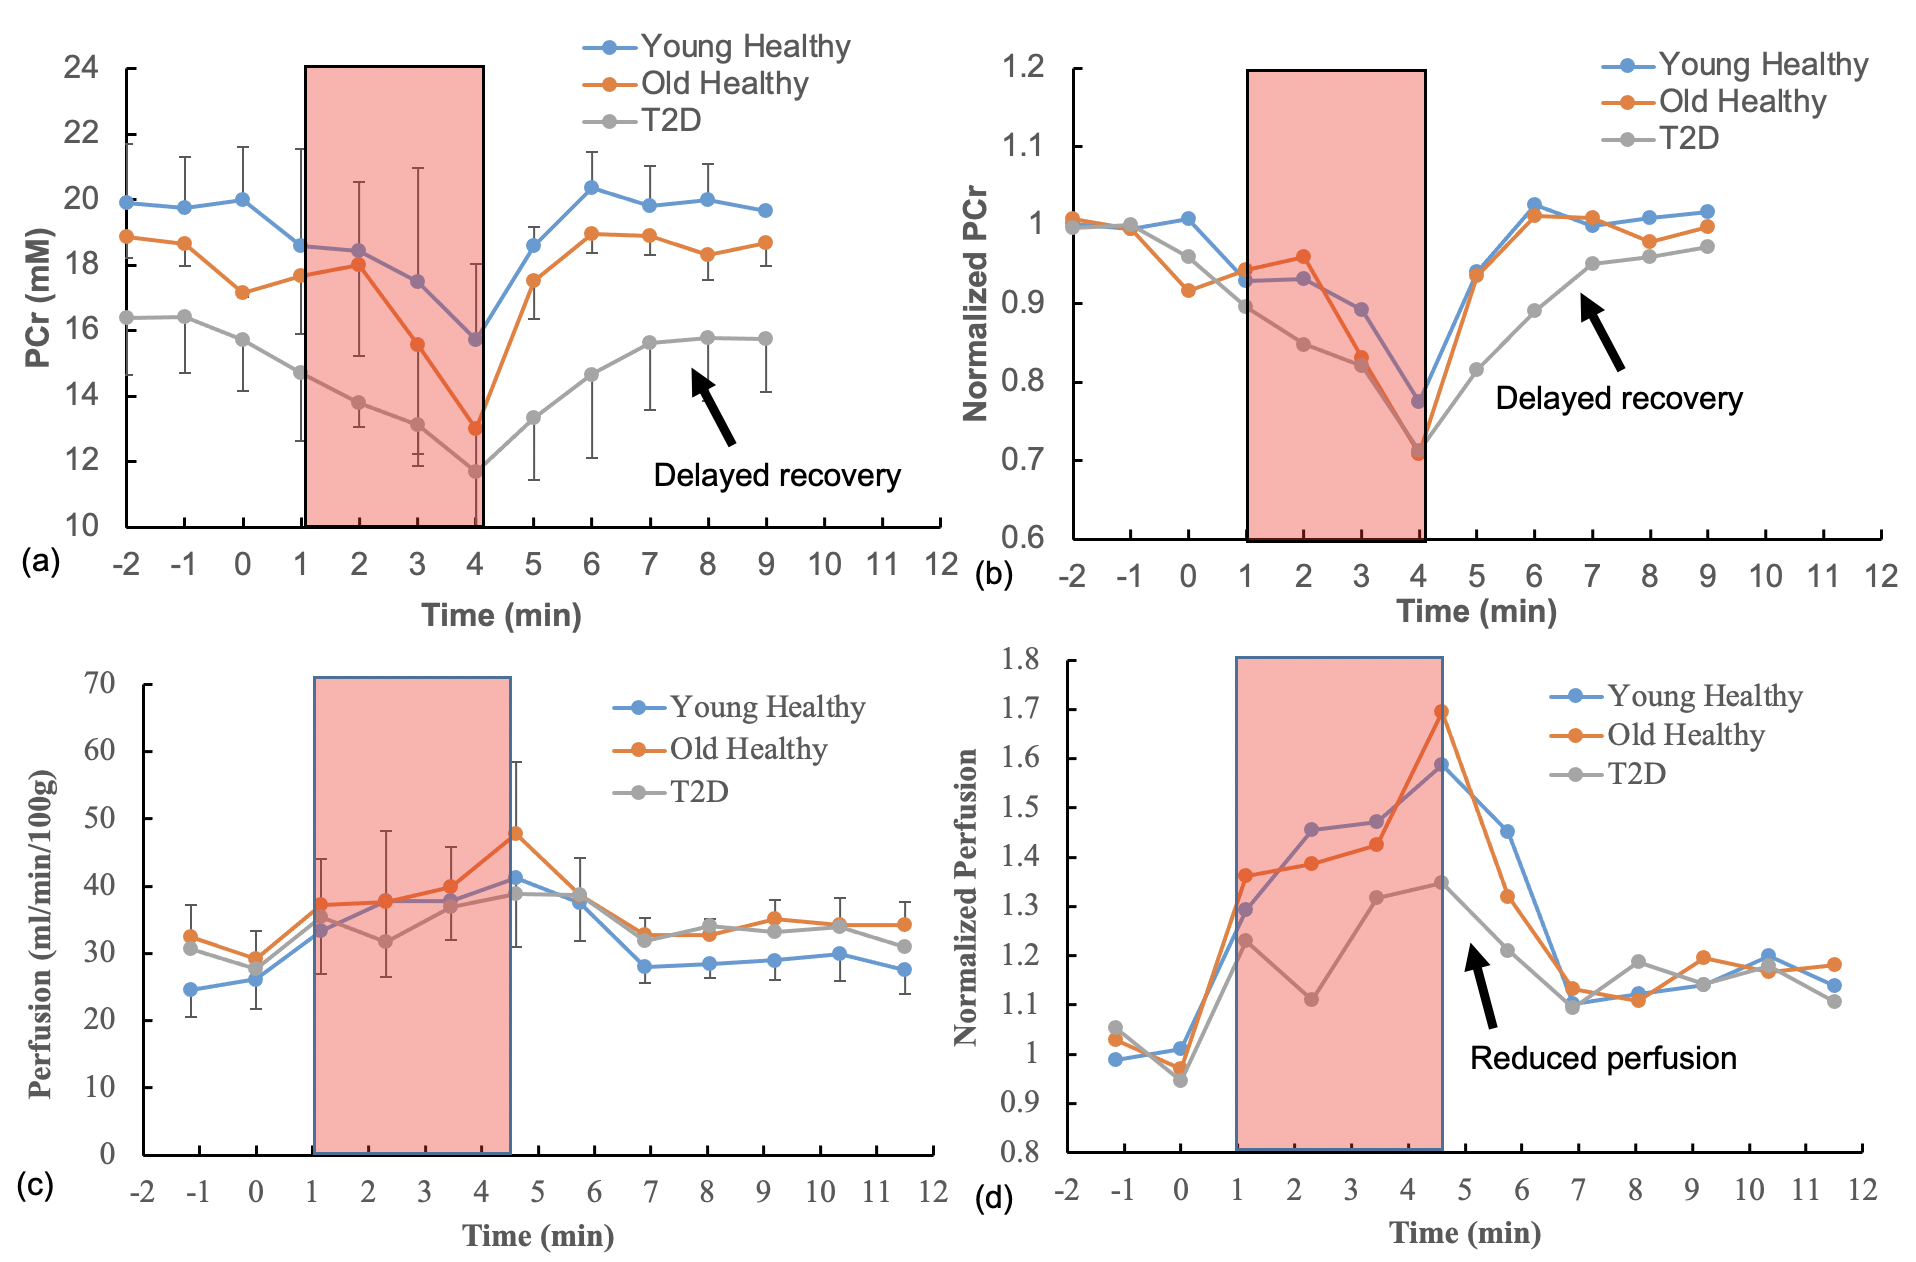
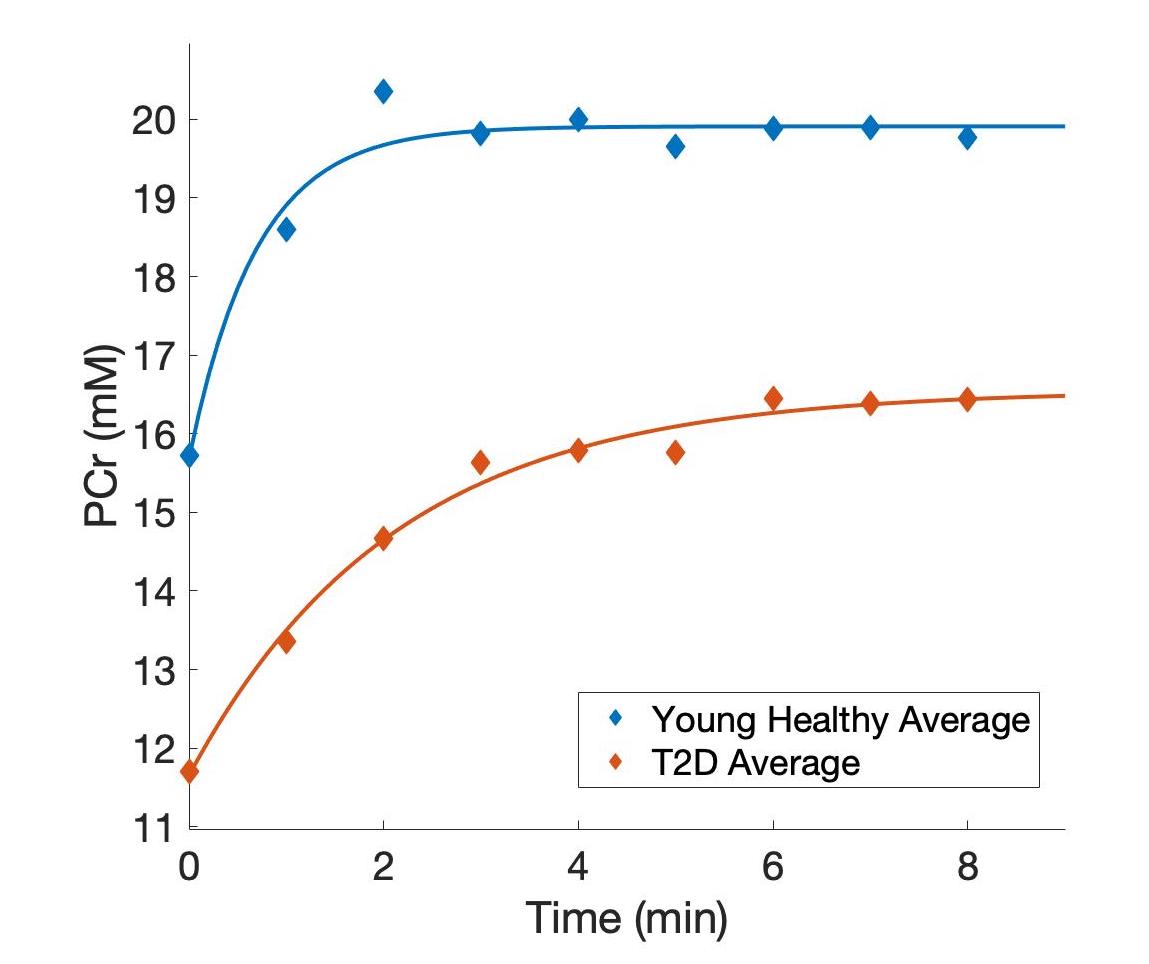
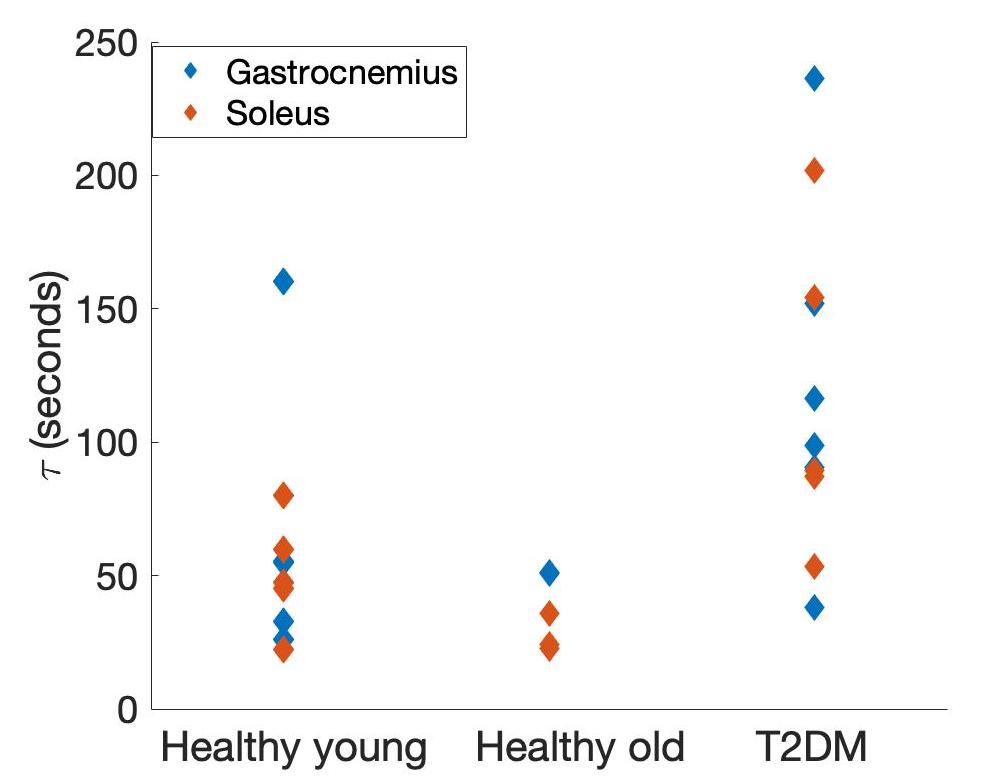
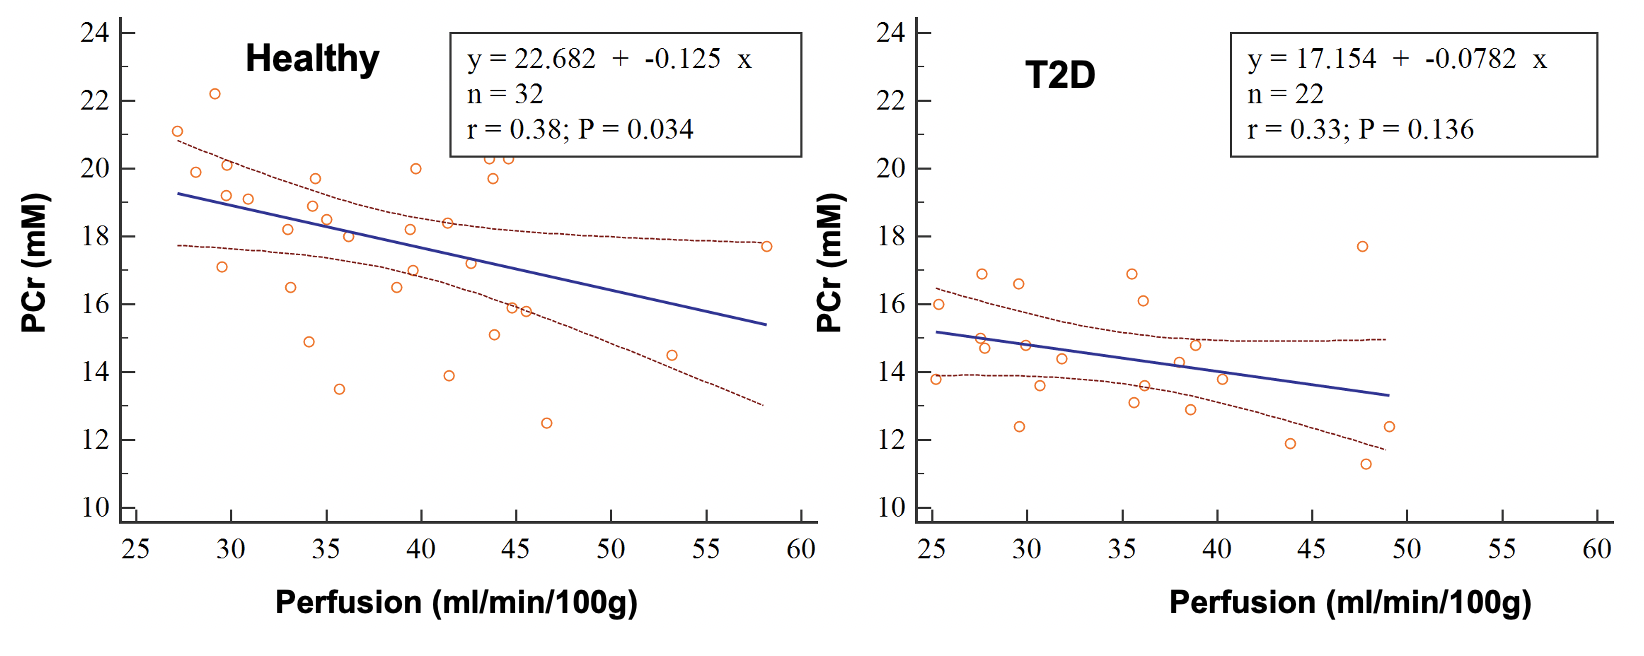
Figure 1 shows examples of PCr maps from two subjects (young healthy and T2D). Figure 2 shows PCr and perfusion values in the medial gastrocnemius muscle of all subjects in three groups. Average PCr levels in young heathy subjects are significantly higher than those in T2D (Table 1). In normalized PCr-time curves, differences in PCr levels between young healthy and T2D become smaller (non-significant) during the exercise, but PCr remains significantly higher in the young healthy group. Figure 3 demonstrates the curve fitting used to evaluate the time-constant of PCr recovery, and Figure 4 shows that the t value for T2D patients was significantly longer (mean young healthy t = 47.1 ± 18.2s, old healthy t = 36.9 ± 13.8s, and mean T2D t =119.9 ± 60.8s, p = 0.02). These results are in line with prior 31P studies5. Although there is no apparent difference in absolute perfusion of medial gastrocnemius muscle among three groups of subjects, normalized perfusion-time curves reveal significantly lower exercise perfusion in T2D (p < 0.05), compared to perfusion in two healthy groups. The recovery time of perfusion after the exercise are similar among three groups. There is a moderate negative correlation between PCr and perfusion during the exercise in healthy groups (r = 0.38, p = 0.034, Figure 5). This correlation becomes mild and non-significant in the T2D group.Discussion & Conclusion
The quantitative and dynamic PCr mapping in calf muscle reveals significantly different energetics between healthy and T2D, in addition reduced muscle perfusion in T2D. Mismatched perfusion and PCr in T2D patients indicate alternative novel therapy may be needed to treat metabolism dysfunction in T2D before further disease progression.Acknowledgements
Special thanks to Dr. Zheng for his guidance, patience, and dedication.References
1. Sivitz, William I, and Mark A Yorek. “Mitochondrial dysfunction in diabetes: from molecular mechanisms to functional significance and therapeutic opportunities.” Antioxidants & redox signaling vol. 12,4 (2010): 537-77. doi:10.1089/ars.2009.2531
2. Thiruvoipati, Thejasvi et al. “Peripheral artery disease in patients with diabetes: Epidemiology, mechanisms, and outcomes.” World journal of diabetes vol. 6,7 (2015): 961-9. doi:10.4239/wjd.v6.i7.961
3. Zheng J, An H, Coggan AR, Zhang X, Bashir A, Muccigrosso, D, Peterson LR, Gropler RJ. Noncontrast skeletal muscle oximetry. Magn Reson Med, 2014; 71: 318-325.
4. Kim, Mina et al. “Water saturation shift referencing (WASSR) for chemical exchange saturation transfer (CEST) experiments.” Magnetic resonance in medicine vol. 61,6 (2009): 1441-50. doi:10.1002/mrm.21873
5. Scheuermann-Freestone, M., Madsen, P. L., Manners, D., Blamire, A. M., Buckingham, R. E., Styles, P., Radda, G. K., Neubauer, S., & Clarke, K. (2003). Abnormal cardiac and skeletal muscle energy metabolism in patients with type 2 diabetes. Circulation, 107(24), 3040–3046. https://doi.org/10.1161/01.cir.0000072789.89096.10
Figures