3393
R1rho Dispersion in Lumbar Muscles1Translational Neuroscience, Barrow Neurological Institute, Phoenix, AZ, United States, 2Barrow Neurological Institute, Phoenix, AZ, United States, 3Radiology and Radiological Sciences, Vanderbilt University Medical Center, Nashville, TN, United States
Synopsis
R1rho imaging can provide novel information on dynamic processes within tissues, allowing for a more comprehensive analysis of the parameters of chemical exchange and/or intrinsic microstructure. We measured the dispersion of R1rho with different locking fields in the major lumbar muscles of psoas, paraspinal muscles (multifidus and erector spinae), and quadratus lumborum. The results showed that R1rho dispersion is significant and measurable at 3T which may provide a new way to characterize muscles involved in low back pain.
INTRODUCTION
The major lumbar muscles, including the psoas, paraspinal muscles (multifidus and erector spinae), and quadratus lumborum, contribute to core stability and overall strength of the lumbar spine1. Impairment of lumbar muscles is one of the major causes of lower back pain and a leading cause of disability worldwide2. Magnetic resonance imaging (MRI) is the preferred image modality for its accurate detection of structural abnormalities of the surrounding muscles of the vertebrae3. R1rho imaging is sensitive to slow macromolecular interactions typically within the range of 0 - few KHz, but varies with the strength of the spin-lock field used. At higher fields (3T and beyond) R1rho is also strongly influenced by chemical exchange processes4,5 and diffusion within field inhomogeneities, and the dispersion of the relaxation rate R1rho with locking field may be used to quantify exchange processes6. R1rho is sensitive to tissue composition and has been widely used to evaluate the status of brain, liver, and cartilage7-9, though usually only single locking fields have been employed. However, R1rho imaging, and the variation of R1rho with locking field, in lumbar muscles have not been reported previously. In this study, we perform R1rho dispersion in human lumbar muscles to explore its feasibility for the potential characterization of lumbar muscles.METHODS
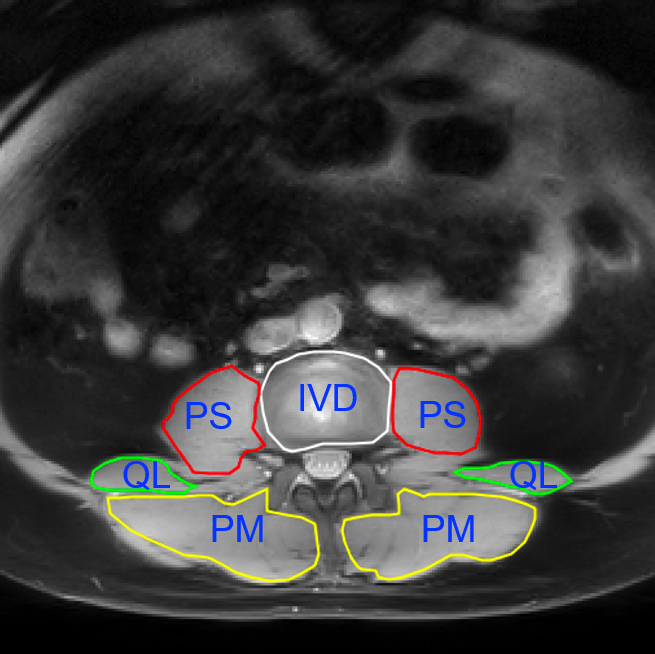
The study was approved by the local IRB. Two healthy volunteers participated in this study with written informed consent obtained prior to MR imaging. Experiments were performed on a Philips 3T Ingenia scanner (Philips Healthcare, Best, The Netherlands). Each subject was scanned in a supine position with a ds-posterior spine coil. A B0/B1 inhomogeneity self-compensated R1rho pre-pulse sequence10 was implemented to create R1rho contrast followed by a Turbo Spin Echo (TSE) data acquisition. A single axial slice covering the lumbar spine was chosen for imaging, with FOV: 192×192mm2, pixel size: 1×1mm2, slice thickness: 5mm, TR/TE=3000ms/10ms, TSE factor=15, NEX: 1. Five spin-lock times (TSLs) [1ms, 11ms, 21ms, 31ms, 41ms] were combined into a single scan for R1rho calculations, resulting in a scan time of 4min32sec. The R1rho experiment was repeated at different spin-lock frequencies (FSLs) [0Hz, 100Hz, 300Hz, 400Hz] to evaluate the R1rho dispersion in lumbar muscle. After acquisition, an R1rho map at each spin-lock frequency was calculated by fitting the signal intensity vs TSL to a three-parameter mono-exponential model on a pixel-wise basis at the muscle ROI (see Fig. 1). Finally, mean values of the R1rho in muscle ROIs were used for comparisons.RESULTS
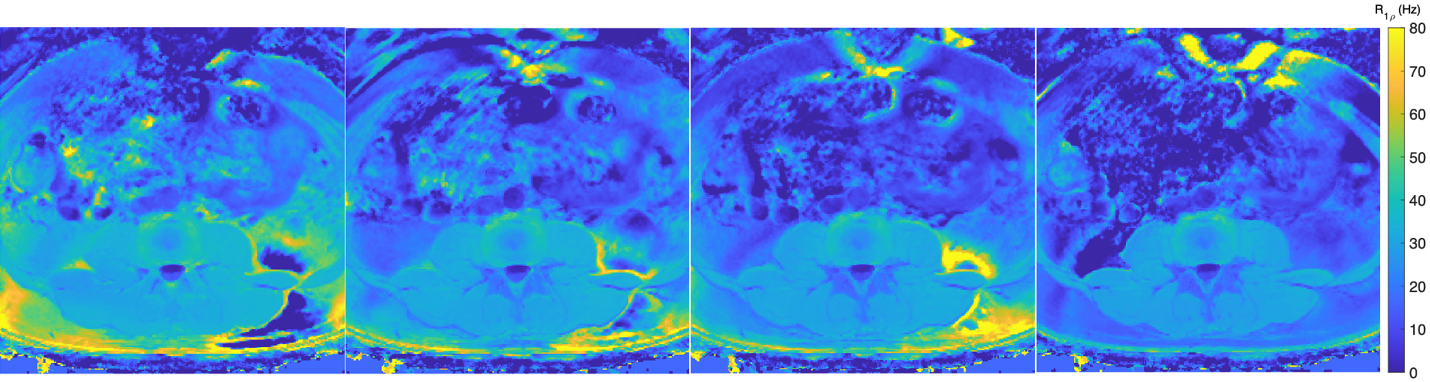
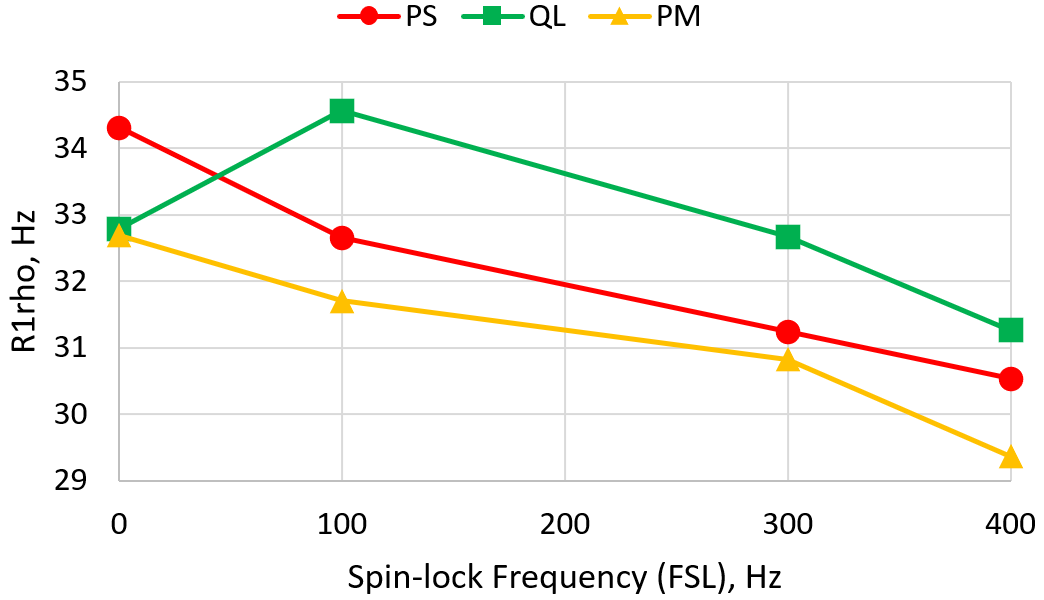
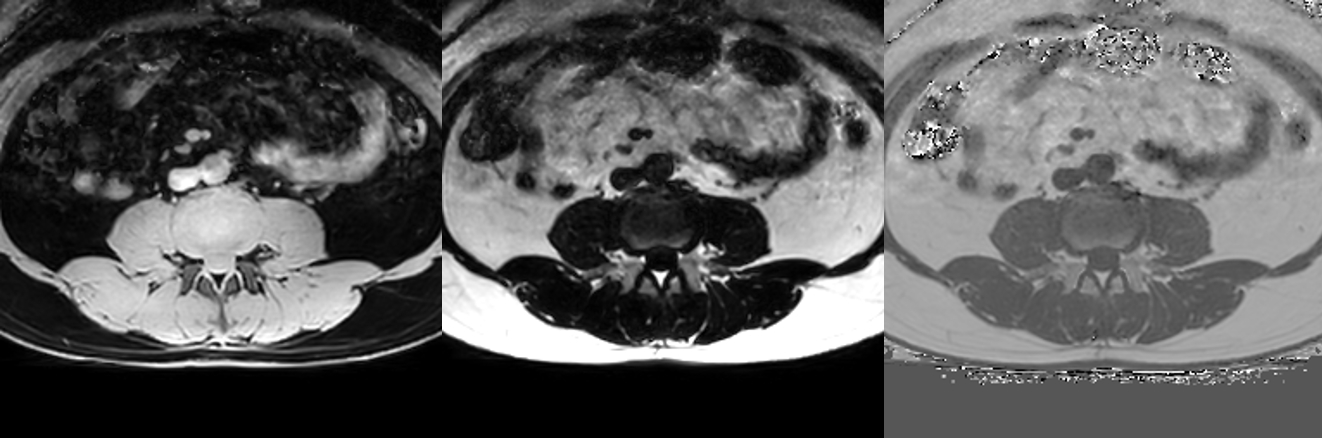
Fig. 2 shows an example of R1rho maps of a 46-yo male subject at each FSL. Fig. 3 demonstrates the R1rho dispersion curves for each muscle. As expected, there is an overall decrease of R1rho with the increase of spin-lock frequency. Furthermore, there have been previous evidences that the muscle status (for instance the cross-sectional area, fat infiltration) may be predictive of low back pain11,12, so a mDIXON-Quant scan was performed as shown in Fig. 4.DISCUSSION
R1rho dispersion imaging can in principle provide a more complete characterization of tissue composition and the physicochemical changes associated with pathology, but there has not been such a study performed in lumbar muscles. Here we found that R1rho dispersion at 3T is measurable in all the major lumbar muscles. Variations of R1rho at very low locking fields may reflect vascular properties, and also may be influenced by residual field inhomogeneities. However, at higher locking fields, chemical exchange effects should dominate. It is known that glycosaminoglycan (GAG) is one of the main components in muscle extracellular matrix (ECM) and is increasingly implicated in the regulation of biologic processes13. Almost several disorders of muscle are accompanied by changes in the content of GAG. Our study infers that R1rho imaging may be able to reflect such macromolecular changes in lumbar muscles, which has the potential to contribute to the better diagnosis and management of low back pain.CONCLUSION
The study showed that R1rho dispersion is measurable in lumbar muscles at 3T, which suggests that R1rho dispersion may have potential to characterize the biochemical composition of lumbar muscles.Acknowledgements
Barrow Neurological Foundation (455003033568).References
1. Kennedy DJ, Noh MY. The role of core stabilization in lumbosacral radiculopathy. Phys Med Rehabil Clin N Am. 2011; 22(1): 91-103.
2. Fortin M, Lazáry À, Varga P, Battié M. Association between paraspinal muscle morphology, clinical symptoms and functional status in patients with lumbar spinal stenosis. Eur Spine J. 2017; 26(10): 2543-2551.
3. Kalichman L, Carmeli E, Been E. The Association between Imaging Parameters of the Paraspinal Muscles, Spinal Degeneration, and Low Back Pain. Biomed Res Int. 2017; 2017: 2562957.
4. Cobb J, Xie J, Li K, et al. Exchange-mediated contrast agents for spin-lock imaging. MRM. 2012; 67(5):1427–1433.
5. Cobb J, Li K, Xie J, et al. Exchange-mediated contrast in CEST and spin-lock imaging. MRI. 2014; 32(1):28–40. 2015;7(12):1269-1281.
6. Wang P, Block J, Gore J. Chemical Exchange in Knee Cartilage Assessed by R1ρ (1/T1ρ) Dispersion at 3T. MRI. 2015; 33(1):38-42.
7. Goto H, Iwama Y, Fujii M, et al. A preliminary study of the T1rho values of normal knee cartilage using 3T-MRI. Eur J Radiol. 2012; 81(7):e796-803.
8. Borthakur A, Wheaton A, Gougoutas A, et al. In vivo measurement of T1rho dispersion in the human brain at 1.5 tesla. JMRI. 2004; 19(4):403-409.
9. Yuan J, Zhao F, Griffith JF, et al. Optimized efficient liver T1ρ mapping using limited spin lock times. Phys Med Biol. 2012; 57(6):1631-1640.
10. Witschey W, Borthakur A, Elliott M, et al. Artifacts in T1ρ-Weighted Imaging: Compensation for B1 and B0 Field Imperfections. JMR. 2007; 186(1):75–85.
11. Cooley J, Hebert J, de Zoete A, et al. Assessing lumbar paraspinal muscle cross-sectional area and fat composition with T1 versus T2-weighted magnetic resonance imaging: Reliability and concurrent validity. PLoS One. 2021; 16(2): e0244633.
12. Suri P, Fry A, Gellhorn A. Do Muscle Characteristics on Lumbar Spine Magnetic Resonance Imaging or Computed Tomography Predict Future Low Back Pain, Physical Function, or Performance? A Systematic Review. Pm r. 2015; 7(12): 1269-1281. 2015;7(12):1269-1281.
13. Negroni E, Henault E, Chevalier F, et al. Glycosaminoglycan Modifications in Duchenne Muscular Dystrophy: Specific Remodeling of Chondroitin Sulfate/Dermatan Sulfate. J Neuropathol Exp Neurol. 2014; 73(8):789-797.
Figures