3392
Effect of Acquisition and Analysis Conditions on Accuracy of DTI-Based Muscle Architecture Estimates: Predictions Using Numerical Simulations
Xingyu Zhou1,2, Carly Lockard2,3, Melissa Hooijmans4, and Bruce Damon2,3
1Biomedical Engineering, Vanderbilt University, Nashvill, TN, United States, 2Carle Clinical Imaging Research Program, Carle Health, Urbana, IL, United States, 3Stephens Family Clinical Research Institute, Carle Health, Urbana, IL, United States, 4Amsterdam University Medical Center, Amsterdam, Netherlands
1Biomedical Engineering, Vanderbilt University, Nashvill, TN, United States, 2Carle Clinical Imaging Research Program, Carle Health, Urbana, IL, United States, 3Stephens Family Clinical Research Institute, Carle Health, Urbana, IL, United States, 4Amsterdam University Medical Center, Amsterdam, Netherlands
Synopsis
Diffusion-tensor imaging (DTI) based fiber tractography is a useful tool to study the architecture of human skeletal muscle. However, effects of image acquisition and analysis conditions on the outcome of architectural estimates are challenging to examine in vivo. In this work, we describe a numerical simulation framework where the ground truth of muscle architecture is known and the outcome can be tested under different conditions. Results show that the estimate of fiber curvature is most affected by image noise. While second-order polynomial fitting of fiber tracts is more robust to image noise, third-order fitting performs better on highly curved fibers.
Introduction
Muscle architecture significantly influences muscle function1. Therefore, accurate quantification of structural properties of muscle is essential to understanding the relationship between muscle design and performance. DTI-based fiber tractography is widely applied to study muscle architecture non-invasively2. However, the outcome of structural estimates may depend on several image acquisition and analysis conditions3. Although it’s impossible to directly examine their effects in vivo, numerical simulations with known fiber geometry ground truth is one possible approach for such examination. In this work, we continue previous work3 by extending numerical simulation into 3D space and quantify the accuracy of fiber curvature (κ) estimates under different conditions of signal-to-noise ratio (S/N), voxel resolution, fiber tracking step size and polynomial fitting order to smooth fiber tracts.Methods
Figure 1 depicts the general workflow of simulation.Design of simulation experiments We selected percentage error of fiber curvature estimate as the criterion to evaluate architecture estimation outcomes. Table 1 lists the factors examined and their selected values in simulation. Fiber curvature was varied to represent muscle under resting state and during contraction. Image voxel size and fiber tracking step size represent the spatial frequencies of sampling and reconstruction of fiber geometry, respectively. Levels of signal-to-noise ratio (S/N) were selected to match those of voxel volumes. Effects of polynomial fitting order of fiber tracts were also examined.
Formation of model muscle Fascicles from published ultrasound images of human skeletal muscle4–6 were digitized and fitted using previously described method3. Four levels of fascicle curvature were selected in the experiment design.
Formation of simulated image The core simulation space was constructed as 30 mm in width and depth and 120 mm in height. Muscle fibers were arranged parallel in the core space. A layer of two voxels was padded around the core space. The padded layer and voxels in core space without muscle were assumed to be occupied by adipose tissue. Diffusion tensor and image signal for each voxel were then computed using previously described method3.
Fiber tracking and smoothing Seeding points were arranged on a planar mesh perpendicular to axial plane. DTI-based fiber tractography was performed through MuscleDTI_Toolbox using commonly applied tracking options for human skeletal muscle7. Raw fiber tracts were smoothed by fitting them into second- and third-order polynomials.
Structural characterization To ensure consistent analysis under all conditions, fiber tracts seeding from the edge points of the planar mesh were explicitly removed. Structural properties of the remaining smoothed fiber tracts were quantified using MuscleDTI_Toolbox7.
Results
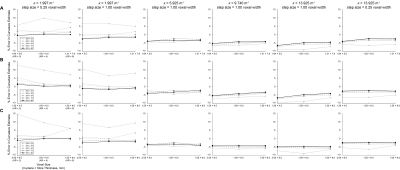
In each simulation run, a total of 140 simulated diffusion-weighted images were generated under 4 levels of intrinsic curvature, 7 levels of image voxel size, and 5 levels of S/N. For every simulated image, fiber tractography was performed under 4 levels of tracking step size, and each raw tract smoothed using second- and third-order polynomial fitting. Between 9 and 24 smoothed tracts remained for outcome evaluation under each condition. A total of 150 runs of simulation were performed.Figure 2 shows the relationship between the accuracy of curvature estimate and voxel properties using second-order polynomial fitting. Briefly, image noise played the most significant role in the accuracy of curvature estimate. Tractography outcome tended to become stable with S/N > 39. For fibers with low intrinsic curvature, second-order polynomial fitting tended to overestimate the curvature, while for highly curved fibers, second-order polynomial fitting underestimated the curvature in all conditions. Lower in-plane resolution and shorter tracking step size tended to elevate the mean estimated curvature, but their effects were less significant than those from S/N.
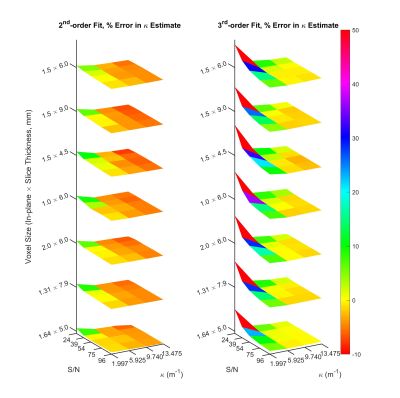
Figure 3 illustrates a comparison between polynomial orders to fit raw fiber tracts. Overall, mean estimated curvature from third-order polynomial fitting was higher than that from second-order fitting. The accuracy of curvature estimate from third-order fitting was more sensitive to image noise, and with low intrinsic fiber curvature, third-order fitting yielded a poorer accuracy than second-order. In general, third-order polynomials fitted better for fibers with median to high curvature from images with S/N > 54.
Conclusion and Discussion
The ultimate goal of numerical simulation is to identify the nature of error in tractography and to quantify the relationship between tractography outcomes and tracking options under different conditions, so that the estimate of skeletal muscle architecture can be optimized. Using this approach, we show here the most significant determinant of the accuracy of curvature estimation is the S/N, while factors such as voxel and step sizes have relatively lesser impact. These data indicate both the need to optimize S/N when acquiring an in vivo dataset and that voxels sizes can be adjusted up to 2.00 mm × 2.00 mm × 6.0 mm in order to achieve sufficient S/N. Differences between the performance of second- and third-order polynomial fitting also indicate the need for a criterion to decide which fitting order should be used in practical applications.Future investigations may include the introduction of variations in curvature directionality of model fibers, and application of anisotropic smoothing8,9 in pre-processing pipeline which improves the effective S/N of diffusion-weighted images. More comprehensive criteria may also be considered to evaluate the outcome of tractography, such as the corresponding segment ratio10,11 between model fiber and smoothed tracts, and statistical behavior of fitting residuals.
Acknowledgements
This work was supported by grant NIH/NIAMS 1 R01 AR073831.References
1. Lieber, R. L. & Ward, S. R. Skeletal muscle design to meet functional demands. Philos. Trans. R. Soc. B Biol. Sci. 366, 1466–1476 (2011).2. Damon, B. M., Buck, A. K. W. & Ding, Z. Diffusion-tensor MRI-based skeletal muscle fiber tracking. Imaging Med. 3, 675–687 (2011).
3. Damon, B. M., Heemskerk, A. M. & Ding, Z. Polynomial fitting of DT-MRI fiber tracts allows accurate estimation of muscle architectural parameters. Magn. Reson. Imaging 30, 589–600 (2012).
4. Muramatsu, T., Muraoka, T., Kawakami, Y., Shibayamaand, A. & Fukunaga, T. In vivo determination of fascicle curvature in contracting human skeletal muscles. J. Appl. Physiol. 92, 129–134 (2002).
5. Ticinesi, A., Meschi, T., Narici, M. V., Lauretani, F. & Maggio, M. Muscle Ultrasound and Sarcopenia in Older Individuals: A Clinical Perspective. J. Am. Med. Dir. Assoc. 18, 290–300 (2017).
6. Franchi, M. V. et al. Muscle Architecture Assessment: Strengths, Shortcomings and New Frontiers of in Vivo Imaging Techniques. Ultrasound Med. Biol. 44, 2492–2504 (2018).
7. Damon, B. M. et al. A MATLAB toolbox for muscle diffusion-tensor MRI tractography. J. Biomech. 124, 110540–110540 (2021).
8. Ding, Z., Gore, J. C. & Anderson, A. W. Reduction of noise in diffusion tensor images using anisotropic smoothing. Magn. Reson. Med. 53, 485–490 (2005).
9. Buck, A. K. W., Ding, Z., Elder, C. P., Towse, T. F. & Damon, B. M. Anisotropic smoothing improves DT-MRI-based muscle fiber tractography. PLoS One 10, e0126953 (2015).
10. Zhaohua Ding, Gore, J. C. & Anderson, A. W. Case study: reconstruction, visualization and quantification of neuronal fiber pathways. in Proceedings Visualization, 2001. VIS ’01. 453–588 (IEEE, 2001). doi:10.1109/VISUAL.2001.964549.
11. Damon, B. M., Ding, Z., Anderson, A. W., Freyer, A. S. & Gore, J. C. Validation of diffusion tensor MRI-based muscle fiber tracking. Magn. Reson. Med. 48, 97–104 (2002).
Figures

General workflow of simulation. Model fibers with known curvature are computed. Diffusion tensor and simulated DWI images are computed based on parallel arrangement of model fibers in the whole simulation space. Tractography, fiber tract smoothing and architectural quantification of smoothed fiber tracts are performed using MuscleDTI_Toolbox.

Relationship between the accuracy of curvature estimate and aspect ratio (A), in-plane resolution (B), and slice thickness (C) of voxels using second-order polynomial fitting under different noise levels. Second order polynomial fitting results in overestimation of curvature for low curved fibers while underestimation for highly curved fibers. Image noise has the most significant effect on the outcome of curvature estimate, with tracking step size and voxel dimension affect slightly.

Comparison between polynomial orders used to fit raw fiber tracts tracked at 1.00 voxel width. Left: Fitting fiber tracts using second-order polynomials results in overestimation of curvature for low curved fibers and underestimation for highly curved ones. Right: Third-order polynomial fitting results in overestimation of curvature in most of cases. While third-order polynomial fitting performs better than second-order in accuracy of curvature estimation for highly curved fibers, it’s more sensitive to noise. Voxel size does not have significant impact on the outcome.
DOI: https://doi.org/10.58530/2022/3392