3390
Tongue Deformation and Strain Estimation using Tagged RT-MRI and Optical Flow1Ming Hsieh Department of Electrical and Computer Engineering, University of Southern California, Los Angeles, CA, United States, 2Department of Linguistics, University of Southern California, Los Angeles, CA, United States
Synopsis
Real-time MRI plays an important role in studying articulator movements during typical and atypical human speech. Recently, real-time tagging methods were developed to reveal inner tongue movements, including deformations in the body of the tongue that were previously unobservable. Here, we demonstrate tracking of tongue deformations and estimation of tongue strain from real-time tagging, using a motion-compensated total generalized variation reconstruction and optical flow. Optical flow tracking has an averaged error of 1.10±0.83mm, compared with manually tracked tagged line intersections, while intra-observer variability is 0.80±0.49mm. The estimated tongue deformation and strain maps provide for linguistically sensible interpretation.
Introduction
Real-time magnetic resonance imaging (RT-MRI) is an important tool for the study of human speech production1,2. Recently, tagging has been applied in RT-MRI for imaging speech production3,4, revealing deformations in the body of the tongue that were previously unobserved. Quantitative estimation of the internal deformations of the tongue body may provide insights into typical vowel and consonant formation, and may have consequent clinical impact for atypical speech such as post-glossectomy. Automated processing of tagged RT-MRI and extraction of quantitative biomarkers is an unmet need. In this work, we applied constrained reconstruction and optical flow (OF) on tagged speech RT-MRI to automatically quantify tongue deformation and strain. Manually tracked tagged line intersections were used to validate the pipeline. The proposed approach generates real-time motion and strain maps that are linguistically sensible and interpretable.Methods
Data AcquisitionThe pulse sequence used in this study was a spiral SPGR intermittently triggered with SPAMM 180o tagging pulse3, and was designed to place a 2D grid of tag lines with 1 cm spacing. Other parameters include: 13 spiral interleaves, FOV=20×20cm2, voxel size=2×2×7mm3, Tread=2.49ms, and TR/TE=5.58ms/0.71ms. Experiments were performed on a Signa Excite HD 1.5T scanner (GE Healthcare, Waukesha, Wisconsin) with a custom eight-channel upper-airway coil5. The pulse sequence was implemented using the RTHawk (HeartVista, Los Altos, CA, USA) platform6. Two native American English speakers (28/M, 28/F) were scanned while speaking three stimuli sentences: “a pie again,” “a poppy again,” and “a pop pip again.”3
Image Reconstruction
A motion-compensated total generalized variation (MC-TGV) regularization along the temporal dimension was used in reconstruction, as described in the cost function:$$||Am-d||_2^2+\lambda_1||\nabla_tDm-z||_1+\lambda_0||\nabla_tz||_1$$
where $$$d$$$ is the multi-coil k-space data, $$$m$$$ represents images to be reconstructed, $$$A$$$ is the sampling matrix, $$$\nabla_t$$$ is the temporal finite difference operator, $$$D$$$ is a motion-compensation step that registers each image to its adjacent frame7,8, and $$$\lambda_t=\lambda_1=0.5\lambda_0$$$ are the regularization parameters9. Deformation maps $$$D$$$ were estimated using Farnebäck’s OF10 as described below. Data was processed by an estimation-subtraction spiral aliasing reduction method to reduce the interference from signal outside the FOV11. Phase sensitive reconstruction was done after constrained reconstruction to enhance the image (final image $$$\bar{d}$$$.)3
Motion Estimation
We employed the Farnebäck’s OF10 to estimate motion from reconstructed images. This method approximates each pixel with its neighborhood pixels by a polynomial and assumes smoothness of deformation maps within a neighborhood, introducing two parameters: the polynomial expansion area $$$\sigma_p$$$ and the smoothing neighborhood $$$\sigma_s$$$. Deformation maps were estimated frame-by-frame between $$$\bar{d}_i$$$ and $$$\bar{d}_{i+1}$$$ for the $$$i$$$th frame.
Evaluation
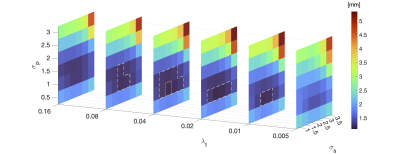
The motion estimation pipeline was evaluated by comparing the tracked tagged line intersections with manually tracked intersections. We picked 20 equally spaced time frames from the stimuli “a poppy again” from one subject and one observer identified tagged line intersections in the tongue three times. Three parameters in the pipeline were swept ($$$\lambda_t\in[0.005,0.01,0.02,0.04,0.08,0.16]$$$, $$$\sigma_p\in[0.5,1,1.5,2,2.5,3]$$$, and $$$\sigma_s\in[1,1.5,2,2.5,3,3.5]$$$) and the set of parameters giving the lowest error was applied on the other five datasets for further analysis. For the other five datasets, intersections were manually tracked once to evaluate the generality of the pipeline. Finally, deformation maps represented by quiver plots and strain maps were reviewed to identify key vocal tract postures associated with the lingual constrictions used in producing vowels [a], [i], [ɪ] and consonant [g].
Results
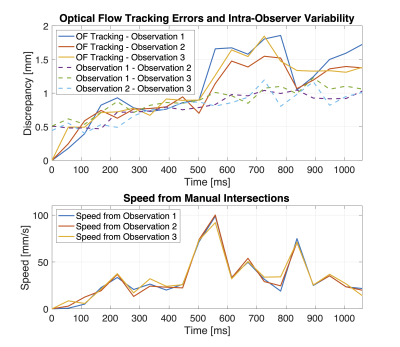
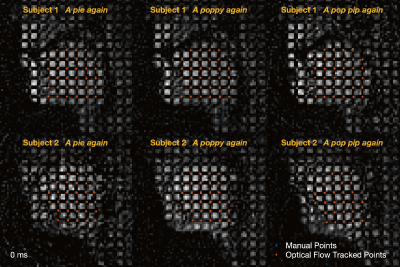
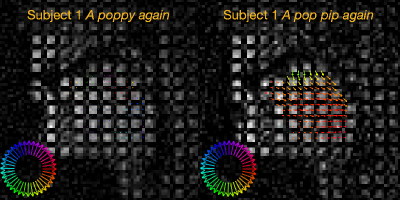
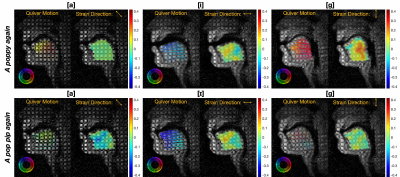
Figure 1 shows the parameter sweep results. The minimum discrepancy between OF and manual reference was 1.10±0.83mm with the parameters $$$\lambda_t=0.04$$$, $$$\sigma_p=1$$$, $$$\sigma_s=2$$$ which was slightly higher than the intra-observer variability (0.80±0.49mm) as shown in Figure 2. With this set of parameters, the averaged discrepancy from all datasets was 1.11±0.85 mm. Figure 3 illustrates the manually drawn intersections and the OF tracked intersections for all datasets.Figure 4 shows the real-time quiver map for the stimuli “a poppy again” and “a pop pip again,” and Figure 5 shows the production process of lingual constrictions for a low back vowel [a], high front vowels [i, ɪ] and the velar consonant [g] in those stimuli.
Discussion
In this work, we have demonstrated and validated tongue motion and strain quantification from real-time tagging MRI with MC-TGV reconstruction and OF. The pipeline has an averaged error of 1.10±0.83 mm, which is close to the intra-observer variability 0.80±0.49 mm. While previous measurements of tongue motion focused on 3D motion with temporally combined data12-14, the proposed approach can reveal inner tongue motion in real-time.With the estimated deformation and strain maps, internal tongue deformation associated with key constriction postures (for [a], [i, ɪ] and [g]) could be identified from the real-time series. These motion pattern and strain analysis are consistent with previous finding15, such that forward horizontal (genioglossus) action is prominent for [i], down and back pharyngeal (hyoglossus) action is prominent for [a], and up and back (styloglossus) action is prominent for [g]. In the future, this tool can be generalized to study a broad range of speech production, including coarticulatory and context effects.
Conclusion
The proposed MC-TGV and OF can accurately quantify tongue motion from real-time tagged MRI. Strain maps derived from estimated deformation are linguistically sensible and interpretable in terms of phonetic constriction formation in the vocal tract and can be illuminating in the study of real-time speech production.Acknowledgements
We acknowledge grant support from National Institute of Health (R01-DC007142).References
1. Bresch E, Kim Y, Nayak K, Byrd D, Narayanan S. Seeing speech: Capturing vocal tract shaping using real-time magnetic resonance imaging [Exploratory DSP]. IEEE Signal Processing Magazine 2008;25(3):123-132.
2. Lingala SG, Sutton BP, Miquel ME, Nayak KS. Recommendations for real-time speech MRI. J Magn Reson Imaging 2016;43(1):28-44.
3. Chen W, Lee NG, Byrd D, Narayanan S, Nayak KS. Improved real-time tagged MRI using REALTAG. Magn Reson Med 2020;84(2):838-846.
4. Chen W, Byrd D, Narayanan S, Nayak KS. Intermittently tagged real-time MRI reveals internal tongue motion during speech production. Magn Reson Med 2019;82(2):600-613.
5. Lingala SG, Zhu Y, Kim YC, Toutios A, Narayanan S, Nayak KS. A fast and flexible MRI system for the study of dynamic vocal tract shaping. Magn Reson Med 2017;77(1):112-125.
6. Santos JM, Wright GA, Pauly JM. Flexible real-time magnetic resonance imaging framework. Conf Proc IEEE Eng Med Biol Soc 2004;2004:1048-1051.
7. Asif MS, Hamilton L, Brummer M, Romberg J. Motion-adaptive spatio-temporal regularization for accelerated dynamic MRI. Magn Reson Med 2013;70(3):800-812.
8. Tian Y, Mendes J, Pedgaonkar A, Ibrahim M, Jensen L, Schroeder JD, Wilson B, DiBella EVR, Adluru G. Feasibility of multiple-view myocardial perfusion MRI using radial simultaneous multi-slice acquisitions. Plos One 2019;14(2).
9. Knoll F, Bredies K, Pock T, Stollberger R. Second order total generalized variation (TGV) for MRI. Magn Reson Med 2011;65(2):480-491.
10. Farnebäck G. Two-Frame Motion Estimation Based on Polynomial Expansion. Image Analysis; 2003; Berlin, Heidelberg. Springer Berlin Heidelberg. p 363-370. (Image Analysis).
11. Tian Y, Lim Y, Zhao Z, Byrd D, Narayanan S, Nayak KS. Aliasing artifact reduction in spiral real-time MRI. Magn Reson Med 2021;86(2):916-925.
12. Xing F, Woo J, Gomez AD, Pham DL, Bayly PV, Stone M, Prince JL. Phase Vector Incompressible Registration Algorithm for Motion Estimation From Tagged Magnetic Resonance Images. IEEE Trans Med Imaging 2017;36(10):2116-2128.
13. Xing F, Woo J, Lee J, Murano EZ, Stone M, Prince JL. Analysis of 3-D Tongue Motion From Tagged and Cine Magnetic Resonance Images. J Speech Lang Hear Res 2016;59(3):468-479.
14. Stone M, Liu X, Chen H, Prince JL. A preliminary application of principal components and cluster analysis to internal tongue deformation patterns. Comput Methods Biomech Biomed Engin 2010;13(4):493-503.
15. Sidney W. A radiographic analysis of constriction locations for vowels. Journal of Phonetics 1979;7(1):25-43.
Figures
