3389
Hyperpolarized 129Xe Ventilation and Gas Exchange Images Acquired in a Single 10 s Breath-hold.1Internal Medicine, University of Kansas Medical Center, Kansas City, KS, United States
Synopsis
Hyperpolarized 129Xe MRI (Xe-MRI) can be used to acquire images of pulmonary ventilation and gas exchange. These ventilation and gas exchange images are typically acquired in separate breath-holds, which lengthens scan time, increases cost, and requires more of patients. We have combined 3D spiral (FLORET) ventilation imaging with radial 1-point Dixon gas exchange imaging within a single-breath-hold scan. This single-breath-hold scan produces both a gas exchange and a “high-resolution” (4x4x4 mm3 voxels) ventilation image that are qualitatively and quantitatively similar to images acquired in dedicated breath-holds. This increase in efficiency improves the clinical feasibility of hyperpolarized 129Xe MRI.
Introduction
Recent innovations in hyperpolarized 129Xe MRI have improved the resolution and efficiency of Xe-MRI methods. For example, 3D spiral imaging techniques have enabled xenon ventilation images with 3D-isotropic resolution to be acquired within a breath-hold that is short in comparison to standard methods.1 Moreover, the concept of flip-angle/TR equivalence2 has been used to significantly reduce breath-hold duration for gas exchange imaging.3 Even so, multiple breath-holds of xenon gas are required to generate “clinical quality” images of ventilation and gas exchange. This requirement of multiple doses of xenon gas to measure different aspects of lung function is a hindrance to the clinical adoption of Xe-MRI. In this work, hyperpolarized 129Xe 1-point Dixon gas exchange imaging is combined with 3D spiral acquisition to generate gas exchange images alongside high-resolution ventilation images within a single, clinically manageable breath-hold.Methods
Xenon gas exchange imaging using the 1-point Dixon technique typically uses an interleaved 3D radial sampling scheme to sample both gaseous and dissolved phase xenon. The short readout of a radial acquisition is ideal for dissolved xenon, which has fast relaxation (T2* ~ 1 ms at 3T),4 but makes poor use of the gaseous xenon signal (T2* ~18 ms at 3T).5 3D spiral imaging techniques allow longer sampling of the gaseous xenon signal thereby improving imaging efficiency. As such, we have created an interleaved radial/spiral imaging sequence which uses a radial sampling of dissolved signal and spiral (“FLORET”)6 sampling of gaseous signal (Figure 1). Importantly, contrast in dissolved phase images depends on the time between acquisitions at like-frequencies – i.e. the time from one RF pulse at the dissolved frequency to the next pulse at the dissolved frequency. Thus, we use different TR values for radial (2.7 ms) and spiral (5.3 ms) acquisitions with an overall effective TR of 8 ms. Finally, we use flip-angle/TR equivalence to set the flip angle such that TR90,equiv = 249 ms, the value associated with the most commonly reported parameter settings for 1-point Dixon imaging, which allows for simple comparison to images acquired using standard methods.7 This strategy allows the simultaneous acquisition of ventilation images with resolution of 4x4x4 mm3 and gas exchange images with resolution of 6.25x6.25x6.25 mm3, competitive with current field standards.7 The total scan duration is ~10 s. A 3D-spiral anatomic image (~3s) is acquired in the same breath-hold for a total imaging time of ~13.5 s.8 subjects were imaged with this single breath ventilation/gas exchange (SB-VGE) imaging sequence. For 7 of 8 subjects, a ventilation image was acquired using a 3D FLORET sequence in a separate, dedicated breath-hold. For five of 8 subjects, a gas exchange image was acquired in a separate breath-hold. All images were reconstructed using non-cartesian reconstruction code8 and analyzed using an automated, home-built analysis pipeline. Ventilation images were analyzed by calculating ventilation defect percent (VDP) using mean-anchored linear binning.9 Gas exchange images were analyzed as described by Wang et al.10 Whole lung quantitative biomarkers from dedicated and single-breath images were compared. Additionally, images were registered to each other to perform line analysis and regional comparison of defect segmentations (i.e. dice coefficients).
Results
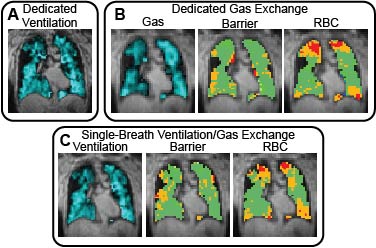
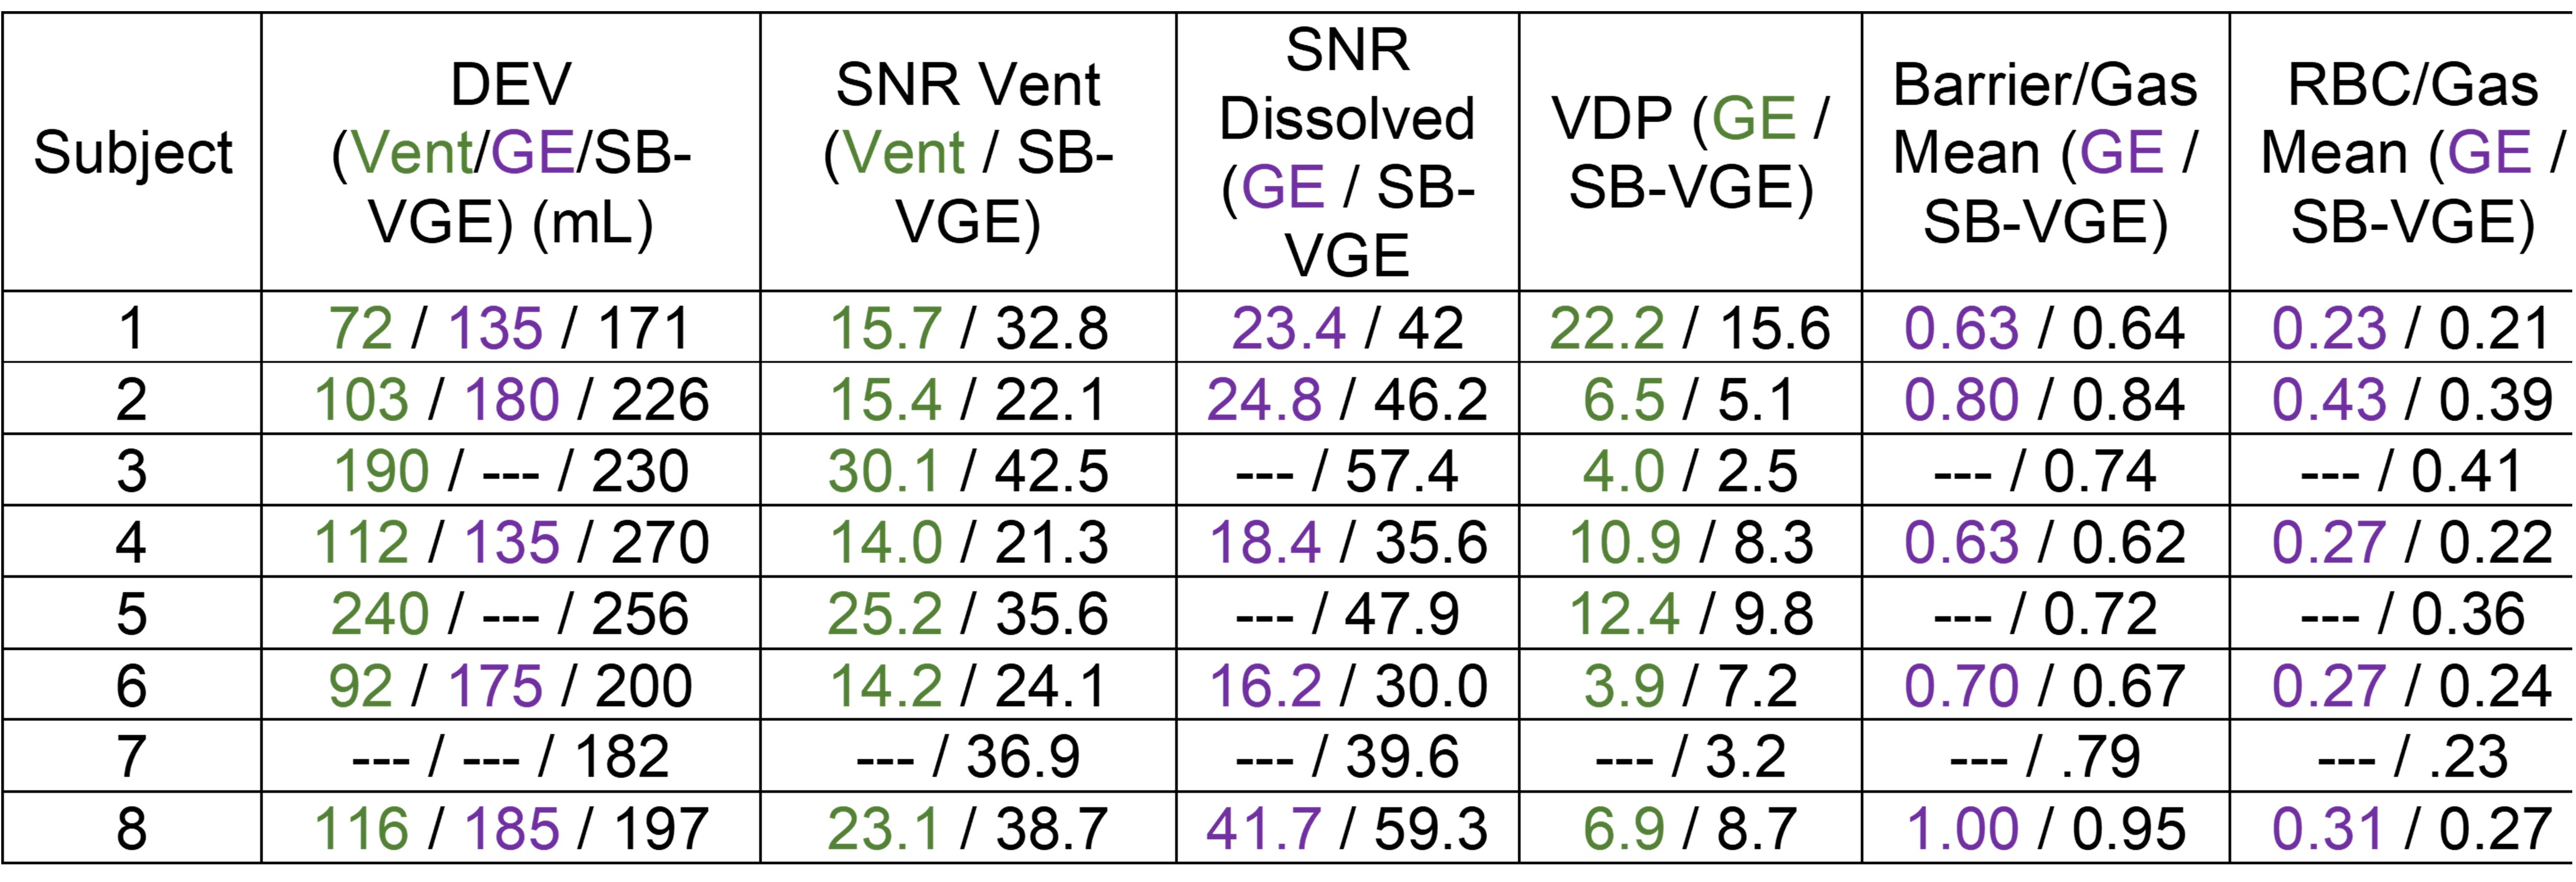
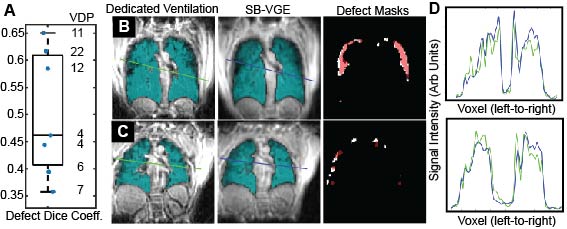
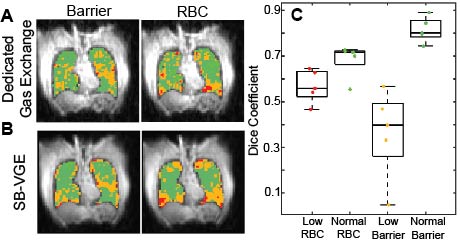
Images were acquired and reconstructed for all 8 subjects. Qualitative agreement between images acquired in dedicated breath-hold and those acquired with SB-VGE was excellent (Figure 2). The dose equivalent volume (DEV) and image SNR for all images is summarized in Figure 3. SNR for SB-VGE images was equivalent or superior to images acquired in dedicated breath-holds. Intraclass correlation coefficients (ICC) were calculated for each quantitative metric including ventilation defect percentage (VDP) (ICC = 0.90, p = 0.006), mean barrier signal (ICC = .99, p = 0.001), mean RBC signal (ICC = 0.93, p < 0.001), global RBC oscillation (ICC = 0.984, p = 0.001), percent of the lungs with low barrier (%low barrier) (ICC = .98, p = 0.001), and percent of the lungs with low RBC signal (%low RBC) (ICC = 0.92, p = 0.006).Line analysis on ventilation images show that images have similar true resolution, despite a qualitative appearance of increased blurring in single breath images (Figure 4). Regional agreement for ventilation defects, barrier defects, and RBC defects (Figure 5) is moderate to good. Segmentations with poor regional agreement consistently have small volume, suggesting that the poor agreement stems from a small number of voxels.
Discussion
Despite minor differences in timing, resolution, and sampling percentage between the SB-VGE sequence and dedicated ventilation and gas exchange sequences, the qualitative and quantitative agreement of images and imaging biomarkers were excellent, particularly for gas exchange imaging (Figure 5). Quantitative agreement for ventilation images was still high, though slightly below that seen in gas exchange images. This may be due to the reduced sampling percentage in the SB-VGE sequence or simply breath-to-breath variation.Conclusions
Hyperpolarized 129Xe interleaved spiral/radial ventilation/gas exchange imaging during a single breath is an effective method of acquiring the most clinically relevant information attainable from Xe-MRI. Both ventilation and gas exchange images are acquired with similar contrast and resolution to those acquired in dedicated breath-holds, and quantitative metrics from the two methods are comparable. These advances improve the clinical feasibility of hyperpolarized 129Xe MRI.Acknowledgements
This research was supported by the University of Kansas Institute for Clinical and Translational Science (UL1TR002366). Imaging was performed at the Hoglund Biomedical Imaging Center, which is supported by the NIH (S10RR29577)References
1. Willmering MM, Niedbalski PJ, Wang H, et al. Improved pulmonary 129Xe ventilation imaging via 3D-spiral UTE MRI. Magn Reson Med 2020;84:312-20.
2. Ruppert K, Amzajerdian F, Hamedani H, et al. Assessment of flip angle–TR equivalence for standardized dissolved-phase imaging of the lung with hyperpolarized 129Xe MRI. Magn Reson Med 2019;81:1784-94.
3. Niedbalski PJ, Lu J, Hall CS, et al. Utilizing flip angle/TR equivalence to reduce breath hold duration in hyperpolarized 129Xe 1-point Dixon gas exchange imaging. Magn Reson Med 2021;n/a.
4. Mugler JP, Altes TA, Ruset IC, et al. Image-based measurement of T2* for dissolved-phase Xe129 in the human lung. Proc Intl Soc Mag Reson Med 2012;20:1347.
5. Xu XJ, Norquay G, Parnell SR, et al. Hyperpolarized 129Xe gas lung MRI-SNR and T2*comparisons at 1.5 T and 3 T. Magn Reson Med 2012;68:1900-4.
6. Pipe JG, Zwart NR, Aboussouan EA, Robison RK, Devaraj A, Johnson KO. A new design and rationale for 3D orthogonally oversampled k-space trajectories. Magn Reson Med 2011;66:1303-11.
7. Niedbalski PJ, Hall CS, Castro M, et al. Protocols for multi-site trials using hyperpolarized 129Xe MRI for imaging of ventilation, alveolar-airspace size, and gas exchange: A position paper from the 129Xe MRI clinical trials consortium. Magn Reson Med 2021;86:2966-86.
8. Robertson SH, Virgincar RS, He M, Freeman MS, Kaushik SS, Driehuys B. Optimizing 3D noncartesian gridding reconstruction for hyperpolarized 129Xe MRI—focus on preclinical applications. Concept Magn Reson A 2015;44:190-202.
9. Thomen RP, Walkup LL, Roach DJ, Cleveland ZI, Clancy JP, Woods JC. Hyperpolarized 129Xe for investigation of mild cystic fibrosis lung disease in pediatric patients. J Cyst Fibros 2017;16:275-82.
10. Wang Z, Robertson SH, Wang J, et al. Quantitative analysis of hyperpolarized 129Xe gas transfer MRI. Med Phys 2017;44:2415-28.Figures
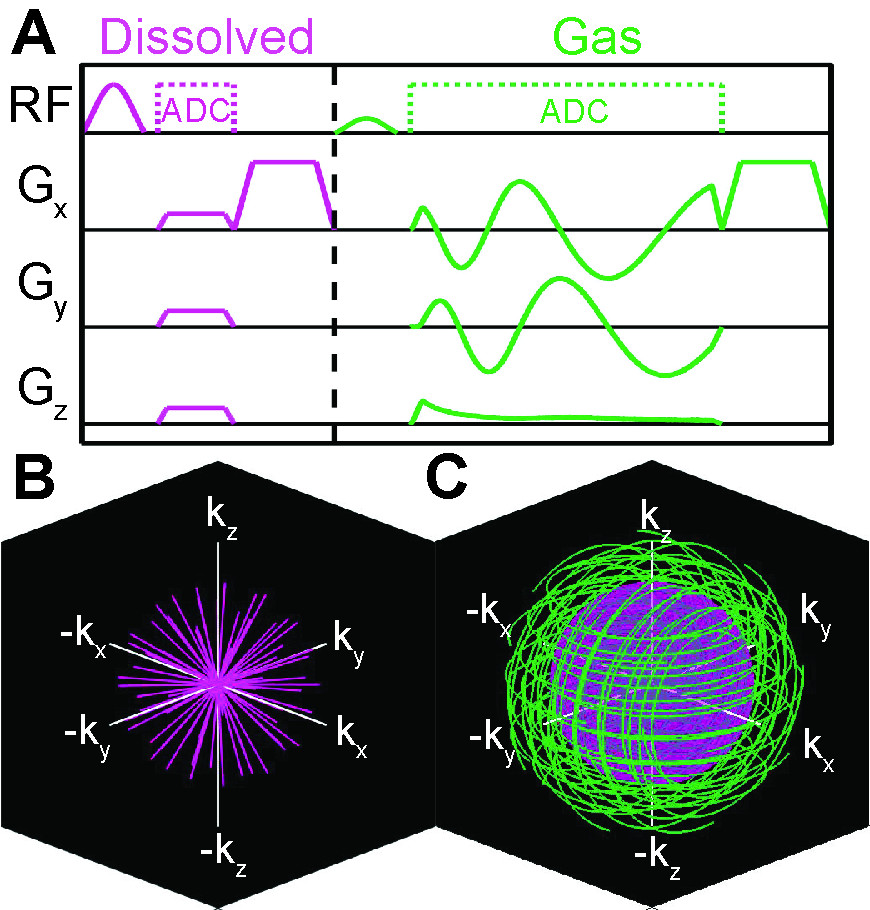
Figure 1. Schematic of Single Breath Ventilation and Gas Exchange (SB-VGE) imaging sequence. A Sequence diagram and B,C k-space coverage for low-resolution radial dissolved and high resolution FLORET gas acquisitions. Low resolution k-space radius is shown by the inset sphere in C.