3388
Reproducibility of Functional Lung Parameters derived from non-contrast enhanced self-gated 2D Ultrashort Echo-Time (UTE) in Healthy Subjects1Department of Internal Medicine II, Ulm University Medical Center, Ulm, Germany, 2Department of Radiology, Ulm University Medical Center, Ulm, Germany
Synopsis
MRI lung imaging is challenging due to cardiac and respiratory motion and the short T2*. In this study the reproducibility of lung function parameters derived from data acquired either from a breath-hold or free-breathing tiny golden angle UTE (2D tyGA UTE) technique have been assessed. Inter-observer and inter-measurement reproducibility was assessed for different lung parameters including lung density and qualitative and quantitative ventilation and perfusion. In general, a very good inter-observer reproducibility and superior reproducibility of the lung function parameters was observed for the free-breathing approach.
INTRODUCTION
MRI lung imaging is challenging due to cardiac and respiratory motion and the short T2*1-3. Lung ventilation has been quantified by non-contrast enhanced MRI by means of signal intensity differences between end-expiration/inspiration either using breath-hold (BH) or self-gating (SG) approaches4,5. Lung perfusion has been addressed by relative signal intensities in the lung in comparison with a fully blood filled space6-8. As alternative, more qualitative approach spectral analysis of intensity changes either based on realtime data (Fourier Decomposition)9-12 or self-gated data (SENCEFUL)13 has been proposed. Tiny golden angle UTE imaging has been introduced as a flexible acquisition scheme for providing aforementioned lung function parameters from a single continuous scan14. The aim of the study is to compare breath-hold and self-gating quantitative and qualitative functional lung imaging regarding inter-measurement and inter-observer reproducibility in healthy volunteers.METHODS
9 healthy volunteers were included in this study. The MR protocol was performed twice on the same day with a short break and repositioning in-between, followed by a third measurement 14 days later. Functional lung data were acquired with a radial 2D spoiled center-out tiny golden angle ultrashort echo time (2D-tyUTE) sequence. 3 coronal slices was acquired during breath-hold (BH) and free-breathing (FB) tyGA scans9. All data were reconstructed with an in-house developed reconstruction framework implemented in MatLab (MathWorks, Natick, Massachusetts, USA). From the FB data, images in different respiratory phases were reconstructed applying an image-based self-gating technique15. To ensure sufficient temporal fidelity cardiac self-gating was performed based on the modulation of the k-space (k0) center amplitude (DC). For BH and FB, the lung parenchyma voxels SNR, lung density (fp), and fractional ventilation (FV) were quantified4. The SNR in the lung parenchyma was calculated as $$$SNR = \frac{\overline{SI}_{\text{lung}}}{\sigma_{\text{noise}}}$$$, with$$${\overline{SI}_{\text{lung}}}$$$ being the mean value of a 5x5 pixel region and σnoise the standard deviation of a manually identified background ROI. fp was calculated pixelwise as $$$f_{\text{p}} = \frac{SI_{\text{lung}}}{SI_{\text{muscle}}} \cdot \exp \left( \frac{TE}{T_2^*}\right)$$$, with SImuscle being the intramuscular signal reference derived from a manually defined ROI placed in the intercostal muscle, and T2* = 0.74 ms used for correcting T2* at 3T2. The fractional ventilation16 was calculated as relative change between inspiration (IN) and expiration (EX) signal intensities as $$$ FV = \frac{SI_{\text{EX}} - SI_{\text{IN}}}{SI_{\text{EX}}}$$$. In the free-breathing data the maximal and minimal lung perfusion was additionally quantified over the cardiac cycle according to Kjostad et al.6, Fischer et al.7, and Pracht et al.8 as $$$f = \frac{SI_{\text{lung}}}{SI_{\text{blood}}} \cdot \frac{1}{2\, T_{\text{RR}}}$$$, with SIlung being the cardiac phase dependent lung signal, SIblood is the signal intensity of a completely blood-filled voxel derived from the region of interest (ROI) located in a major vessel, and TRR the time between two subsequent heartbeats. Further qualitative ventilation and perfusion maps were derived from Fourier analysis of the registered respiratory and cardiac motion resolved data sets.RESULTS
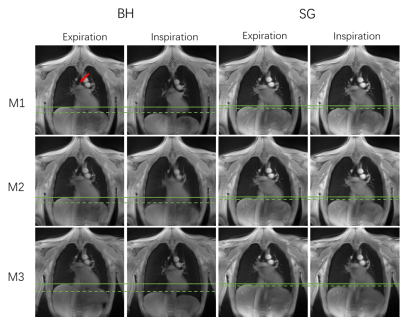
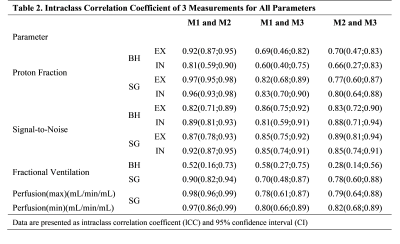
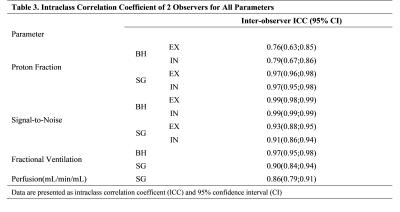
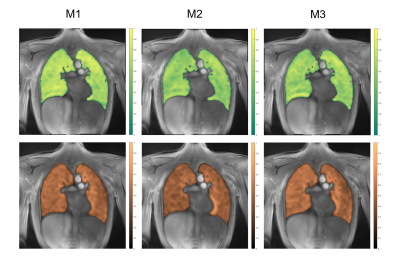
Example images of the central slice are provided in Figure 1 for BH and FB acquisitions. Assessment of SNR, lung density, fractional ventilation (BH, FB) and perfusion analysis (FB only) was feasible (Table 1) for all measurements. In comparison to inspiration, a significant (p<0.05) increase of lung density and SNR was observed during expiration. Differences between inspiration and expiration resulted more pronounced for BH, which is also reflected in the significant higher fractional ventilation values observed with BH. End-expiration lung densities resulted significantly lower for FB, with no significant differences during inspiration (p=0.252). SNR resulted significantly higher for FB for all analyzed data. In general, with the exception of the fractional ventilation between M1 and M3 (ICC = 0.7), in FB (Table 2) all quantified parameters including lung density, SNR, fractional ventilation and maximal and minimal perfusion yielded at least good absolute agreement between all three measurements with ICCs ranging between 0.78 and 0.98. Reproducibility for the BH (Table 2) resulted lower with clear limitations especially for the lung density and consequently also for the FV with ICCs ranging between 0.28 and 0.92. SNR revealed ICCs between 0.81 to 0.89. Inter-observer assessment in FB yielded excellent agreement for lung density, SNR and fractional ventilation with ICCs ranging from 0.90 to 0.97, and good agreement (ICC = 0.86) for the quantitative perfusion assessment. For BH, excellent agreement was obtained for fractional ventilation (ICC = 0.97) and SNR (ICC = 0.99), but only good agreement for the lung density (ICC = 0.76 – 0.79) (Table 3). Ventilation and perfusion maps could successfully be generated by Fourier analysis of the respective dynamic image series (Figure 2) obtained from the FB data and showed good visual reproducibility.DISCUSSION
Tidal volume variability is a critical factor for fractional ventilation reproducibility17. Free-breathing yields a more reproducible respiratory amplitude than breath-hold approaches. 2D UTE in combination with tiny golden angle angular increments in free-breathing showed the potential for multi-respiratory and multi-cardiac phase reconstruction with sufficient image quality for subsequent reproducible extraction of quantitative functional parameter of the lung parenchyma.CONCLUSION
The free-breathing 2D tyGA UTE appears to be a promising technique for lung imaging. Ventilation and perfusion maps derived from SENCEFUL and functional parameters are reproducible in healthy volunteers which may be useful in the clinical setting to non-invasively monitor patients with lung disease in the future.Acknowledgements
No acknowledgement found.References
1. Wild, J.M., et al. MRI of the lung (1/3): methods. Insights into imaging 3, 345-353 (2012).
2. Yu, J., Xue, Y. & Song, H.K. Comparison of lung T2* during free‐breathing at 1.5 T and 3.0 T with ultrashort echo time imaging. Magnetic resonance in medicine 66, 248-254 (2011).
3. Theilmann, R.J., et al. Quantitative MRI measurement of lung density must account for the change in T with lung inflation. Journal of Magnetic Resonance Imaging: An Official Journal of the International Society for Magnetic Resonance in Medicine 30, 527-534 (2009).
4. Balasch, A., et al. 2D Ultrashort Echo‐Time Functional Lung Imaging. Journal of Magnetic Resonance Imaging 52, 1637-1644 (2020).
5. Heidenreich, J.F., et al. Three-dimensional ultrashort echo time MRI for functional lung imaging in cystic fibrosis. Radiology 296, 191-199 (2020).
6. Kjørstad, Å., et al. Quantitative lung perfusion evaluation using Fourier decomposition perfusion MRI. Magnetic resonance in medicine 72, 558-562 (2014).
7. Fischer, A., et al. Assessment of pulmonary perfusion in a single shot using SEEPAGE. Journal of Magnetic Resonance Imaging: An Official Journal of the International Society for Magnetic Resonance in Medicine 27, 63-70 (2008).
8. Pracht, E.D., et al. Single‐shot quantitative perfusion imaging of the human lung. Magnetic Resonance in Medicine: An Official Journal of the International Society for Magnetic Resonance in Medicine 56, 1347-1351 (2006).
9. Pöhler, G.H., et al. Repeatability of phase‐resolved functional lung (PREFUL)‐MRI ventilation and perfusion parameters in healthy subjects and COPD patients. Journal of Magnetic Resonance Imaging 53, 915-927 (2021).
10. Klimeš, F., et al. 3D phase‐resolved functional lung ventilation MR imaging in healthy volunteers and patients with chronic pulmonary disease. Magnetic Resonance in Medicine 85, 912-925 (2021).
11. Glandorf, J., et al. Comparison of phase-resolved functional lung (PREFUL) MRI derived perfusion and ventilation parameters at 1.5 T and 3T in healthy volunteers. Plos one 15, e0244638 (2020).
12. Bauman, G., et al. Non‐contrast‐enhanced perfusion and ventilation assessment of the human lung by means of Fourier decomposition in proton MRI. Magnetic Resonance in Medicine: An Official Journal of the International Society for Magnetic Resonance in Medicine 62, 656-664 (2009).
13. Fischer, A., et al. SElf‐gated Non‐Contrast‐Enhanced FUnctional Lung imaging (SENCEFUL) using a quasi‐random fast low‐angle shot (FLASH) sequence and proton MRI. NMR in Biomedicine 27, 907-917 (2014).
14. Wundrak, S., et al. Golden ratio sparse MRI using tiny golden angles. Magnetic resonance in medicine 75, 2372-2378 (2016).
15. Tibiletti, M., et al. Multistage three‐dimensional UTE lung imaging by image‐based self‐gating. Magnetic resonance in medicine 75, 1324-1332 (2016).
16. Zapke, M., et al. Magnetic resonance lung function–a breakthrough for lung imaging and functional assessment? A phantom study and clinical trial. Respiratory research 7, 1-9 (2006).
17. Klimeš, F., et al. Free‐breathing quantification of regional ventilation derived by phase‐resolved functional lung (PREFUL) MRI. NMR in Biomedicine 32, e4088 (2019).
Figures


Table 3. Intraclass Correlation Coefficient of 2 Observers for All Parameters
