3387
3D multi-echo GRE MRI of the whole liver: First experiences of a volumetric segment-by-segment R2* analysis1Dept. for Diagnostic and Interventional Radiology, Ulm University, Medical Center, Ulm, Germany, 2Section for Experimental Radiology, Ulm University, Medical Center, Ulm, Germany, 3Clinic of Pediatrics and Adolescent Medicine, Ulm University, Medical Center, Ulm, Germany, 4MR Application Predevelopment, Siemens Healthcare GmbH, Erlangen, Germany
Synopsis
Purpose: To test liver segmentation of 3D-multi-gradient-echo MRI data and segmental R2* evaluation.
Methods: 44 patients examined by multi-gradient-echo MRI underwent semiautomatic liver segmentation and subdivision into nine segments. Segmental R2* values were analyzed in all patients together and in patient subgroups.
Results: R2* was lowest in segment 1 (S1), differences to S1 were significant for S3, S5 and S6, highly significant to S2 and S7. Patients with high average R2* showed also significant differences to S1 in some segments.
Conclusions: Inhomogeneity of hepatic iron distribution was found. Low R2* in S1 may be explained by its special vascular supply.
Introduction
The aim of this study was threefold: First, to evaluate whether semiautomatic liver segmentation is feasible on 3D multi-echo GRE MR images covering the whole liver without gap. Second, we aimed to determine R2* values segment by segment and to check for deviations between the R2* values of the individual segments. Finally, segmental R2* values were studied in patient groups, subdivided according to average hepatic R2* levels.Methods
According to the declaration of Helsinki and after approval of our local ethics committee, patients examined by MRI in our clinic between Mid-May 2017 and early April 2018 for noninvasive liver iron content quantification were included after written informed consent. A prototype 3D multi-echo GRE sequence was used at 1.5 T (MAGNETOM Avanto, Siemens Healthcare, Erlangen, Germany) with acquisition accelerated by "Controlled Aliasing In Parallel Imaging Results In Higher Acceleration" (CAIPIRINHA) to enable coverage of the whole liver in a single breath hold.1 The 3D volume consisted of 56 slices with an FoV of 400x300x224 mm3 at a resolution of 2.5x2.5x4 mm3, acquisition matrix was 160x85x44. Further acquisition parameters include six TEs with firstTE and TE increment of 1.2 ms and TR of 12 ms. R2* and MR-PDFF were calculated in-line for each voxel by a non-linear least-squares fit and stored as parameter maps.44 consecutive participants were evaluated (24 m, 20 f, age 23.7 ± 13 years (mean ± SD), age range 4.1 to 60.6 years). The liver was segmented semi-automatically using Liver Health, an additional software tool of the IntelliSpace Portal® (ISP, Philips, Hamburg, Germany) and subdivided into nine segments by anatomical landmarks. Average R2* values were determined for the whole liver and for each segment. Correlation of mean R2* value of individual segments to the average R2* value of the whole liver was studied by calculating Spearman-Rho correlation coefficients. Also, segmental R2* values were tested for differences between segments in the whole patient group and in subgroups divided by average liver R2*. Group I consisted of patients with hepatic R2* < 140 s-1, a threshold derived from the Liver Iron Content (LIC) threshold of 4.5 mg/g indicating the need for chelation therapy and a recently published R2*-LIC-calibration.2 Group II included all other cases. Significance of differences due to R2* were addressed using a Kruskal-Wallis-Test. Differences between liver segments within the groups and for the whole patient cohort were tested by ANOVA with Bonferroni correction.
Results
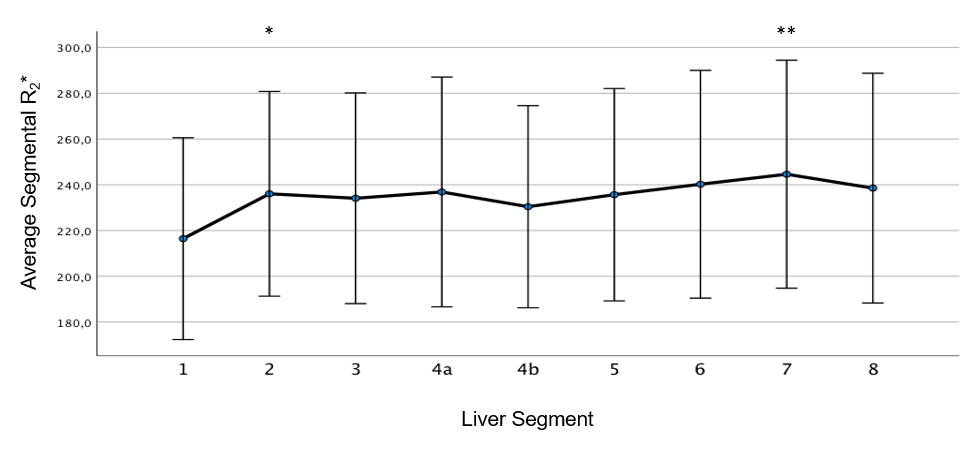
Correlation coefficients are given in Table 1, showing excellent correlation of all segments’ R2* to average R2* of the whole liver. A tendency to superior correlation of S4a, S5, S6 and S8 to whole liver R2* compared to the other segments was seen. Segmental R2* values averaged over all patients are shown in Figure 1. Segment 1 (S1) had the lowest value of 151 ± 103 s-1 (mean ± SD) while the average values of the other segments ranged from 161 s-1 (S4b) to 169 s-1 (S7). The average of whole liver R2* for the total collective was 164 ± 112 s-1 (mean ± SD). No significant differences were found between S2 to S8, but significant differences were observed between S1 and segments 3, 5 and 6, highly significant differences of S1 to S2 and S7. Concerning subgroups, no significant differences were observed in the group with low R2*, which consisted of 21 patients (12 m, age 21.8 ± 8.9 y [mean ± SD], age range 4.9 to 38.6 y), cf. Figure 2. For patients with elevated R2* (23 patients, 12 m, age 25.4 ± 15.9 [mean ± SD], age range 4.1 to 60.6 y), in contrast, shown in Figure 3, a highly significant difference was found between S1 and S7. Difference of S1 to S2 was significant in this group.Discussion
A segmental analysis of the whole liver showed segmental differences in average R2* values similar to those published by Meloni et al.3 Since in our approach the whole liver was covered contiguously without gaps in a 3D acquisition, segments were also included in total. Therefore, we consider our results to be robust findings. The low R2* of S1 can be explained by its different vascular supply – there are not only separate arteries, but also special veins draining S1 and flowing into the lower v. cava caudal to the venous star. Significant R2* differences might indicate that in addition to anatomic subdivision of the liver, there is also deviating functionality of liver segments. The lack of significant differences in the group with low R2* values suggests that observed effects have to do with actual iron overload rather than underlying diseases. A limitation of our study is the small patient number. The time-consuming semiautomatic segmentation process requiring a lot of user-interaction may in foreseeable future be replaced by reliable automatic algorithms employing artificial intelligence.4Conclusion
Correlation of single segments to whole liver R2* was excellent for all segments but best for S4a, S5, S6 and S8. Care should be taken in MR-based iron overload quantification since R2* deviates between segments. S1, fortunately the smallest segment, should be avoided since liver iron content might be underestimated by placing measurements there.Acknowledgements
No acknowledgement found.References
1. Breuer FA, Blaimer M, Mueller MF, et al. Controlled aliasing in volumetric parallel imaging (2D CAIPIRINHA). Magnetic Resonance in Medicine 2006;55:549-56.
2. Wunderlich AP, Schmidt SA, Mauro V, et al. Liver Iron Content Determination Using a Volumetric Breath-Hold Gradient-Echo Sequence With In-Line R2* Calculation. JMRI 2020;52:1550-6.
3. Meloni A, Luciani A, Positano V, et al. Single region of interest versus multislice T2* MRI approach for the quantification of hepatic iron overload. JMRI 2011;33:348-55.
4. Xu Z, Chabin G, Grimm R, et al. A
Deep Learning Approach for Robust Segmentation of Livers with High Iron Content
from MRImages of Pediatric Patients. Proc. ISMRM 2021, 1871
Figures

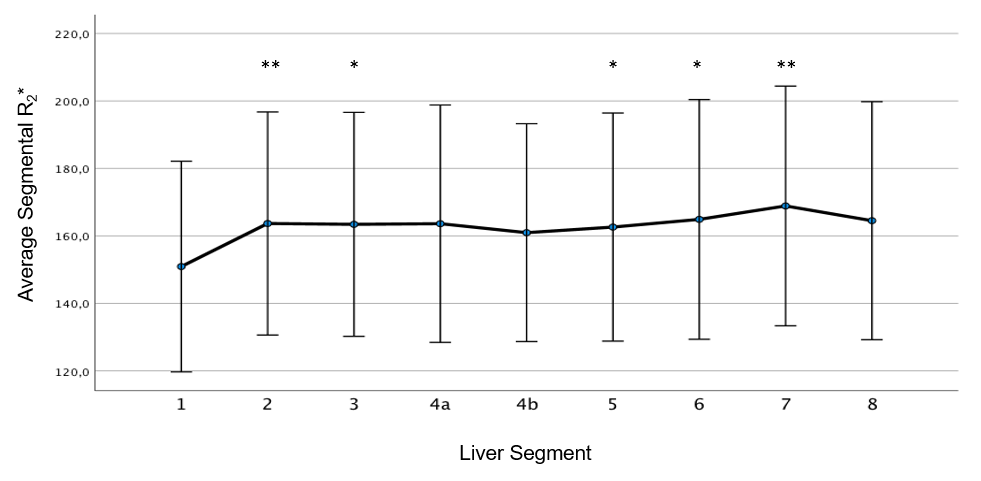
Figure 1. Average segmental R2* for the whole patient cohort. Significant differences to segment 1 are marked by an asterisk (*), highly significant differences by two asterisks (**).
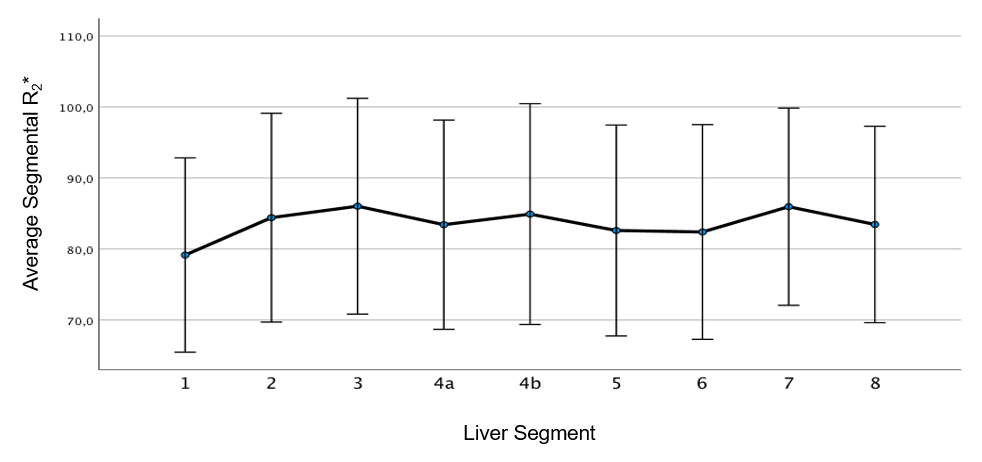
Figure 2. Average segmental R2* for patients with low average whole liver R2* below 140 s-1. No significant differences were observed.