3386
MR-based Liver Iron Quantification using Gradient Echo: Co-Factors influencing the Calibration of R2* with Reference Liver Iron Content Values1Dept. for Diagnostic and Interventional Radiology, Ulm University, Medical Center, Ulm, Germany, 2Section for Experimental Radiology, Ulm University, Medical Center, Ulm, Germany, 3Clinic of Pediatrics and Adolescent Medicine, Ulm University, Medical Center, Ulm, Germany, 4MR Application Predevelopment, Siemens Healthcare GmbH, Erlangen, Germany
Synopsis
Purpose: To analyze the Liver-Iron-Content-(LIC)-R2*-calibration with respect to co-factors.
Methods: 116 patients were scanned with spin-echo (Ferriscan® protocol) and gradient-echo sequences. R2* was correlated to LIC reference values for all patients together and in subgroups divided by e.g. age, gender and underlying diseases. Linear correlations were analyzed with R2* only and including MR-PDFF as suspected co-factor.
Results: Deviating slopes of regression lines were found e.g. in patients after splenectomy vs. patients with spleen, influence of MR-PDFF amongst others in females below 17 years.
Conclusion: Co-factors like disease patterns should be considered in gradient echo based LIC quantification.
Introduction
MR-based Liver Iron Content (LIC) quantification employing Spin Echo (SE) was published in 20051 and is FDA approved. LIC quantification using Gradient Echo (GRE) was also published in 2005,2 a general accepted calibration, however, is not yet achieved. Several studies show good correlation between R2* and LIC values, but with different R2*-LIC-calibration parameters. A review was presented by Henninger et al.3 GRE has many advantages, so it seems worth the effort to identify possible co-factors influencing the R2*-LIC calibration.Methods
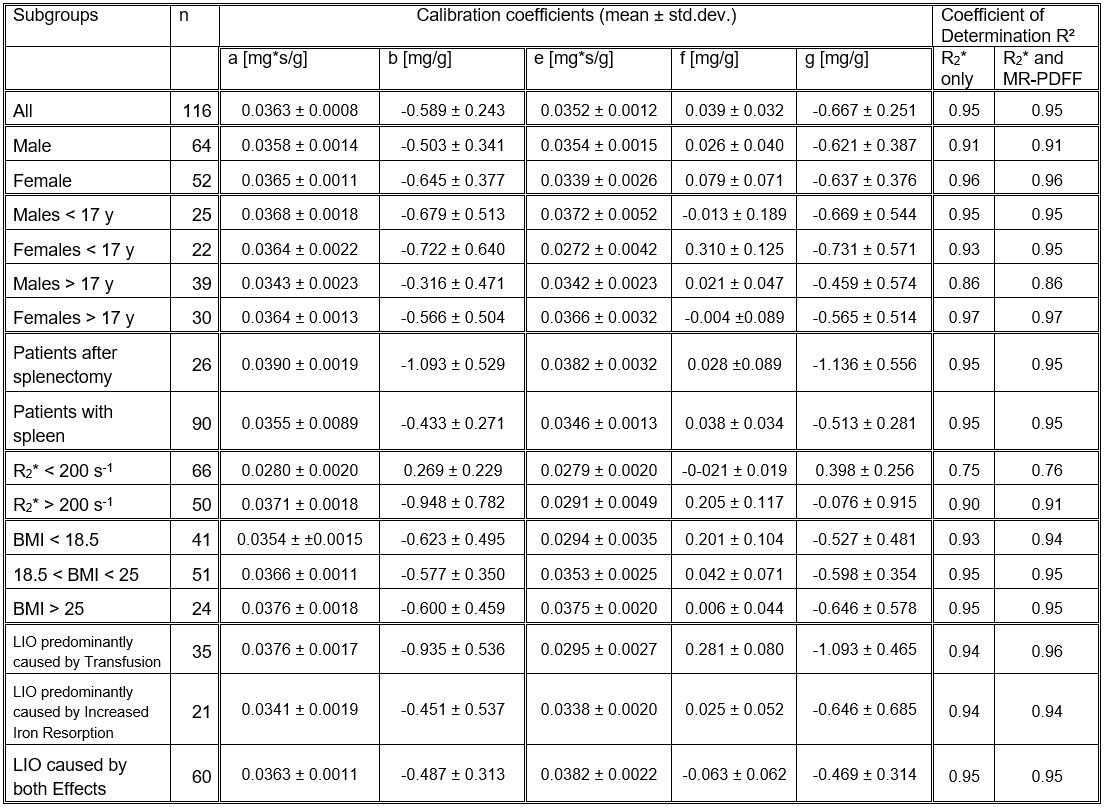
According to the declaration of Helsinki and after approval of our local ethics committee, we scanned 123 patients referred to our institution for LIC determination between March 2016 and April 2018 at 1.5 T (Magnetom Avanto, Siemens Healthcare GmbH) with a prototypical 3D multi-echo GRE sequence performing a voxel-by-voxel fit which estimates R2* and MR-proton density fat fraction (PDFF). Results are stored as parameter maps. The fit procedure, a multi-step fitting process accounting for fat-water signal modulation, but not the noise bias of magnitude data, has been described in detail by Zhong et al.4 Acquisition parameters were six TEs with minimal TE and TE increment of 1.2 ms, TR of 12 ms and a resolution of 2.5x2.5x4 mm³. Also, immediately before GRE, we also acquired the Ferriscan® SE protocol, i.e. five single-echo scans at TEs of 6 to 18 ms. Ferriscan® results served as reference LIC values. In our analysis, we included 116 consecutive MR-studies (64 men, mean age 22.5 y), only omitting investigations of patients scanned twice in the given time interval and scans where LIC exceeded the upper limit of the reference method.In a single GRE slice best suited to place three ROIs avoiding vessels and artifacts, R2* and MR-PDFF were determined as average of ROI values. R2* was correlated to reference LIC and the parameters of the linear regression equations
LIC = a x R2* + b
were determined together with their uncertainties. Also, in a multiple linear regression analysis, the influence of MR-PDFF was studied by
LIC = e x R2* + f x MR-PDFF + g
resulting in parameters describing the combined influence of R2* and MR-PDFF on LIC determination.
These analyses were performed for the whole patient cohort as well as in subgroups, thereby estimating the influence of co-factors. The subgroups related to patient characteristics were gender, age (adolescent vs. adults), BMI and underlying disease. For the latter, patients were subdivided according to the primary reason for liver iron overload (LIO), namely a) transfusion, b) increased iron absorption and a third group c) where both effects were comparable. An influence of MR-PDFF was assumed for f larger than 0.1 but only if its uncertainty was lower than its absolute value. An additional co-factor was average R2* with a threshold of 200 s-1 motivated by the LIC risk threshold of 7 mg/g and a recently published R2*-LIC-calibration employing the same sequence as used as in this work.5
Results
Calibration parameters and their uncertainties are given in Table 1. The key findings are:Deviation of calibrations between
- cases with R2* < 200 s-1 vs. R2* > 200 s-1
- patient groups a) (transfusion) vs. group b) (increased iron resorption)
- patients after splenectomy vs. patients with spleen
Influence of MR-PDFF
- in females younger than 17 years
- patient group a) (increased iron resorption)
- in lean patients (BMI < 18.5)
- for cases with R2* > 200 s-1
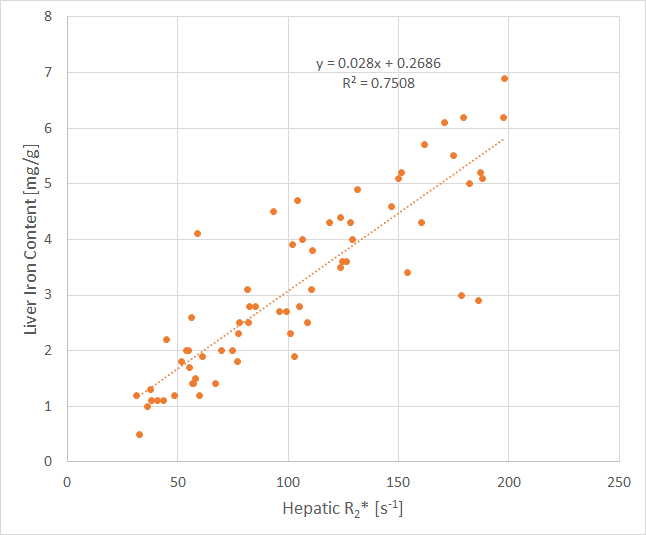
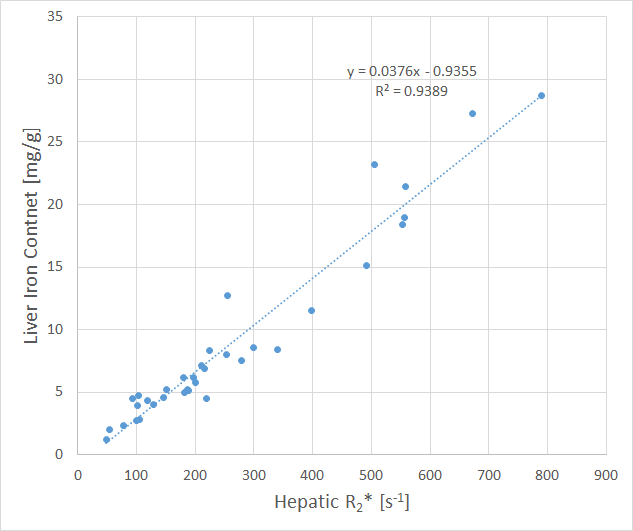
The correlations with the lowest (cases with R2* < 200 s-1) and highest (disease group a) slopes of regression lines are shown in Figs. 1 and 2.
Discussion
This study provides additional insights into the common approach of cross-calibrating R2* with Ferriscan® as a reference measure for LIC. Several factors influencing the R2*-LIC-calibration were identified. The most prominent difference in slope between subgroups was observed in low vs. high R2*. This might indicate imperfections of the protocol used since findings are consistent with underestimation of large R2* values but may also be due to suspected overestimation of the reference method for high LIC.6 It needs to be investigated whether LIC estimation based on GRE sequences should be modified by accounting for some of these factors, and what the best strategy could be to account for co-factors since groups overlap. For example, 17/35 patients (49%) in the group a) with the highest slope of the regression line (coefficient ‘a’) have an R2* value below 200 s-1 – the subgroup where we observed the lowest value for coefficient a. Since the LIC reference values have been determined by Spin-Echo MRI, we would like to mention that findings may be related to different signal characteristics of SE vs. GRE as pointed out by Jensen et al. who found that different forms of iron, namely dispersed vs. aggregated iron influence SE and GRE signals in diverse manner.7 It must be noted that the presented findings should be verified by extensive statistics to determine significance of differences in linear correlations.Conclusion
Due to reasons currently not definitely identified, correlation of LIC reference values with R2* values is dependent on several co-factors. Further studies are needed to investigate how to consider co-factors like disease patterns to adapt gradient echo based LIC quantification.Acknowledgements
No acknowledgement found.References
1. St Pierre TG, Clark PR, Chua-anusorn W, et al. Noninvasive measurement and imaging of liver iron concentrations using proton magnetic resonance. Blood 2005;105:855-61.2. Wood JC, Enriquez C, Ghugre N, et al. MRI R2 and R2* mapping accurately estimates hepatic iron concentration in transfusion-dependent thalassemia and sickle cell disease patients. Blood 2005;106:1460-5.
3. Henninger B, Zoller H, Rauch S, et al. R2* relaxometry for the quantification of hepatic iron overload: biopsy-based calibration and comparison with the literature. RoFo Fortschr Röntgenstr 2015;187:472-9.
4. Zhong X, Nickel MD, Kannengiesser SA, Dale BM, Kiefer B, Bashir MR. Liver fat quantification using a multi-step adaptive fitting approach with multi-echo GRE imaging. Magnetic Resonance in Medicine 2014;72:1353-65.
5. Wunderlich AP, Schmidt SA, Mauro V, et al. Liver Iron Content Determination Using a Volumetric Breath-Hold Gradient-Echo Sequence With In-Line R2* Calculation. JMRI 2020;52:1550-6.
6. Doyle E, Ghugre N, Coates TD, Wood JC. Fixing the MRI R2-iron calibration in liver. American journal of hematology 2020;95:E120-e2.
7. Jensen JH, Tang H, Tosti CL, et al. Separate MRI quantification of dispersed (ferritin-like) and aggregated (hemosiderin-like) storage iron. Magnetic Resonance in Medicine 2010;63:1201-9.
Figures